
| Company | Aug 25 | Sep 25 | Oct 25 | Nov 25 | Dec 25 | Jan 26 | Feb 26 | Mar 26 | Apr 26 | May 26 | Jun 26 | Jul 26 | 12-Mo |
|---|---|---|---|---|---|---|---|---|---|---|---|---|---|
| ERIC | +9% | +7% | +22% | -5% | +1% | +12% | +7% | -3% | +6% | +11% | -15% | -12% | +40% |
| HPE | +9% | +9% | -1% | -10% | +10% | -10% | -0% | +12% | +21% | +50% | +5% | +6% | +136% |
| NOK | +5% | +12% | +44% | -12% | +6% | -1% | +20% | +4% | +61% | +15% | -11% | -31% | +124% |
| CSCO | +1% | -1% | +7% | +5% | +0% | +2% | +1% | -2% | +19% | +32% | -2% | -1% | +74% |
| CIEN | +1% | +55% | +30% | +8% | +15% | +8% | +38% | +11% | +36% | +10% | -15% | -23% | +306% |
| ASML | +7% | +30% | +10% | +0% | +1% | +33% | +2% | -9% | +9% | +12% | +23% | -18% | +136% |
Source: Yahoo Finance monthly adjusted close.
Quick Thesis
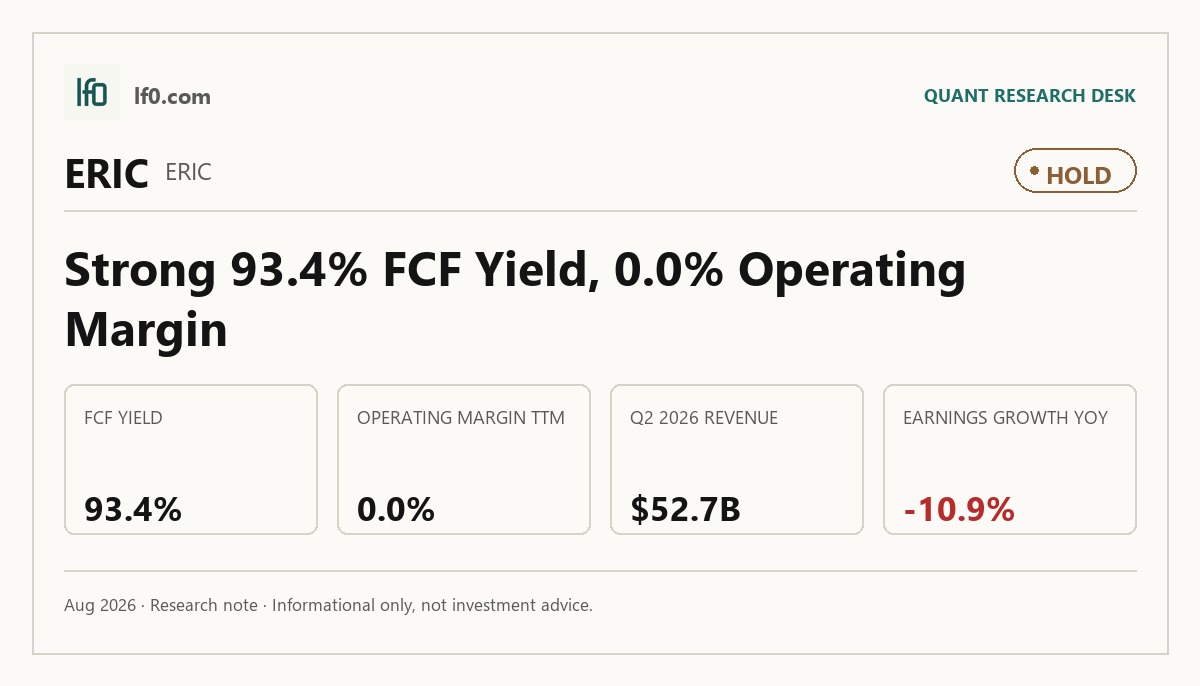
- Rated Hold — cash-rich, but operating margin is still breakeven.
- Strongest support: $30.7B levered free cash flow TTM.
- Main risk: 0.0% TTM operating margin leaves little operating cushion.
- Valuation is mixed: 13.1x trailing P/E and 0.33x price/book, but 93.4% FCF yield.
- I would turn more constructive if operating margin stays positive for several quarters.
Executive Summary
Rating: HOLD | ERIC
Measured from adjusted close on 2026-08-31 to 2026-10-20. Sell ratings are correct when the stock falls; Hold is tracked as a +/-10% range. Daily-close data, not intraday. Calls are tracked for 182 days from publication, then frozen as a final record.
I would put my rating as a Hold because Ericsson’s cash generation is unusually strong, but the core operating engine is still not proving durable enough to justify a more aggressive call. The company posted a 93.4% TTM FCF yield and 37.7% debt/equity, which tells me the equity is supported by cash and not stretched on leverage, yet TTM operating margin is still 0.0% and quarterly earnings growth was -10.9%, so the operating base is not giving me the same confidence as the cash flow line. In my view, the market is already paying for a rerating, but the revenue base remains choppy, with Q2 2026 revenue at $52.7B after $49.3B in Q1 2026. I would raise my rating more towards a Buy if Ericsson can hold revenue above $52B for the next two quarters and move operating margin into positive territory for several consecutive periods, meaning the business is generating profit from operations rather than relying on below-the-line support.
Company Profile
Telefonaktiebolaget LM Ericsson is a Swedish communications technology company headquartered in Kista, Stockholm, and listed on Nasdaq Stockholm under ERIC B, with American Depository Shares representing one underlying Class B share in New York. It sells mobile connectivity solutions to communications service providers, enterprises, and the public sector through Networks, Cloud Software and Services, Enterprise, and Other. The parent company mainly handles corporate management, holding company functions, internal banking, and customer credit management. In 2025, Ericsson had about 15,000 direct suppliers and seven major manufacturing and assembly sites, with regional supply hubs across Europe, the Americas, the Middle East, and Asia. Its manufacturing footprint spans Sweden, China, Estonia, Brazil, the United States, Romania, and Mexico.
Economic Moat
Business Model
The most defensible part of Ericsson’s model is the installed base of programmable, energy-efficient mobile networks that operators and public-sector customers already rely on, because I do not think a well-funded entrant can recreate that footprint, integration depth, and supplier ecosystem within 3 years. That advantage is broader than hardware alone: Ericsson’s value chain spans 15,000 direct suppliers in 2025, with about 200 supplying materials and components used in hardware, and it runs supply and component hubs across Sweden, Belgium, Germany, the Netherlands, the United States, Mexico, the United Arab Emirates, India, Malaysia, Singapore, and China. The enterprise layer, including Global Communications Platform, Wireless Wide Area Networks, and private 5G networks, extends the same connectivity stack into corporate use cases, but I still see the core mobile-network franchise as the real moat. Ericsson had 7 major production sites in 2025, unchanged from 2024 and 2023, with 58.2 thousand square meters of floor space, which suggests a stable operating footprint rather than a business that needs constant physical expansion to defend share.
Five years ago, Ericsson’s footprint was more concentrated in legacy telecom hardware and a narrower set of operating geographies; today it is a broader connectivity platform spanning Networks, Cloud Software and Services, and Enterprise. That shift matters because more of the value now sits in software, integration, and customer stickiness rather than only in box sales. In 2023, the company’s major manufacturing footprint totaled 61.0 thousand square meters across 7 sites, versus 58.2 thousand square meters across 7 sites in 2025, so the physical base has stayed stable while the product mix has evolved. The 2018 wind-down in Iran and the absence of any business engagements in Iran in 2025 also leave a cleaner geographic risk profile than in earlier years. I would call the business model structurally stronger than 5 years ago, mainly because the company has broadened beyond legacy hardware while keeping a defensible installed base that is not easy to displace.
Business & Operating Risks
According to the risk factors in Ericsson’s SEC 10-K, the business still depends on a global electronics supply chain and on customers that can delay or reduce network spending, which can make quarterly results lumpy even when the long-term franchise is intact. The company also remains exposed to patent disputes, regulatory scrutiny, and foreign-exchange swings, all of which can pressure margins or cash conversion without warning. I do not see those risks as breaking the moat itself; they are more a reminder that the moat is built on scale, integration, and customer relationships, not on immunity from execution noise. The disclosed risks pressure the timing of earnings, but they do not, in my view, threaten the installed-base advantage that underpins the business model.
Management Discussion & Analysis
Management is signalling a heavier push into R&D and network software, not a balance-sheet reset: R&D expenses were SEK 48.9B in 2025 versus SEK 53.5B in 2024 and SEK 50.7B in 2023, while the patent portfolio stayed above 60,000 granted patents. That tells me Ericsson is still funding its technology base even after trimming spend, but the 2025 cut versus 2024 also says management is being more selective with capital. The filing says around 50% of the world’s mobile 5G traffic excluding China runs over Ericsson’s radio networks, which is a strong proof point for relevance, yet it does not by itself show that leadership is translating into faster earnings or cash conversion. Management is clearly responding to the risk of slower spending by protecting the core technology stack, but I do not see a new buyback, acquisition, or debt-reduction step in the text provided. In my view, that keeps the message constructive on competitiveness and still open on capital allocation.
In 2024, management framed the business around continued technology leadership and higher R&D investment, and the 2025 filing is broadly consistent with that message, but the numbers show a more restrained version of the same plan rather than an acceleration. The clearest match is the patent strategy: prior filings emphasized protecting and licensing intellectual property, and the current filing still points to a portfolio of more than 60,000 granted patents. What has not been fully proven is the payoff, because R&D fell to SEK 48.9B in 2025 from SEK 53.5B in 2024 while the filing still leans on leadership language. I do not see a CEO or CFO change in the current text provided, so there is no obvious leadership-transition issue to flag. Management credibility is adequate rather than high: the strategy is consistent, but the financial payoff is not yet obvious enough for me to call it a clear win.
Recent Events
The most important recent development is not a deal or a leadership change but the continued shift toward a broader, software-enabled network platform. That matters for the moat because it suggests Ericsson is trying to defend the installed base with more recurring software and integration content, not just with hardware refresh cycles. The 2025 manufacturing footprint was stable at 7 sites, and the company’s geographic exposure looks cleaner than it did in earlier years, so recent changes appear incremental rather than disruptive. I see that as supportive of the moat thesis, but not a new catalyst on its own.
Financial Analysis
Growth
ERIC — Financial Growth (Quarterly, USD Mil)
| Metric | 2025-06-30 | 2025-09-30 | 2025-12-31 | 2026-03-31 | 2026-06-30 |
|---|---|---|---|---|---|
| REVENUE (USD Mil) | 56,132 | 56,239 | 69,285 | 49,332 | 52,691 |
| EBIT (USD Mil) | 7,352 | 15,674 | 11,333 | 1,844 | 6,421 |
| EBITDA (USD Mil) | 9,529 | 17,803 | 13,186 | 3,830 | 8,409 |
| NET INCOME (USD Mil) | 4,567 | 11,149 | 8,563 | 888 | 4,046 |
| DILUTED EPS | 1.4 | 3.3 | 2.6 | 0.3 | 1.2 |
Source: Yahoo Finance — Quarterly Financial Statements
Revenue rose from $49.3B in Q1 2026 to $52.7B in Q2 2026, while EBITDA moved to $8.4B from $3.8B and net income rebounded to $4B from $0.9B. That rebound is encouraging, but the quarterly path is still lumpy rather than steadily compounding, and the TTM growth table shows revenue down 6.1%, which tells me the business has not yet re-established a clean growth trend. The Q1-to-Q2 improvement looks more like a recovery from a weak quarter than a durable acceleration, so I would not overread it as a new growth phase. The revenue pattern is consistent with a business that still depends on large project timing and customer spending cycles, which is normal for network infrastructure but limits how much multiple expansion growth alone can support.
Profitability
ERIC — Profitability (TTM)
| Metric | TTM |
|---|---|
| Operating Margin (TTM) | 0.0% |
| Net Margin (TTM) | 10.8% |
| Return on Assets (TTM) | 6.9% |
| Return on Equity (TTM) | 26.1% |
Source: Yahoo Finance — Trailing Twelve Months (TTM)
TTM operating margin was 0.0%, while TTM net margin was 10.8%, TTM return on assets was 7.0%, and TTM return on equity was 26.1%. The zero operating margin tells me the core business is only just covering operating costs, so I would not treat the latest earnings base as fully normalized. By contrast, the 10.8% net margin shows Ericsson is still converting the bottom line into profit, helped by items below operating profit rather than pure operating strength. The 26.1% ROE versus 7.0% ROA gap implies returns are being amplified by leverage or a thin equity base, so that return profile is less durable than the headline ROE suggests if conditions tighten. I weight operating margin most heavily here because it is the clearest read on whether the business is moving toward sustained profitability.
Valuation
ERIC — Valuation Multiples
| Metric | Value |
|---|---|
| Market Cap (USD Mil) | 32,870 |
| Trailing P/E | 13.1 |
| Forward P/E | 16.1 |
| Price/Book (mrq) | 0.3 |
| Beta (5Y Monthly) | 0.50 |
| FCF Yield % (TTM) | 93.4% |
| Forward EPS (USD) | 0.6 |
| Analyst Target Price – Low (USD) | 8 |
| Analyst Target Price – Mean (USD) | 9.7 |
| Analyst Target Price – High (USD) | 11.4 |
| # Analyst Opinions | 6 |
Source: Yahoo Finance
Ericsson screens on earnings, not sales, with a 13.1x trailing P/E and a 16.1x forward P/E, which implies the market is paying for a modest profit step-down rather than a deep re-rating. Price/book is 0.3x, which is low in absolute terms, but in a capital-light, patent-driven business it mainly reflects the market’s caution around the asset base rather than a clean liquidation discount. The 93.4% TTM FCF yield is unusually high relative to the 32.9B market cap, and that is the single strongest support for the shares. On the analysis here, I would put fair value in a range of $8–$11.4, which brackets the analyst target range of $8 to $11.4 from 6 opinions; my range sits inside consensus, but I weight the weak operating margin more heavily than the market appears to. I would also frame forward EPS at about 0.6–0.7, versus the company’s own 0.6 forward EPS and below the richer earnings power implied by peers such as CSCO and ASML, so Ericsson looks cheaper on cash yield than on earnings quality. That is why I do not call it outright cheap: the cash flow is real, but the operating base still needs to prove it can support that cash generation over time.
Leverage
ERIC — Leverage & Coverage (Quarterly)
| Metric | Value |
|---|---|
| Total Debt/Equity % (mrq) | 37.7 |
| Current Ratio (mrq) | 1.1 |
| Levered Free Cash Flow (TTM, USD Mil) | 30,705.9 |
Source: Yahoo Finance — Quarterly Financial Statements
Total debt/equity was 37.7% mrq, and the current ratio was 1.1x mrq, which gives Ericsson only a modest liquidity cushion. Levered free cash flow was $30.7B, and that is a very strong cash figure on its face, but it is hard to judge cash conversion fully without operating cash flow. The balance sheet does not look stressed, and the cash generation gives management room to keep investing without immediate financing pressure. The tension is that the same cash strength is not yet matched by operating margin, so the thesis depends on cash staying high while the core business improves.
Insider Activity
No meaningful insider activity stands out in the material provided, so I do not see this as a separate driver of the thesis. For me, the more important question is whether the cash flow and operating margin trend improve enough to justify a higher rating.
Comparable Analysis
Growth
| Company | Revenue TTM (USD Mil) | Revenue Growth YoY % | Diluted EPS TTM |
|---|---|---|---|
| ERIC | — | -6.1% | 0.8 |
| HPE | 38,794 | 40.0% | 1.1 |
| NOK | 20,394 | 8.4% | 0.1 |
| CSCO | 63,325 | 17.6% | 3.3 |
| CIEN | 5,569.1 | 39.5% | 3 |
| ASML | 35,327.5 | 21.3% | 29.7 |
Source: Yahoo Finance
ERIC’s revenue fell 6.1% TTM, while HPE grew 40.0%, NOK 8.4%, CSCO 17.6%, CIEN 39.5%, and ASML 21.3%. That is a clear growth discount to every peer in the set, and I do not think the gap is justified because ERIC’s own quarterly earnings growth is still -10.9% while the faster names are compounding from a stronger base. The market is paying for a recovery that has not yet shown up in Ericsson’s top line or earnings, so the growth comparison remains a headwind for the stock.
Valuation
| Company | Trailing P/E | Forward P/E | EV/Revenue | EV/EBITDA | Price/Sales (TTM) | Price/Book (mrq) | Market Cap (USD Mil) | FCF Yield % (TTM) | Forward EPS | Analyst Target Price – Low | Analyst Target Price – Mean | Analyst Target Price – High | # Analyst Opinions |
|---|---|---|---|---|---|---|---|---|---|---|---|---|---|
| ERIC | 13.1 | 16.1 | — | — | — | 0.3 | 32,870 | 93.4% | 0.6 | 8 | 9.7 | 11.4 | 6 |
| HPE | 49.1 | 12.9 | 2.2 | 15.2 | 1.8 | 2.7 | 69,587 | 5.5% | 4.1 | 28 | 65.3 | 80 | 19 |
| NOK | 71.8 | 20.2 | 2.7 | 21.3 | 2.8 | 2.3 | 56,294 | 2.1% | 0.5 | 8.5 | 15 | 21 | 9 |
| CSCO | 33.1 | 19.7 | 7.1 | 24 | 6.9 | 8.7 | 434,799 | 2.7% | 5.6 | 115 | 137.7 | 170 | 23 |
| CIEN | 125.1 | 38.7 | 9.7 | 68.7 | 9.5 | 18.3 | 52,955 | 1.3% | 9.7 | 270 | 557.3 | 720 | 19 |
| ASML | 57 | 28.1 | 1,024.4 | 2,682.9 | 18.4 | 1,420.2 | 650,118 | 1.3% | 60.2 | 897.8 | 2,146.1 | 2,881.9 | 16 |
Source: Yahoo Finance
ERIC’s 93.4% FCF yield is far above HPE’s 5.5%, NOK’s 2.1%, CSCO’s 2.7%, CIEN’s 1.3%, and ASML’s 1.3%, which makes ERIC look optically cheap on cash generation. But the peer spread is distorted by ERIC’s much smaller scale and weak growth, and its 16.1x forward P/E is above HPE’s 12.9x and below NOK’s 20.2x, so the market is not giving ERIC a full growth multiple despite the cash yield. On a growth-adjusted basis, that leaves ERIC looking more balanced than cheap: the cash yield is exceptional, but the earnings base is not yet strong enough to justify a premium. The 0.33x price/book and 0.62 forward EPS also show that the market is still discounting the quality of the earnings stream relative to the larger peers.
Profitability
| Company | Operating Margin (TTM) | Net Margin (TTM) | Return on Assets (TTM) | Return on Equity (TTM) | Gross Margin (TTM) | EBITDA Margin (TTM) |
|---|---|---|---|---|---|---|
| ERIC | 0.0% | 10.8% | 6.9% | 26.1% | — | — |
| HPE | 8.7% | 4.0% | 2.0% | 6.3% | 33.8% | 14.5% |
| NOK | 7.9% | 3.5% | 3.1% | 3.5% | 45.5% | 12.8% |
| CSCO | 27.7% | 21.0% | 8.0% | 27.3% | 64.6% | 29.4% |
| CIEN | 15.2% | 7.9% | 6.7% | 15.5% | 43.0% | 14.1% |
| ASML | 37.1% | 30.1% | 16.5% | 53.9% | 52.7% | 38.2% |
Source: Yahoo Finance
ERIC’s operating margin is 0.0%, net margin is 10.8%, ROA is 7.0%, and ROE is 26.1%. That ROE is well above HPE’s 6.3%, NOK’s 3.5%, CIEN’s 15.5%, and CSCO’s 27.3%, but the 0.0% operating margin tells me the return profile is being driven by below-the-line items and balance-sheet structure rather than operating strength. CSCO’s 27.7% operating margin and ASML’s 37.1% show what stronger operating quality looks like, so Ericsson’s profitability is respectable but not peer-leading on the metric that matters most to me.
Leverage
| Company | Total Debt/Equity % (mrq) | Current Ratio (mrq) | Free Cash Flow TTM (USD Mil) |
|---|---|---|---|
| ERIC | 37.7 | 1.1 | 30,705.9 |
| HPE | 84 | 1.1 | 3,836 |
| NOK | 15.8 | 1.5 | 1,182.9 |
| CSCO | 58.7 | 0.9 | 11,568 |
| CIEN | 54.6 | 2.7 | 700.9 |
| ASML | 9.1 | 1.3 | 8,437.7 |
Source: Yahoo Finance
ERIC’s debt/equity is 37.7%, below HPE’s 84.0% and CSCO’s 58.7%, but above NOK’s 15.8% and ASML’s 9.1%. Its current ratio of 1.1x is slightly better than HPE’s 1.1x and weaker than NOK’s 1.5x or ASML’s 1.3x, while the $30.7B FCF figure is far stronger than HPE’s $3.8B and CSCO’s $11.6B. That combination helps explain why Ericsson trades on a lower-risk cash profile than some peers even though its growth is weaker; in other words, the balance sheet supports the valuation, but it does not by itself create a growth premium.
Conclusion
The key tension is simple: Ericsson throws off a huge amount of cash, but its operating margin is still only breakeven, so I do not yet see proof that the cash flow can be sustained by the core business alone. I would put my rating as a Hold because the 93.4% FCF yield and 37.7% debt/equity give the stock a real floor, yet the 0.0% operating margin and -10.9% quarterly earnings growth tell me the operating recovery is not complete. That is why I think the current valuation is supported, but not obviously cheap enough to justify a more aggressive call.
I would raise my rating more towards a Buy if Ericsson can hold revenue above $52B for the next two quarters and move operating margin into positive territory for several consecutive periods, meaning the business is generating profit from operations rather than relying on below-the-line support. If operating margin moved from 0.0% to even 3.0% on a roughly $52.7B quarterly revenue base, that would imply about $1.6B of incremental quarterly operating profit versus breakeven, which would materially improve the earnings base and make the current 16.1x forward P/E easier to justify. I would also watch whether the company starts to convert that cash into a clearer capital-allocation step, because the current cash generation is strong enough to support either more investment or a more explicit return of capital.
I would move from Hold to Sell if revenue slips back below $50B in a quarter and the 93.4% free cash flow yield starts to compress because cash generation is no longer holding up against market value. A second warning sign would be a sustained drop in quarterly earnings growth deeper than the current -10.9%, because that would tell me the rerating has run ahead of the underlying business and the 0.33x price/book is reflecting weaker operating quality rather than a bargain.
Weighing both paths, I lean to Hold because the cash floor is real and the balance sheet is not stretched, but the next leg higher needs proof in operating margin, not just a high FCF yield. If Ericsson can convert the current cash generation into a positive operating margin over the next few quarters, I would become more constructive; if it cannot, the rerating already in the share price will be harder to defend.
What to Watch Next
- Revenue above $52B for two more quarters — would support a move toward Buy.
- Operating margin turning positive and staying there — would show the core business is improving.
- Quarterly earnings growth improving from -10.9% — would confirm the rerating is backed by fundamentals.
- FCF yield staying near 93.4% — would keep the valuation floor intact.
- Any explicit capital-allocation step — would show management is using cash more decisively.
What’s your take? I rated Ericsson (ERIC) HOLD above — but the goal here is to get this right, not just to publish an opinion. What would you add to this analysis, or which risk or catalyst do you think I’m under- or over-weighting? Tell me in the comments.
Data sourced from Yahoo Finance and SEC EDGAR. Not investment advice.
Leave a Comment