
| Company | Aug 25 | Sep 25 | Oct 25 | Nov 25 | Dec 25 | Jan 26 | Feb 26 | Mar 26 | Apr 26 | May 26 | Jun 26 | Jul 26 | 12-Mo |
|---|---|---|---|---|---|---|---|---|---|---|---|---|---|
| HST | +9% | +0% | -6% | +10% | +3% | +5% | +6% | -1% | +10% | +9% | +7% | +6% | +73% |
| PK | +10% | -4% | -7% | +5% | -1% | +4% | +3% | -5% | +9% | +6% | +20% | +6% | +54% |
| APLE | +12% | -7% | -6% | +7% | +0% | -1% | +6% | -5% | +18% | +10% | +15% | -1% | +51% |
| DRH | +11% | -6% | -2% | +16% | -0% | +2% | +9% | -6% | +9% | +8% | +12% | +9% | +79% |
| RHP | +4% | -8% | -3% | +10% | +0% | +0% | +4% | -5% | +14% | +10% | +13% | +4% | +47% |
| EPR | -1% | +7% | -15% | +7% | -4% | +9% | +10% | -15% | +12% | +3% | +2% | +8% | +20% |
Source: Yahoo Finance monthly adjusted close.
Executive Summary
Rating: HOLD | HST
Measured from adjusted close on 2026-08-10 to 2026-09-25. Sell ratings are correct when the stock falls; Hold is tracked as a +/-10% range. Daily-close data, not intraday. Calls are tracked for 182 days from publication, then frozen as a final record.
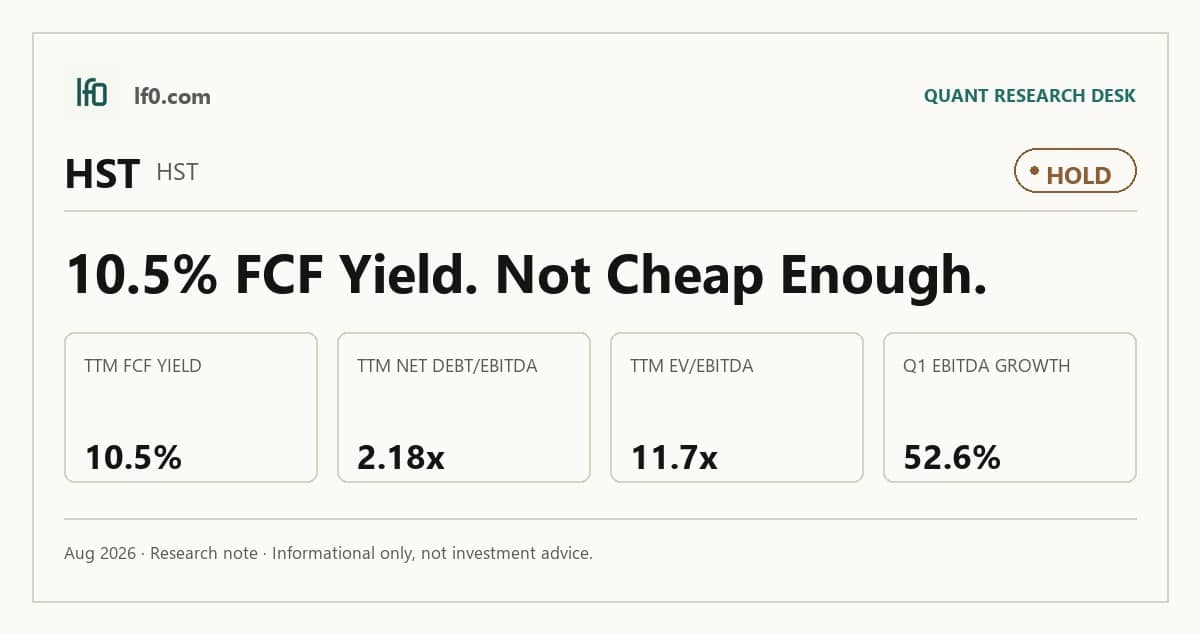
I would put my rating as a Hold because Host Hotels & Resorts has a real cash-flow cushion, but the stock already discounts a fair amount of recovery. The company generated a 10.5% TTM FCF yield and 2.2x net debt/EBITDA, which supports the equity, yet it also trades at 15.6x trailing P/E and 22.2x forward P/E, so I do not see enough valuation gap to call it a Buy. In my view, the key question is whether 2026 margin improvement can outpace the capex cycle and keep leverage from becoming the binding constraint. I would raise my rating more towards a Buy if comparable hotel EBITDA margin moves back above 29.0%, meaning the 2025 level is a floor rather than a peak.
Company Profile
Host Hotels & Resorts is the largest publicly traded lodging REIT, owning 76 primarily luxury and upper upscale hotels with about 41,700 rooms as of February 20, 2026. It earns revenue from room sales, food and beverage, and other hotel income, while third-party managers operate the properties under long-term agreements that typically run 10 to 50 years. The company was founded as a Maryland corporation in 1998, operates through Host L.P. in which it holds about 99% of the partnership interests, and trades on Nasdaq under HST. Its portfolio is concentrated in the United States, with five hotels in Brazil and Canada, and includes 29 properties with more than 500 rooms. Expansion is funded through hotel sales, equity, debt, cash, and its credit facility, alongside selective joint ventures such as Noble Hospitality Fund V, a lodging investment fund.
Economic Moat
Business Model
The portfolio of 76 primarily luxury and upper upscale hotels is the core advantage because I feel a competitor cannot quickly assemble that mix of branded, high-barrier assets in the same urban and resort markets. According to their SEC filings, 64% of 2025 hotel revenues were managed or franchised by Marriott International, so the brand and distribution layer helps protect demand and supports loyalty-driven bookings. Host Inc. owns about 99% of Host L.P. OP units and controls day-to-day management through a self-managed REIT structure, while third-party managers handle hotel operations under long-dated agreements. In my view, that combination of scale, brand access, and contractual control is hard to replicate within 3 years.
The business has become more focused and slightly smaller over time. In 2022, the portfolio had 80 hotels and approximately 44,400 rooms; today it has 76 hotels and approximately 41,700 rooms, which means Host has trimmed lower-priority assets rather than chasing room count for its own sake. The company also exited its Asia investment in 2025 through the sale of its 36% share in two India joint ventures, while it now owns non-controlling interests in seven domestic joint ventures. That shift points to capital recycling toward higher-quality lodging assets, and I think it makes the moat cleaner even if the room count is lower.
Business & Operating Risks
The biggest disclosed risk is a cyclical lodging downturn, because the risk factors in their SEC 10-K say demand typically follows the general economy and that the majority of hotels are luxury or upper upscale. That mechanism would hit occupancy, average daily rate, and RevPAR at the same time, so the financial damage would not be limited to one line item. The current financial data already shows how quickly earnings can move when demand softens, which is why I view this as a material headwind rather than background noise.
A second risk is concentration in a small set of markets and weather-exposed destinations. Hotels in New York, Washington, D.C., San Diego, San Francisco, Phoenix, Florida and Hawaii represented approximately 65% of 2025 hotel revenues, and Maui lodging demand has been significantly impacted by the August 2023 wildfires while a significant number of Florida hotels were affected by Hurricanes Helene and Milton in September and October 2024. That concentration means one regional shock can move a large share of revenue, and insurance sub-limits are significantly lower than the total value of hotels in several exposed markets. In my view, this risk does not break the moat, but it does mean the portfolio’s quality is only as good as its ability to absorb localized shocks.
Debt and capital access are the third major pressure point. The company disclosed approximately $5.1B of total debt as of March 31, 2026, and higher rates on the senior notes issued in 2024 and 2025 have already increased interest expense. It also depends on external capital because REIT rules require dividend payouts, and higher rates, rating downgrades, or covenant limits could block financing on acceptable terms. The risk is not that the moat disappears; it is that the balance sheet can turn a good hotel portfolio into a less flexible equity if cash flow weakens.
Management Discussion & Analysis
Management is signalling a capital-allocation tilt toward portfolio upgrading and balance-sheet maintenance rather than broad expansion, and that is the right response to the risks above. In 2026, Host plans to spend $525M to $625M on capital expenditures, including $175M to $210M for the Hyatt and Marriott transformational capital programs, which tells me management is willing to accept near-term disruption to reposition assets that can earn higher returns over time. The company also issued $500M of 5.7% Series M senior notes and $400M of 4.25% Series N senior notes in 2025 and used the proceeds to redeem the $500M Series E and $400M Series F maturities, which pushes the maturity ladder out without shrinking the debt balance. That is a sensible response to refinancing risk, but it does not eliminate the need for operating cash flow to keep improving.
Management’s prior calls were directionally right on demand, but the execution record is mixed once you strip out asset sales and insurance noise. In 2025, management pointed to strong transient demand, Maui recovery, and the 2024 acquisitions as the main drivers of improvement, and the 2026 filing confirms those drivers with comparable hotel RevPAR up 3.8% and Total RevPAR up 4.2% in 2025. By contrast, the transformational capital programs have not yet fully shown up in the numbers: they produced $26M of operating profit guarantees in 2025 and are expected to contribute about $19M in 2026, but group revenue still declined 0.6% in 2025 because renovation disruption and Maui mix shift offset the benefit. I would call that disciplined, but not yet fully proven.
Recent Events
The most important recent development is the May 27, 2026 amendment to Host Hotels’ at-the-market distribution agreement, disclosed on May 28, 2026, which extends the company’s ability to sell up to $600M of common stock and rolls the settlement cycle to T+1. That keeps equity financing optionality alive without forcing immediate issuance, so it supports balance-sheet flexibility and preserves room to fund asset recycling or capex if hotel demand softens.
The May 20, 2026 annual meeting, disclosed on May 22, 2026, was routine but still useful: all nine directors were elected, KPMG LLP was ratified as auditor, and executive compensation passed with about 93% support. In my view, that signals governance continuity rather than strategic change, so it neither strengthens nor weakens the operating thesis on its own. The February 18, 2026 and May 6, 2026 8-Ks were standard quarterly earnings releases with no new structural actions, which leaves the moat intact but not meaningfully strengthened.
Financial Analysis
Growth
HST — Financial Growth (Quarterly, USD Mil)
| Metric | 2025-03-31 | 2025-06-30 | 2025-09-30 | 2025-12-31 | 2026-03-31 | 2026-06-30 |
|---|---|---|---|---|---|---|
| REVENUE (USD Mil) | 1,594 | 1,586 | 1,331 | 1,603 | 1,645 | — |
| EBIT (USD Mil) | 307 | 310 | 232 | 204 | 577 | — |
| EBITDA (USD Mil) | 503 | 505 | 428 | 412 | 767 | — |
| NET INCOME (USD Mil) | 248 | 221 | 161 | 135 | 494 | — |
| DILUTED EPS | — | 0.3 | 0.2 | 0.2 | 0.7 | 0.3 |
Source: Yahoo Finance — Quarterly Financial Statements
Revenue was $1.59e+03M in Q1 2025, $1.59e+03M in Q2 2025, $1.33e+03M in Q3 2025, $1.6e+03M in Q4 2025, and $1.64e+03M in Q1 2026. The sharp Q3 2025 dip versus Q2 2025 was a 16.1% sequential drop, then Q1 2026 rebounded 2.6% sequentially from Q4 2025. EBITDA moved faster than revenue in Q1 2026, rising to $767M from $503M in Q1 2025, up 52.6% year over year, while revenue rose 3.2% year over year. That gap is encouraging because it shows the portfolio can still convert rate and occupancy gains into cash, and the Q3 swing looks more like a seasonal hotel pattern than a structural break.
Profitability
HST — Profitability (TTM)
| Metric | TTM |
|---|---|
| Operating Margin (TTM) | 18.2% |
| Net Margin (TTM) | 16.5% |
| Return on Assets (TTM) | 4.3% |
| Return on Equity (TTM) | 15.6% |
| Gross Margin (TTM) | 29.2% |
| EBITDA Margin (TTM) | 27.2% |
Source: Yahoo Finance — Trailing Twelve Months (TTM)
TTM operating margin was 18.2%, net margin 16.5%, gross margin 29.2%, and EBITDA margin 27.2%, so the business is already past the early scaling phase and is converting a meaningful share of revenue into profit. The 11.0-point gap between gross margin and operating margin shows hotel-level economics are healthy, but property-level overhead and corporate costs still absorb a large slice of revenue. EBITDA margin sits 8.9 points above net margin, so depreciation and amortisation remain a real drag on GAAP earnings, which is normal for an asset-heavy lodging REIT. ROA was 4.3% and ROE 15.6%, and that spread tells me leverage is amplifying returns rather than creating them from scratch. The key watchpoint is whether operating margin can keep rising while net margin closes the gap, because that would show the portfolio is moving further toward durable profitability.
Valuation
HST — Valuation Multiples
| Metric | Value |
|---|---|
| Market Cap (USD Mil) | 16,158 |
| Enterprise Value (USD Mil) | 19,879 |
| Trailing P/E | 15.6 |
| Forward P/E | 22.2 |
| Price/Sales (TTM) | 2.6 |
| Price/Book (mrq) | 2.5 |
| EV/Revenue | 3.2 |
| EV/EBITDA | 11.7 |
| Beta (5Y Monthly) | 1.12 |
| FCF Yield % (TTM) | 10.5% |
| Forward EPS (USD) | 1.1 |
| Analyst Target Price – Low (USD) | 21 |
| Analyst Target Price – Mean (USD) | 25.1 |
| Analyst Target Price – High (USD) | 29 |
| # Analyst Opinions | 20 |
Source: Yahoo Finance
Host Hotels & Resorts trades at 3.19x EV/Revenue and 11.7x EV/EBITDA, with a 2.59x Price/Sales ratio and 2.5x Price/Book. The primary read is EV/Revenue: at 3.2x, the market is paying for a hotel REIT that can keep cash flow stable through the cycle, not for a sharp acceleration in room demand. That is reinforced by the 11.7x EV/EBITDA multiple, which implies investors are underwriting mid-cycle earnings rather than a distressed or peak-earnings outcome.
The stock also screens at 15.6x trailing P/E and 22.2x forward P/E, so the market is assigning a higher multiple to 2026 earnings than to the last twelve months. That gap suggests investors expect earnings to normalize upward from the 2025 base, which is consistent with a lodging owner that can lift rates and occupancy when business travel and group demand improve. With 20 analyst opinions, the consensus target range is $21 to $29, versus a mean of $25.1, and my own fair-value range sits inside that band rather than below it. On the analysis here, I would put fair value around $22 to $27 per share because the cash yield is strong, but leverage and capex keep me from stretching to the top of the analyst range.
I would also frame earnings power in a $1.0 to $1.2 EPS range, which is close to the 1.05 forward EPS in the data and modestly below the peer leaders on a dollar basis. That looks reasonable to me because HST’s earnings are supported by a better cash-conversion profile than most peers, even if the raw EPS number is not the highest in the group. Relative to peers, the market is paying for balance-sheet durability and cash generation more than for the fastest EPS growth, which fits the rest of the thesis.
The merged rating justification also points the same way: 3.6% TTM revenue growth and 11.7x EV/EBITDA do not make the stock cheap enough for a clear Buy, while 2.2x net debt/EBITDA and a 10.5% FCF yield keep downside cushioned. I think that is a fair Hold setup.
Leverage
HST — Leverage & Coverage (Quarterly)
| Metric | Value |
|---|---|
| Total Debt/Equity % (mrq) | 85.3 |
| Current Ratio (mrq) | 1.7 |
| Total Debt (mrq, USD Mil) | 5,645 |
| Net Debt/EBITDA (TTM) | 2.2 |
| FCF Margin % (TTM) | 27.2% |
Source: Yahoo Finance — Quarterly Financial Statements
Host Hotels’ leverage is manageable, not a balance-sheet advantage. Total debt/equity was 85.3% mrq, current ratio was 1.671x mrq, and total debt was $5645B mrq, so the capital structure is meaningfully levered but still supported by near-term liquidity. Cash generation is the offset: operating cash flow was $1606B TTM, levered free cash flow was $1692B TTM, net debt/EBITDA was 2.2x TTM, and FCF margin was 27.2% TTM. That combination tells me EBITDA is converting well into cash, which gives Host room to absorb a softer lodging environment and continue funding capex and distributions without immediate refinancing pressure. The one nuance I would flag is that levered free cash flow is higher than operating cash flow here because the company’s cash after capital spending and financing items is being measured on a different basis, so the two figures are not meant to be read as a simple hierarchy. In my opinion, this is medium refinancing risk because the current ratio gives cushion, but the $5.6B debt load still leaves the company exposed if hotel cash flow weakens or if refinancing lands in a higher-rate window.
Insider Activity
The insider transaction record I see here is one-sided: 5 open-market sales for $2.0M and no open-market purchases in the 2025-02-05 to 2026-05-26 window. The selling is concentrated, with Nathan S. Tyrrell accounting for two of the three most recent sales, while other insiders only show neutral awards or tax withholding. I view that as a bear signal because the open-market activity points to insider distribution rather than alignment through buying.
Comparable Analysis
Growth
| Company | Revenue TTM (USD Mil) | Revenue Growth YoY % | Diluted EPS TTM |
|---|---|---|---|
| HST | 6,234 | 3.6% | 1.5 |
| PK | 2,545 | 1.0% | -0.8 |
| APLE | 1,440.6 | 4.7% | 0.7 |
| DRH | 1,136.4 | 4.1% | 0.7 |
| RHP | 2,733.8 | 13.6% | 4.1 |
| EPR | 739 | 10.6% | 3.1 |
Source: Yahoo Finance
HST’s 3.6% revenue growth in TTM puts it in the middle of the peer set rather than at the top. It trails RHP at 13.6% and EPR at 10.6%, but it is ahead of PK at 1.0%, APLE at 4.7%, and DRH at 4.1%, so the print supports a premium to the slower growers without justifying a top-of-group multiple. HST’s 1.5 TTM diluted EPS also sits below RHP’s 4.1 and EPR’s 3.1, which tells me the market is paying for steadier cash generation rather than the fastest earnings base.
Valuation
| Company | Trailing P/E | Forward P/E | EV/Revenue | EV/EBITDA | Price/Sales (TTM) | Price/Book (mrq) | Market Cap (USD Mil) | Enterprise Value (USD Mil) | Beta (5Y Monthly) | FCF Yield % (TTM) | Forward EPS | Analyst Target Price – Low | Analyst Target Price – Mean | Analyst Target Price – High | # Analyst Opinions |
|---|---|---|---|---|---|---|---|---|---|---|---|---|---|---|---|
| HST | 15.6 | 22.2 | 3.2 | 11.7 | 2.6 | 2.5 | 16,158 | 19,879 | 1.12 | 10.5% | 1.1 | 21 | 25.1 | 29 | 20 |
| PK | — | 27.7 | 2.7 | 11.6 | 1.2 | 1 | 2,972 | 6,753 | 1.34 | — | 0.5 | 11 | 14.7 | 20 | 16 |
| APLE | 21.9 | 22.7 | 3.8 | 12 | 2.7 | 1.2 | 3,820 | 5,414 | 0.88 | 9.4% | 0.7 | 16 | 16.5 | 17.5 | 9 |
| DRH | 17.4 | 21.2 | 3.2 | 12.2 | 2.3 | 1.7 | 2,574 | 3,660 | 1 | 3.0% | 0.6 | 10 | 13.3 | 16 | 13 |
| RHP | 29.5 | 25.5 | 4.3 | 14.1 | 2.8 | 10.3 | 7,626 | 11,788 | 1.20 | 7.4% | 4.7 | 120 | 132.9 | 150 | 13 |
| EPR | 19.9 | 20 | 11.2 | 14.4 | 6.4 | 2.1 | 4,765 | 8,280 | 1.02 | 7.1% | 3.1 | 58 | 63.4 | 70.5 | 10 |
Source: Yahoo Finance
HST’s 3.2x EV/Revenue and 11.7x EV/EBITDA sit below RHP’s 4.3x and 14.1x, but above PK’s 2.7x and DRH’s 3.2x on EV/Revenue. The cleanest read is HST’s 10.5% FCF yield versus APLE at 9.4%, RHP at 7.4%, EPR at 7.1%, and DRH at 3.0%, which is the better anchor here because cash conversion is harder to dress up than P/E. HST’s 1.1 forward EPS is below RHP’s 4.7 and EPR’s 3.1, so the market is paying for a stronger cash profile rather than superior near-term earnings. Using the peer EV/Revenue range of 2.7x to 11.2x on HST’s $6.2B TTM revenue gives an implied enterprise value of roughly $16.8B to $69.7B; netting HST’s $5.6B debt and $2B cash and dividing by 684.9M shares yields an illustrative $17.8 to $91.4 per share range, which is wide because EPR is an outlier on EV/Revenue and should not be treated as a clean comp. A $1 invested in HST a year ago would be worth $1.6 today, ahead of PK at $1.6, APLE at $1.5, RHP at $1.4, and EPR at $1.2, so the stock has already earned some credit for the recovery.
Profitability
| Company | Operating Margin (TTM) | Net Margin (TTM) | Return on Assets (TTM) | Return on Equity (TTM) | Gross Margin (TTM) | EBITDA Margin (TTM) |
|---|---|---|---|---|---|---|
| HST | 18.2% | 16.5% | 4.3% | 15.6% | 29.2% | 27.2% |
| PK | 17.6% | -6.4% | 2.7% | -4.9% | 30.9% | 22.8% |
| APLE | 22.4% | 12.2% | 3.3% | 5.5% | 42.9% | 31.4% |
| DRH | 23.0% | 13.5% | 3.8% | 9.9% | 29.4% | 26.4% |
| RHP | 23.3% | 9.9% | 5.4% | 22.6% | 35.2% | 30.6% |
| EPR | 54.3% | 35.6% | 4.2% | 11.3% | 91.9% | 77.7% |
Source: Yahoo Finance
HST’s 18.2% operating margin and 27.2% EBITDA margin are above PK’s 17.6% and 22.8%, but below APLE’s 22.4% and 31.4%, DRH’s 23.0% and 26.4%, and far behind EPR’s 54.3% and 77.7%. HST’s 29.2% gross margin is close to PK’s 30.9% and DRH’s 29.4%, which points to a similar cost-of-revenue structure, while the wider gap in operating margin versus APLE and DRH looks more like scale and overhead efficiency than a product-level disadvantage. ROE of 15.6% and ROA of 4.3% are respectable, and they sit above PK’s -4.9% ROE and 2.7% ROA, which tells me HST is converting its asset base into returns more cleanly than the weakest peer.
Leverage
| Company | Total Debt/Equity % (mrq) | Current Ratio (mrq) | Total Debt (mrq, USD Mil) | Free Cash Flow TTM (USD Mil) | Net Debt/EBITDA (TTM) | FCF Margin % (TTM) |
|---|---|---|---|---|---|---|
| HST | 85.3 | 1.7 | 5,645 | 1,692.4 | 2.2 | 27.2% |
| PK | 135.2 | 0.3 | 4,102 | — | 6.6 | — |
| APLE | 51.4 | 0.3 | 1,613.3 | 360.9 | 3.5 | 25.1% |
| DRH | 78.2 | 5.6 | 1,196.3 | 76.1 | 3.6 | 6.7% |
| RHP | 334.6 | 1.3 | 4,132.6 | 568 | 4.5 | 20.8% |
| EPR | 152.2 | 1.7 | 3,524.9 | 337.7 | 6.1 | 45.7% |
Source: Yahoo Finance
HST’s 85.3% debt/equity is above APLE’s 51.4% and DRH’s 78.2%, but its 2.2x net debt/EBITDA is lower than APLE’s 3.5x, DRH’s 3.6x, PK’s 6.6x, and EPR’s 6.1x. That gap matters because HST’s 27.2% FCF margin and $1.7B of TTM free cash flow are doing real work, so the balance sheet is manageable even if it is not a moat in itself. The current ratio of 1.7x also compares favorably with PK’s 0.3x and APLE’s 0.3x, which gives HST more room to absorb a weaker lodging tape than the more stretched names.
Conclusion
I would put my rating as a Hold because the core tension is still unresolved: Host Hotels has enough cash generation to support the equity, but not enough valuation discount to ignore the leverage and capex cycle. The latest numbers show that the risk is not yet showing up as a full earnings break — Q1 2026 EBITDA was $767M, up 52.6% year over year — but the company is still carrying $5645B of debt, so the thesis depends on margin improvement rather than balance-sheet repair.
I would raise my rating more towards a Buy if comparable hotel EBITDA margin moves back above 29.0%, meaning the 2025 level is a floor rather than a peak, and if the 2026 capital program starts to show through in earnings rather than just in spending. On the current $6.2B revenue base, a 100 basis point margin gain would add roughly $62M of EBITDA, which would improve deleveraging and make the 22.2x forward P/E easier to justify. If RevPAR growth stays in the low single digits while the Hyatt and Marriott transformational programs keep delivering operating profit guarantees, that would tell me the asset mix is finally translating into cash flow rather than just renovation noise.
I would move from Hold to Sell if comparable hotel EBITDA margin slips back below 27.0%, because that would mean the 2025 margin level was not sustainable and the current multiple is too rich for a cyclical lodging owner. A sharper warning would be a repeat of the Q3 2025-style revenue drop, since a 16.1% sequential decline showed how quickly hotel earnings can reset when demand or mix weakens; if that kind of move came back while debt stayed near $5.6B, the equity would be leaning on cash flow that is no longer there.
Weighing both sides, I think the Hold case comes first because the balance sheet still has enough liquidity and the 10.5% FCF yield gives investors a cushion while management works through the capex cycle. The bear case is real, but it needs a clear demand break or a margin reset to take control, and I do not see that in the latest numbers yet.
What’s your take? I rated Host Hotels & Resorts (HST) HOLD above — but the goal here is to get this right, not just to publish an opinion. What would you add to this analysis, or which risk or catalyst do you think I’m under- or over-weighting? Tell me in the comments.
Sources
- SEC 10-K Annual Report — filed 2026-02-25
- SEC 8-K Filing (2026-05-28)
- SEC 8-K Filing (2026-05-22)
- SEC 8-K Filing (2026-05-06)
- SEC 8-K Filing (2026-02-18)
- SEC Form 4 Insider Transaction (2026-05-27)
- SEC Form 4 Insider Transaction (2026-05-27)
- SEC Form 4 Insider Transaction (2026-05-22)
- SEC 10-K Annual Report — FY2026
- SEC 10-K Annual Report — FY2025
- SEC 10-K Annual Report — FY2024
- SEC 10-K Annual Report — FY2023
- SEC 10-K Annual Report — FY2022
Data sourced from Yahoo Finance and SEC EDGAR. Not investment advice.
Leave a Comment