
| Company | Sep 25 | Oct 25 | Nov 25 | Dec 25 | Jan 26 | Feb 26 | Mar 26 | Apr 26 | May 26 | Jun 26 | Jul 26 | Aug 26 | 12-Mo |
|---|---|---|---|---|---|---|---|---|---|---|---|---|---|
| CHTR | +4% | -15% | -14% | +4% | -1% | +14% | -8% | -23% | -13% | -1% | +2% | +5% | -43% |
| T | -4% | -11% | +5% | -5% | +7% | +7% | +3% | -9% | -5% | -17% | +14% | +11% | -7% |
| TMUS | -5% | -12% | -0% | -3% | -3% | +11% | -3% | -7% | -4% | -11% | +3% | +5% | -27% |
| VZ | -1% | -8% | +3% | -1% | +11% | +13% | +0% | -3% | -0% | -11% | +12% | +7% | +21% |
| CMCSA | -8% | -10% | -4% | +12% | +7% | +4% | -7% | -5% | -8% | -1% | -1% | +11% | -12% |
| LUMN | +23% | +68% | -21% | -4% | +14% | -19% | -2% | +27% | +24% | -30% | -17% | -2% | +26% |
Source: Yahoo Finance monthly adjusted close.
Quick Thesis
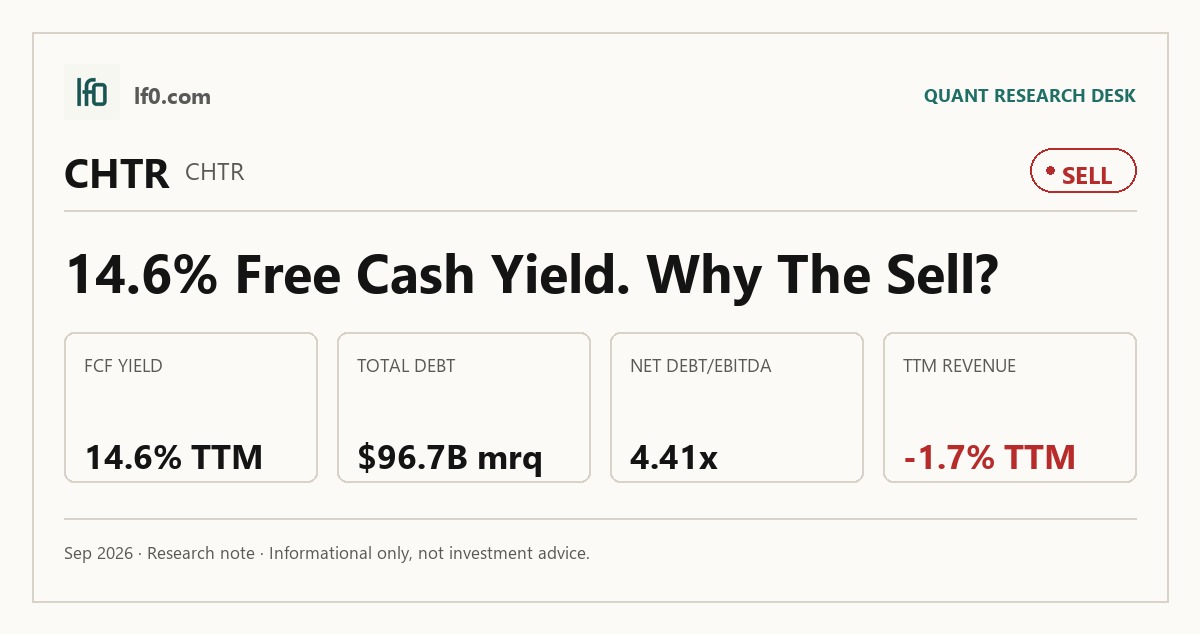
- Rated sell — leverage and subscriber erosion outweigh strong cash generation.
- Free cash flow yield is 14.6%, backed by $2.2B of levered free cash flow.
- The main risk is $96.7B of debt and 4.4x net debt/EBITDA.
- Valuation is cheap on cash flow at 5.3x EV/EBITDA, but not enough for me.
- I would improve the rating only if revenue stabilizes and net debt/EBITDA falls below 4.0x, meaning the balance sheet is actually easing.
Executive Summary
Rating: SELL | CHTR
Measured from adjusted close on 2026-09-24 to 2026-09-25. Sell ratings are correct when the stock falls; Hold is tracked as a +/-10% range. Daily-close data, not intraday. Calls are tracked for 182 days from publication, then frozen as a final record.
I would put my rating as a sell because Charter’s cash generation is real, but the combination of $96.7B of debt, 4.4x net debt/EBITDA, and continued subscriber pressure leaves too little margin for error. The stock looks inexpensive at 5.3x EV/EBITDA and a 14.6% free cash flow yield, yet that valuation is already compensating for a business that still posted a 1.1% revenue decline in Q2 2026 and a 1.7% decline over the latest twelve months.
What matters most to me is whether the company can stop the core broadband base from shrinking while still funding the network. I would move my rating toward a hold if revenue turns flat for two straight quarters and net debt/EBITDA moves below 4.0x, because that would show cash flow is beginning to repair the balance sheet rather than just service it.
Company Profile
Charter Communications is a broadband connectivity company that serves 58 million homes and businesses across 41 states through Spectrum. It earns most of its revenue from monthly subscription fees for Internet, mobile, video, voice, and advertising services, with bundled offers across residential and business customers. The company has shifted from cable television toward fiber-powered broadband, mobile, and streaming distribution, and its network evolution plan uses spectrum expansion, high split, Distributed Access Architecture, and DOCSIS 4.0 to improve speed and capacity over time.
Economic Moat
Business Model
The core advantage is the combination of network reach and bundle depth. Charter’s Spectrum Internet reaches up to 1 Gbps across its footprint, with multi-gigabit service already available in part of the network and broader symmetrical service planned over the next several years; in my view, that mix of coverage, speed, and product breadth is hard for a rival to copy quickly across 58 million homes and businesses.
The operating model adds another layer of stickiness. Charter says in its SEC filings that 100% of employees are U.S.-based and that in-house field operations handled over 80% of customer premise service transactions in 2025, which should support service quality and lower churn if execution stays disciplined. Spectrum Reach also gives the company a local and regional advertising platform across more than 90 markets, so the business monetizes its footprint in more than one way.
Business & Operating Risks
The biggest disclosed risk is leverage, because the company is funding network investment and shareholder returns while carrying a very large debt load. That does not directly break the moat in Business Model, but it does make the moat more expensive to defend: if cash flow weakens, the network advantage still exists, yet the balance sheet could force management to slow the very investments that keep the edge intact.
Competition is the other major threat, especially from fiber, fixed wireless, satellite, DSL, 5G mobile services, and low-cost video alternatives. Those pressures do not erase the moat overnight, but they do test whether Charter’s bundle can keep customers from defecting when rivals offer simpler or cheaper alternatives.
Cybersecurity, regulation, and franchise renewal risk round out the picture. I do not see those risks as destroying the structural advantage, but they can interrupt service, raise compliance costs, and make the moat more expensive to maintain.
Management Discussion & Analysis
Management is responding to the leverage and execution risks, but not by prioritizing deleveraging above all else. Capital spending is still running at about 11.4B in 2026 after 11.7B in 2025, while the company also plans to keep leverage in a 4.0x to 4.5x range before the Liberty Broadband combination closes and then 3.5x to 3.75x afterward. That tells me management is still leaning into network investment and buybacks, even though the balance sheet would normally argue for a more conservative posture.
The operating mix is improving in places, but not enough to call the turnaround complete. Mobile lines rose by 1.9 million in 2025, and the company spent $2.2B on subsidized rural construction, yet 2025 revenue still fell 0.6% because Internet customers declined by 393,000 and video customers fell by 255,000. The company is clearly trying to offset core subscriber pressure with mobile and rural buildout, but the numbers show that the offset is not yet strong enough to restore top-line growth.
Recent Events
The most important recent development is the appointment of Nick Jeffery as chief operating officer, effective September 1, 2026. He comes from Frontier Communications and previously led Vodafone UK and Cable & Wireless, so Charter is bringing in an operator with turnaround and network-execution experience. In my view, that supports the thesis if management wants sharper execution ahead of the Liberty Broadband and Cox transactions.
Shareholders also approved a 16.0 million share increase to the 2019 Stock Incentive Plan at the April 2026 annual meeting. That gives Charter more equity currency for retention and incentives, but it also adds dilution risk at a time when leverage is still the central issue. The new employment agreement for General Counsel Jamal Haughton through May 2028 points in the same direction: management is trying to preserve continuity through a period of transaction complexity.
Financial Analysis
Growth
CHTR — Financial Growth (Quarterly, USD Mil)
| Metric | 2025-06-30 | 2025-09-30 | 2025-12-31 | 2026-03-31 | 2026-06-30 |
|---|---|---|---|---|---|
| EBIT (USD Mil) | 3,172 | 3,002 | 3,231 | 3,084 | 3,275 |
| EBITDA (USD Mil) | 5,348 | 5,162 | 5,425 | 5,295 | 5,472 |
| NET INCOME (USD Mil) | 1,301 | 1,137 | 1,332 | 1,163 | 1,292 |
| DILUTED EPS | 9.2 | 8.3 | 10.3 | 9.2 | 10.7 |
Source: Yahoo Finance — Quarterly Financial Statements
Revenue has been stable quarter to quarter, but the trend is still down rather than flat. It moved from $13.8B in Q2 2025 to $13.5B in Q2 2026, and that decline matters because it shows the company is not yet converting its network investments into top-line growth. EBITDA, by contrast, rose from $5.3B to $5.5B over the same span, so the business is protecting earnings better than sales.
That split is important for the thesis. Charter can still generate cash with modest revenue pressure, but the equity rerating case depends on revenue stabilization first, not just margin management.
Profitability
CHTR — Profitability (TTM)
| Metric | TTM |
|---|---|
| Operating Margin (TTM) | 23.5% |
| Net Margin (TTM) | 9.1% |
| Return on Assets (TTM) | 5.3% |
| Return on Equity (TTM) | 27.2% |
| Gross Margin (TTM) | 55.2% |
| EBITDA Margin (TTM) | 40.1% |
Source: Yahoo Finance — Trailing Twelve Months (TTM)
TTM gross margin of 55.2% and EBITDA margin of 40.1% show that the core service remains highly cash-generative before overhead. Operating margin of 23.5% and net margin of 9.05% confirm that depreciation, amortization, and interest still take a large bite out of reported earnings, which is normal for a capital-intensive network business.
Return on assets of 5.31% and return on equity of 27.2% tell me the equity return is being amplified by leverage. That is useful while cash flow is strong, but it also means the return profile will weaken quickly if financing conditions tighten.
Valuation
CHTR — Valuation Multiples
| Metric | Value |
|---|---|
| Current Share Price (USD) | 115.9 |
| Market Cap (USD Mil) | 15,066 |
| Enterprise Value (USD Mil) | 115,059 |
| Trailing P/E | 3 |
| Forward P/E | 2.8 |
| Price/Sales (TTM) | 0.3 |
| Price/Book (mrq) | 0.8 |
| EV/Revenue | 2.1 |
| EV/EBITDA | 5.3 |
| Beta (5Y Monthly) | 0.69 |
| FCF Yield % (TTM) | 14.6% |
| Forward EPS (USD) | 41.9 |
| Analyst Target Price – Low (USD) | 101 |
| Analyst Target Price – Mean (USD) | 179.1 |
| Analyst Target Price – High (USD) | 380 |
| # Analyst Opinions | 19 |
Source: Yahoo Finance
Charter screens as cheap on cash flow, not just on earnings optics. EV/EBITDA is 5.3x, FCF yield is 14.6%, and trailing P/E is 3.0x, so the market is already discounting a mature business with limited growth. I think that discount is justified by the leverage profile, but it also means the stock does not need much operational improvement to look better.
On my read, fair value sits in a broad range of about $110–$180 per share. That range is below the $179.1 analyst mean but still inside the $101–$380 analyst band, which tells me my view is not a lone outlier; I am simply weighting leverage and subscriber erosion more heavily than the consensus appears to. The implied EPS picture is also supportive of the stock’s low multiple: forward EPS is $41.9, and that is rich relative to peers on a per-share earnings basis because Charter is producing those earnings with a much heavier debt load than the group.
I would keep the valuation anchored to cash flow rather than revenue. The company’s 14.6% FCF yield and sub-3.0x earnings multiple are attractive, but they only matter if the balance sheet stops absorbing so much of the operating cash.
Leverage
CHTR — Leverage & Coverage (Quarterly)
| Metric | Value |
|---|---|
| Total Debt/Equity % (mrq) | 441.6 |
| Current Ratio (mrq) | 0.4 |
| Total Debt (mrq, USD Mil) | 96,710 |
| Operating Cash Flow (TTM, USD Mil) | 16,470 |
| Levered Free Cash Flow (TTM, USD Mil) | 2,198.4 |
| Net Debt/EBITDA (TTM) | 4.4 |
| FCF Margin % (TTM) | 4.0% |
Source: Yahoo Finance — Quarterly Financial Statements
This is the part of the model that keeps me from upgrading the stock. Total debt is $96.7B, debt to equity is 441.6%, current ratio is 0.4, and net debt to EBITDA is 4.4x, so the balance sheet is highly levered and short-term liquidity is tight. Charter still generated $16.5B of operating cash flow and $2.2B of levered free cash flow over the last twelve months, but the gap between those figures shows how much capital spending is required just to keep the network competitive.
That combination is why I do not treat the 14.6% FCF yield as a clean safety signal. The cash is real, but it is being produced inside a capital structure that leaves little room for a prolonged miss.
Insider Activity
The insider tape is net selling. Open-market sales totaled $13.4M versus $3.8M of purchases in the sample period, and the selling was concentrated in Thomas Rutledge, while buying was spread across several insiders, including the CEO and multiple directors. I read that as mixed alignment rather than a clean negative, but the heavier selling still leans bearish.
Comparable Analysis
Growth
| Company | Revenue TTM (USD Mil) | Revenue Growth YoY % | EBITDA TTM (USD Mil) | Diluted EPS TTM |
|---|---|---|---|---|
| CHTR | 54,396 | -1.7% | 21,815 | 38.4 |
| T | 127,239 | 2.3% | 44,939 | 3 |
| TMUS | 92,189 | 7.9% | 34,371 | 9.6 |
| VZ | 138,895 | -0.7% | 51,082 | 3.8 |
| CMCSA | 124,904 | -1.2% | 34,073 | 3.1 |
| LUMN | 11,832 | -9.3% | 2,235 | -1 |
Source: Yahoo Finance
Charter’s revenue fell 1.7% over the latest twelve months, while T grew 2.3%, TMUS grew 7.9%, VZ fell only 0.7%, and CMCSA fell 1.2%. That makes Charter the weakest top-line name in the group, even though its EBITDA base remains large at $21.8B.
Valuation
| Company | Current Share Price (USD) | Trailing P/E | Forward P/E | EV/Revenue | EV/EBITDA | Price/Sales (TTM) | Price/Book (mrq) | Market Cap (USD Mil) | Enterprise Value (USD Mil) | Beta (5Y Monthly) | FCF Yield % (TTM) | Forward EPS | Analyst Target Price – Low | Analyst Target Price – Mean | Analyst Target Price – High | # Analyst Opinions |
|---|---|---|---|---|---|---|---|---|---|---|---|---|---|---|---|---|
| CHTR | 115.9 | 3 | 2.8 | 2.1 | 5.3 | 0.3 | 0.8 | 15,066 | 115,059 | 0.69 | 14.6% | 41.9 | 101 | 179.1 | 380 | 19 |
| T | 25.7 | 8.5 | 10 | 2.7 | 7.6 | 1.4 | 1.6 | 176,004 | 339,546 | 0.43 | 5.8% | 2.6 | 20 | 29 | 36 | 24 |
| TMUS | 165.8 | 17.3 | 11.5 | 3.2 | 8.6 | 1.9 | 3.2 | 177,838 | 295,301 | 0.33 | 6.4% | 14.4 | 169 | 244.9 | 300 | 25 |
| VZ | 47.4 | 12.3 | 9 | 2.8 | 7.6 | 1.4 | 1.9 | 196,999 | 386,406 | 0.24 | 8.9% | 5.3 | 44 | 51.6 | 71 | 22 |
| CMCSA | 22.2 | 7.1 | 6.2 | 1.3 | 4.8 | 0.6 | 0.9 | 78,709 | 162,934 | 0.66 | 16.1% | 3.6 | 21 | 29.8 | 44 | 22 |
| LUMN | 6 | — | -20.2 | 1.5 | 8 | 0.5 | -4.1 | 6,178 | 17,942 | 1.80 | 34.2% | -0.3 | 5.9 | 7.6 | 9 | 10 |
Source: Yahoo Finance
On valuation, Charter is cheap on cash flow and earnings, but the market is clearly pricing in the leverage risk. Its 5.3x EV/EBITDA and 14.6% FCF yield compare favorably with T at 7.6x and 5.8%, TMUS at 8.6x and 6.4%, and VZ at 7.6x and 8.9%; CMCSA is cheaper on EV/EBITDA at 4.8x, but its growth and scale profile are different. The stock’s one-year total return of -56.3% also stands out: a $1 investment would now be worth $0.43, far worse than T at $0.92, TMUS at $0.73, VZ at $1.15, and CMCSA at $0.88.
Profitability
| Company | Operating Margin (TTM) | Net Margin (TTM) | Return on Assets (TTM) | Return on Equity (TTM) | Gross Margin (TTM) | EBITDA Margin (TTM) |
|---|---|---|---|---|---|---|
| CHTR | 23.5% | 9.1% | 5.3% | 27.2% | 55.2% | 40.1% |
| T | 24.8% | 16.9% | 4.2% | 18.3% | 59.7% | 35.3% |
| TMUS | 25.2% | 11.5% | 6.0% | 18.0% | 63.0% | 37.3% |
| VZ | 23.0% | 11.6% | 5.0% | 15.8% | 59.5% | 36.8% |
| CMCSA | 17.2% | 9.0% | 4.3% | 11.5% | 69.4% | 27.3% |
| LUMN | -2.9% | -8.7% | -0.9% | — | 47.8% | 18.9% |
Source: Yahoo Finance
Charter’s 40.1% EBITDA margin is competitive with TMUS at 37.3% and VZ at 36.8%, and it is well ahead of CMCSA at 27.3%. Its 23.5% operating margin is slightly below T at 24.8% and TMUS at 25.2%, which tells me the company still has solid operating discipline even if revenue is not growing.
Leverage
| Company | Total Debt/Equity % (mrq) | Current Ratio (mrq) | Total Debt (mrq, USD Mil) | Operating Cash Flow TTM (USD Mil) | Free Cash Flow TTM (USD Mil) | Net Debt/EBITDA (TTM) | FCF Margin % (TTM) |
|---|---|---|---|---|---|---|---|
| CHTR | 441.6 | 0.4 | 96,710 | 16,470 | 2,198.4 | 4.4 | 4.0% |
| T | 129.1 | 1 | 165,756 | 39,899 | 10,142 | 3.3 | 8.0% |
| TMUS | 214 | 0.9 | 120,427 | 28,833 | 11,336 | 3.4 | 12.3% |
| VZ | 184.1 | 0.6 | 193,646 | 38,799 | 17,466.6 | 3.8 | 12.6% |
| CMCSA | 100.5 | 0.8 | 90,381 | 32,517 | 12,697.6 | 2.4 | 10.2% |
| LUMN | — | 1 | 13,495 | 5,367 | 2,116.2 | 5.2 | 17.9% |
Source: Yahoo Finance
This is where Charter looks most stretched versus peers. Debt to equity is 441.6%, well above T at 129.1%, TMUS at 214.0%, VZ at 184.1%, and CMCSA at 100.5%, while net debt to EBITDA is 4.4x versus 3.3x, 3.4x, 3.8x, and 2.4x, respectively. Charter’s 4.0% FCF margin is also below every major peer in the set, which means the company is carrying more debt with less cash cushion than the group.
Conclusion
I would put my rating as a sell because the core tension is simple: Charter still throws off real cash, but the leverage burden and subscriber erosion are not yet improving fast enough to make that cash feel durable. The company’s 14.6% FCF yield and 5.3x EV/EBITDA multiple are attractive, but they are already compensating investors for a business that still lost 393,000 Internet customers in 2025 and posted a 1.1% revenue decline in Q2 2026.
I would raise my rating toward a hold if revenue turns flat for two straight quarters and net debt/EBITDA moves below 4.0x, because that would show the company is finally using cash flow to repair the balance sheet rather than just service it. If EBITDA margin stays near 40.0% while revenue improves by 1.0% on the current $54.4B annual base, that would add roughly $544M of revenue and about $218M of EBITDA at the current margin rate, which would make the deleveraging path easier to underwrite.
The bear case is the opposite: if revenue keeps shrinking by 1.0% to 2.0% a year while net debt stays above 4.5x EBITDA, then the equity is likely to remain trapped in a low-multiple range because cash flow is being used to defend the business rather than compound it. That risk is already visible in the numbers, so I want to see revenue stabilization first and balance-sheet progress second.
What to Watch Next
- Revenue flat for two straight quarters — would support moving the rating toward hold.
- Net debt/EBITDA below 4.0x — would show the balance sheet is easing.
- EBITDA margin near 40.0% — would confirm cash generation is holding up.
- Internet customer losses slowing materially — would signal the core base is stabilizing.
- FCF staying above $2B annually — would keep deleveraging and buybacks viable.
What’s your take? I rated Charter Communications (CHTR) SELL above — but the goal here is to get this right, not just to publish an opinion. What would you add to this analysis, or which risk or catalyst do you think I’m under- or over-weighting? Tell me in the comments.
Sources
- SEC 10-K Annual Report — filed 2026-01-30
- SEC 8-K Filing (2026-05-19)
- SEC 8-K Filing (2026-04-24)
- SEC 8-K Filing (2026-04-23)
- SEC 8-K Filing (2026-02-25)
- SEC 8-K Filing (2026-01-30)
- SEC 8-K Filing (2026-01-28)
- SEC Form 4 Insider Transaction (2026-05-28)
- SEC Form 4 Insider Transaction (2026-05-19)
- SEC Form 4 Insider Transaction (2026-05-18)
- SEC 10-K Annual Report — FY2026
- SEC 10-K Annual Report — FY2025
- SEC 10-K Annual Report — FY2024
- SEC 10-K Annual Report — FY2023
- SEC 10-K Annual Report — FY2022
Data sourced from Yahoo Finance and SEC EDGAR. Not investment advice.
Leave a Comment