
| Company | Oct 25 | Nov 25 | Dec 25 | Jan 26 | Feb 26 | Mar 26 | Apr 26 | May 26 | Jun 26 | Jul 26 | Aug 26 | Sep 26 | 12-Mo |
|---|---|---|---|---|---|---|---|---|---|---|---|---|---|
| LUMN | +68% | -21% | -4% | +14% | -19% | -2% | +27% | +24% | -30% | -17% | -2% | -10% | -8% |
| T | -11% | +5% | -5% | +7% | +7% | +3% | -9% | -5% | -17% | +14% | +11% | -6% | -10% |
| TMUS | -12% | -0% | -3% | -3% | +11% | -3% | -7% | -4% | -11% | +3% | +5% | -10% | -30% |
| VZ | -8% | +3% | -1% | +11% | +13% | +0% | -3% | -0% | -11% | +12% | +7% | -8% | +11% |
| CHTR | -15% | -14% | +4% | -1% | +14% | -8% | -23% | -13% | -1% | +2% | +5% | -27% | -60% |
Source: Yahoo Finance monthly adjusted close.
Quick Thesis
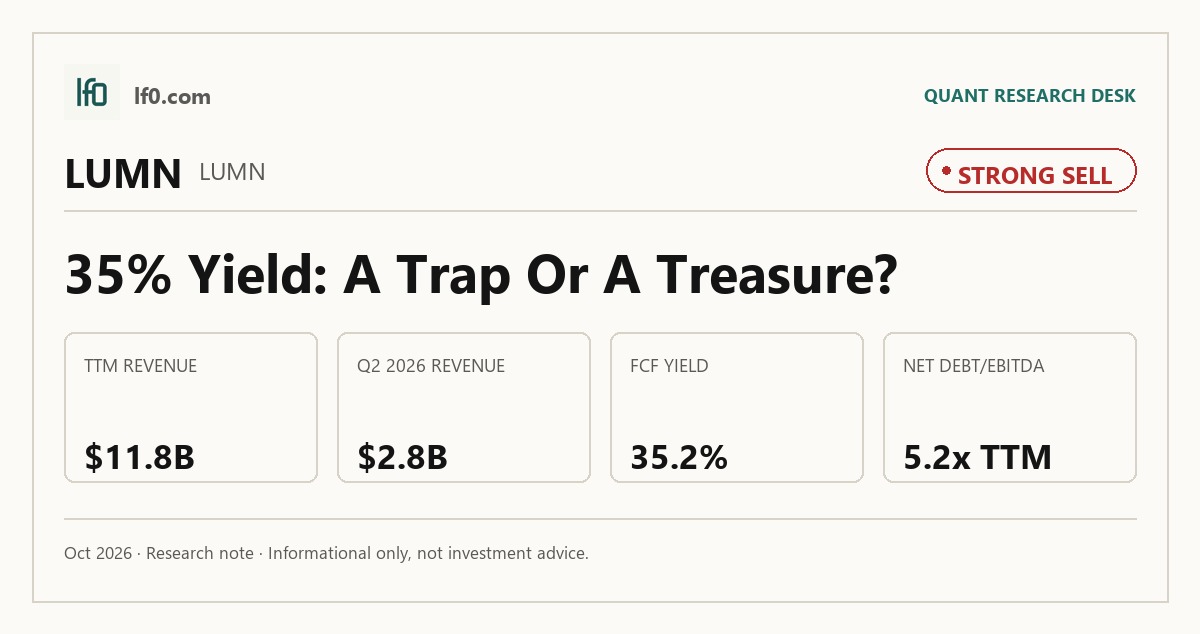
- Rated strong sell — leverage and shrinking revenue outweigh the cash-flow yield.
- Strongest support: 35.2% FCF yield and $2.1B of levered free cash flow.
- Biggest risk: $13.5B of debt and 5.2x net debt/EBITDA.
- Valuation looks cheap on 1.5x EV/revenue, but the discount reflects falling sales and weak earnings.
- I would only turn more constructive if operating margin turns positive and quarterly revenue stabilizes above $2.8B.
Executive Summary
Rating: STRONG SELL | LUMN
We’ll begin tracking this call’s performance since publication once sufficient adjusted-close data is available.
I would put my rating as a strong sell because Lumen’s balance-sheet repair has not yet stopped the core revenue base from shrinking, and the equity still depends on execution rather than on a visible earnings inflection. The company has improved liquidity through the $5.75B fiber sale and subsequent debt paydown, but Q2 2026 revenue was still only $2.8B and net debt/EBITDA remained 5.2x, which leaves little room for error. In my view, the market is already giving credit for the restructuring, so I would need to see quarterly revenue hold above $2.8B and operating margin move into positive territory before I would move off this call.
Company Profile
Lumen Technologies is a digital networking services company that sells enterprise and wholesale connectivity, cloud access, cybersecurity, voice, Ethernet, and private line services, alongside legacy mass-market broadband and voice. Revenue comes from recurring network services and managed solutions delivered over its fiber and copper infrastructure, with the Business segment serving enterprise, wholesale, public sector, and international customers and the Mass Markets segment serving domestic residential and small business users. The company was incorporated in Louisiana in 1968 and grew through the Embarq, Qwest, and Level 3 acquisitions before selling Latin America, part of its incumbent local exchange carrier business, Europe, the Middle East and Africa, and then its Mass Markets Fiber-to-the-Home business to AT&T for $5.75B of gross cash proceeds. As of December 31, 2025, it operated about 163,000 fiber on-net buildings and more than 340,000 route miles of fiber across 226 metropolitan markets, with roughly 24,000 employees globally.
Economic Moat
Business Model
The clearest structural advantage is the fiber network itself. As of December 31, 2025, Lumen controlled about 163,000 fiber on-net buildings and more than 340,000 route miles of fiber optic cable globally, and I feel that a rival would struggle to rebuild that footprint within 3 years. That network supports enterprise and wholesale customers that buy low-latency connectivity, dark fiber, edge cloud services, managed security services, and software-defined wide area networks, so the edge is not just scale but the ability to bundle transport, security, and cloud access into one platform. PCF network architecture, the digital self-service ordering platform, and Black Lotus Labs, the cyberthreat research arm, add stickiness by making the offer faster to buy and harder to displace.
Business & Operating Risks
According to the risk factors in Lumen’s SEC 10-K, the most important disclosed risk is the debt stack: the company carries significant leverage, faces restrictive covenants and potential defaults, and says a failure to comply could accelerate substantial indebtedness and potentially force bankruptcy protection. The filing also highlights prolonged declines in legacy voice, long-distance voice, network access, and private line revenue, while newer offerings generate lower margins and may displace higher-margin legacy services. That combination does not directly threaten the fiber moat itself, but it does threaten the cash generation needed to defend and monetize it, which is the real pressure point.
Management Discussion & Analysis
Management is clearly responding to the leverage and legacy-revenue risks through asset sales and debt reduction, but the operating turnaround is still incomplete. The $5.75B fiber-to-the-home divestiture closed on February 2, 2026, and management used $4.8B of proceeds to redeem notes and repay superpriority loans, which is a real liquidity improvement rather than a cosmetic one. At the same time, the sale reduces recurring revenue and capital intensity, so the company is shrinking into a cleaner balance sheet rather than growing into one. The 2025 revenue decline to $12.4B and the $628M goodwill impairment show that the transformation is still colliding with economic drag, even as management keeps spending on network modernization.
Recent Events
The most important recent event is the May 20, 2026 financing cleanup, when Lumen issued $1B of 7.500% senior notes due 2037 and used part of the proceeds to retire unsecured debt through concurrent tender offers. That pushes maturities out and lowers near-term refinancing pressure, which supports the balance-sheet repair thesis. The same filing also showed early tender results covering up to $750M of notes across Level 3, Lumen, and QCF, so management is actively simplifying the capital structure after the fiber sale. Governance changes were more mixed: investors approved the amended 2024 equity incentive plan and some charter changes, but not the proposal to remove liability and indemnification supermajority protections.
Financial Analysis
Growth
LUMN — Financial Growth (Quarterly, USD Mil)
| Metric | 2025-03-31 | 2025-06-30 | 2025-09-30 | 2025-12-31 | 2026-03-31 | 2026-06-30 |
|---|---|---|---|---|---|---|
| REVENUE (USD Mil) | — | 3,092 | 3,087 | 3,041 | 2,899 | 2,805 |
| EBIT (USD Mil) | — | -811 | -494 | -229 | 402 | -54 |
| EBITDA (USD Mil) | — | -123 | 180 | 445 | 1,066 | 614 |
| NET INCOME (USD Mil) | — | -915 | -621 | -2 | -200 | -201 |
| DILUTED EPS | -0.2 | -0.9 | -0.6 | 0 | -0.2 | — |
Source: Yahoo Finance — Quarterly Financial Statements
Revenue stepped down across the last four reported quarters, from $3.1B in Q2 2025 to $2.8B in Q2 2026, which tells me the post-divestiture base is still contracting. EBITDA was more volatile: it improved to $1.1B in Q1 2026 from -$123M a year earlier, then eased to $614M in Q2 2026, so the earnings lift is real but not yet stable. That matters because the company needs both revenue stabilization and margin repair for the fiber sale to translate into equity value rather than just a smaller business.
Profitability
LUMN — Profitability (TTM)
| Metric | TTM |
|---|---|
| Operating Margin (TTM) | -2.9% |
| Net Margin (TTM) | -8.7% |
| Return on Assets (TTM) | -0.9% |
| Gross Margin (TTM) | 47.8% |
| EBITDA Margin (TTM) | 18.9% |
Source: Yahoo Finance — Trailing Twelve Months (TTM)
TTM gross margin was 47.8%, while EBITDA margin was 18.9%, which shows the network still covers direct costs well. The problem is what happens below that line: operating margin was -2.9%, net margin was -8.7%, and return on assets was -0.9%, so the business is still not earning a GAAP profit. I view that gap as the key reason the cash-flow story has not yet become an earnings story, and it is why EBITDA progress matters more than headline revenue alone.
Valuation
LUMN — Valuation Multiples
| Metric | Value |
|---|---|
| Current Share Price (USD) | 5.8 |
| Market Cap (USD Mil) | 6,017 |
| Enterprise Value (USD Mil) | 17,715 |
| Forward P/E | -19.7 |
| Price/Sales (TTM) | 0.5 |
| EV/Revenue | 1.5 |
| EV/EBITDA | 7.9 |
| Beta (5Y Monthly) | 1.86 |
| FCF Yield % (TTM) | 35.2% |
| Forward EPS (USD) | -0.3 |
| Analyst Target Price – Low (USD) | 5.9 |
| Analyst Target Price – Mean (USD) | 7.6 |
| Analyst Target Price – High (USD) | 9 |
| # Analyst Opinions | 10 |
Source: Yahoo Finance
Lumen trades at $5.84 per share, or 1.5x EV/revenue and 7.9x EV/EBITDA, with a 35.2% FCF yield and a 0.5x price/sales ratio. Those multiples make the stock look inexpensive on cash flow, but the discount is doing a lot of work because forward P/E is -19.7x, forward EPS is -$0.3, and book value per share is -$1.44. On the analysis here, I would put fair value in a broad $6-$8 range, which sits inside the $5.9–$9 analyst target range from 10 opinions; that tells me the sell-side is constructive, but not dramatically more so than I am. I would also frame forward EPS as roughly negative $0.3 to flat over the next year, which is still weaker than the positive forward EPS profile of the peer group and keeps Lumen’s valuation tied to cash generation rather than earnings power. The rating justification is consistent with that view: the stock is cheap on cash flow, but the leverage and earnings risk are still too high to treat the discount as a clean opportunity.
Leverage
LUMN — Leverage & Coverage (Quarterly)
| Metric | Value |
|---|---|
| Current Ratio (mrq) | 1 |
| Operating Cash Flow (TTM, USD Mil) | 5,367 |
| Levered Free Cash Flow (TTM, USD Mil) | 2,116.2 |
| Net Debt/EBITDA (TTM) | 5.2 |
| FCF Margin % (TTM) | 17.9% |
Source: Yahoo Finance — Quarterly Financial Statements
Total debt was $13.5B, current ratio was 1.0, operating cash flow was $5.4B, and levered free cash flow was $2.1B, so the company is still producing cash even with a heavy capital structure. Net debt/EBITDA was 5.2x and FCF margin was 17.9%, which means the business has enough cash generation to keep repairing the balance sheet, but not enough to make leverage comfortable. I do not see a near-term liquidity crisis, yet the margin for error is thin if revenue weakens again or refinancing costs rise.
Insider Activity
The insider record is limited but mildly supportive. CEO Kathleen E. Johnson bought 78,685 shares on 2026-02-05 for $6.35, while Director Linear Diankha sold 45,000 shares on 2026-02-20 for $7.89, so the open-market activity is slightly net buying on dollar value. I read that as a neutral-to-slightly positive signal, but not enough breadth to call it a strong alignment signal.
Comparable Analysis
LF0 has published standalone analyses of these peers: T-Mobile US (TMUS) (rated Hold); Verizon (VZ) Stock: 2026 Valuation, 5Y Beta & Dividend Thesis (VZ) (rated Hold); Charter Communications (CHTR) (rated Sell).
Growth
| Company | Revenue TTM (USD Mil) | Revenue Growth YoY % | Diluted EPS TTM |
|---|---|---|---|
| LUMN | 11,832 | -9.3% | -1 |
| T | 127,239 | 2.3% | 3 |
| TMUS | 92,189 | 7.9% | 9.6 |
| VZ | 138,895 | -0.7% | 3.8 |
| CHTR | 54,396 | -1.7% | 38.4 |
Source: Yahoo Finance
Lumen’s revenue fell 9.3% TTM to $11.8B, while T grew 2.3%, TMUS grew 7.9%, VZ fell 0.7%, and CHTR fell 1.7%. EBITDA of $2.2B is still positive, but the revenue trend is the weakest in the group, so the discount is justified by shrinking scale rather than by a temporary dip.
Valuation
| Company | Current Share Price (USD) | Trailing P/E | Forward P/E | EV/Revenue | EV/EBITDA | Price/Sales (TTM) | Price/Book (mrq) | Market Cap (USD Mil) | Enterprise Value (USD Mil) | Beta (5Y Monthly) | FCF Yield % (TTM) | Forward EPS | Analyst Target Price – Low | Analyst Target Price – Mean | Analyst Target Price – High | # Analyst Opinions |
|---|---|---|---|---|---|---|---|---|---|---|---|---|---|---|---|---|
| LUMN | 5.8 | — | -19.7 | 1.5 | 7.9 | 0.5 | -4 | 6,017 | 17,715 | 1.86 | 35.2% | -0.3 | 5.9 | 7.6 | 9 | 10 |
| T | 24.6 | 8.1 | 9.6 | 2.6 | 7.4 | 1.3 | 1.5 | 168,774 | 333,859 | 0.44 | 6.0% | 2.6 | 20 | 28.8 | 36 | 24 |
| TMUS | 168.9 | 17.7 | 11.7 | 3.2 | 8.7 | 2 | 3.2 | 181,228 | 297,435 | 0.32 | 6.3% | 14.4 | 169 | 241.2 | 296 | 25 |
| VZ | 46 | 12 | 8.7 | 2.8 | 7.5 | 1.4 | 1.8 | 191,126 | 383,290 | 0.25 | 9.1% | 5.3 | 44 | 51.1 | 62 | 23 |
| CHTR | 107.3 | 2.8 | 2.5 | 2.1 | 5.2 | 0.3 | 0.8 | 13,941 | 113,908 | 0.69 | 15.8% | 43.3 | 68 | 175.1 | 380 | 19 |
Source: Yahoo Finance
Lumen trades at 1.5x EV/revenue and 7.9x EV/EBITDA, versus T at 2.6x and 7.4x, TMUS at 3.2x and 8.7x, VZ at 2.8x and 7.5x, and CHTR at 2.1x and 5.2x. On a peer-multiple basis, that leaves Lumen cheap on revenue, but the discount is tied to weaker growth, negative forward EPS, and a more levered balance sheet. The stock’s 35.2% FCF yield also stands out against T at 6.0%, TMUS at 6.3%, VZ at 9.1%, and CHTR at 15.8%, which is why the market is paying for cash today rather than for durable earnings power. A $1 investment a year ago would be worth $0.86 in Lumen, versus $0.98 in T, $0.75 in TMUS, $1.18 in VZ, and $0.39 in CHTR, so the tape has been mixed rather than decisively rewarding the restructuring.
Profitability
| Company | Operating Margin (TTM) | Net Margin (TTM) | Return on Assets (TTM) | Return on Equity (TTM) | Gross Margin (TTM) | EBITDA Margin (TTM) |
|---|---|---|---|---|---|---|
| LUMN | -2.9% | -8.7% | -0.9% | — | 47.8% | 18.9% |
| T | 24.8% | 16.9% | 4.2% | 18.3% | 59.7% | 35.3% |
| TMUS | 25.2% | 11.5% | 6.0% | 18.0% | 63.0% | 37.3% |
| VZ | 23.0% | 11.6% | 5.0% | 15.8% | 59.5% | 36.8% |
| CHTR | 23.5% | 9.1% | 5.3% | 27.2% | 55.2% | 40.1% |
Source: Yahoo Finance
Lumen’s gross margin of 47.8%, EBITDA margin of 18.9%, operating margin of -2.9%, and net margin of -8.7% all trail T, TMUS, VZ, and CHTR. The gap is widest at the operating line, which tells me the issue is not just cost of revenue but also overhead and scale. That is why the peer discount is not just a valuation gap; it is a profitability gap that still needs to close.
Leverage
| Company | Current Ratio (mrq) | Operating Cash Flow TTM (USD Mil) | Free Cash Flow TTM (USD Mil) | Net Debt/EBITDA (TTM) | FCF Margin % (TTM) |
|---|---|---|---|---|---|
| LUMN | 1 | 5,367 | 2,116.2 | 5.2 | 17.9% |
| T | 1 | 39,899 | 10,142 | 3.3 | 8.0% |
| TMUS | 0.9 | 28,833 | 11,336 | 3.4 | 12.3% |
| VZ | 0.6 | 38,799 | 17,466.6 | 3.8 | 12.6% |
| CHTR | 0.4 | 16,470 | 2,198.4 | 4.4 | 4.0% |
Source: Yahoo Finance
Lumen’s net debt/EBITDA is 5.2x, above T at 3.3x, TMUS at 3.4x, VZ at 3.8x, and CHTR at 4.4x, while its current ratio of 1.0 is only modestly better than the group’s weaker names. The nuance is that Lumen’s 17.9% FCF margin is better than T’s 8.0% and TMUS’s 12.3%, so the company is still generating cash, but that cash is more likely to go toward balance-sheet repair than toward equity upside. In other words, the leverage profile explains part of the valuation discount, and the cash-flow profile explains why the stock is not trading like a distressed equity.
Conclusion
The key tension is that Lumen is now generating enough cash to keep repairing the balance sheet, but not enough operating momentum to prove that the remaining network can grow into the debt load. That is why I would keep the rating at strong sell: the 35.2% FCF yield and the $5.75B asset sale are real positives, yet Q2 2026 revenue was still only $2.8B and net debt/EBITDA remained 5.2x, so the equity still depends on a turnaround that has not shown up in the numbers.
I would raise my rating toward buy if quarterly revenue holds above $2.8B and operating margin turns positive, because that would show the post-divestiture business is stabilizing and finally converting cash generation into earnings power. I would also want net debt/EBITDA below 4.5x, meaning leverage is falling enough to give the equity real optionality rather than just survival value. On the downside, I would move to a sell if quarterly revenue slips below $2.7B or if net debt/EBITDA stays above 5.5x while FCF starts to compress, because that would tell me the balance-sheet repair window is closing instead of opening.
My final view is that the debt cleanup can show up first, but operating momentum still has to prove itself. Until revenue stops eroding and margins begin to rebuild, I think the cash flow is better viewed as support for the capital structure than as a reason to own the equity.
What to Watch Next
- Quarterly revenue above $2.8B — would support a more constructive view.
- Operating margin turning positive — would show earnings repair is finally taking hold.
- Net debt/EBITDA below 4.5x — would signal meaningful deleveraging.
- Quarterly revenue below $2.7B — would argue the remaining business is still shrinking.
- Net debt/EBITDA above 5.5x with weaker FCF — would raise refinancing risk.
What’s your take? I rated Lumen Technologies (LUMN) STRONG SELL above — but the goal here is to get this right, not just to publish an opinion. What would you add to this analysis, or which risk or catalyst do you think I’m under- or over-weighting? Tell me in the comments.
Sources
- SEC 10-K Annual Report — filed 2026-02-20
- SEC 8-K Filing (2026-05-27)
- SEC 8-K Filing (2026-05-21)
- SEC 8-K Filing (2026-05-20)
- SEC 8-K Filing (2026-05-20)
- SEC 8-K Filing (2026-05-20)
- SEC 8-K Filing (2026-05-14)
- SEC Form 4 Insider Transaction (2026-05-26)
- SEC Form 4 Insider Transaction (2026-05-26)
- SEC Form 4 Insider Transaction (2026-05-26)
- SEC 10-K Annual Report — FY2026
- SEC 10-K Annual Report — FY2025
- SEC 10-K Annual Report — FY2024
- SEC 10-K Annual Report — FY2023
- SEC 10-K Annual Report — FY2022
Data sourced from Yahoo Finance and SEC EDGAR. Not investment advice.
Leave a Comment