
| Company | Sep 25 | Oct 25 | Nov 25 | Dec 25 | Jan 26 | Feb 26 | Mar 26 | Apr 26 | May 26 | Jun 26 | Jul 26 | Aug 26 | 12-Mo |
|---|---|---|---|---|---|---|---|---|---|---|---|---|---|
| NLCP | -2% | -2% | -1% | +28% | -5% | +1% | -3% | +0% | +9% | +3% | -2% | -1% | +25% |
| IIPR | -2% | -6% | -1% | -0% | +2% | +10% | -2% | +8% | +7% | +10% | -5% | -3% | +16% |
| PW | -12% | -24% | +10% | +4% | +6% | -4% | -4% | -9% | +1% | +23% | -15% | -10% | -35% |
| AFCG | -15% | -15% | -10% | -2% | -19% | -1% | +26% | +1% | +31% | -16% | -13% | +34% | -17% |
| REFI | -7% | +1% | -1% | -0% | +1% | -2% | -3% | +5% | -5% | -2% | -9% | +11% | -10% |
| CTRE | +2% | -0% | +8% | -3% | +3% | +9% | -9% | +8% | +3% | -0% | +4% | -7% | +18% |
Source: Yahoo Finance monthly adjusted close.
Quick Thesis
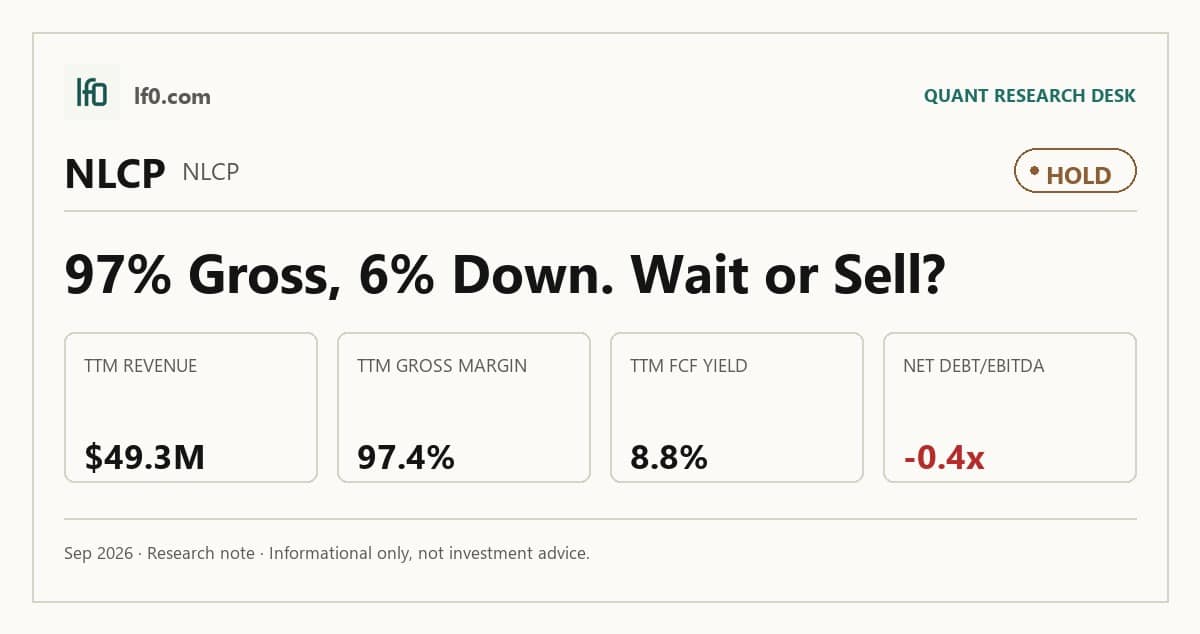
- Rated Hold because cash flow is strong, but revenue is still shrinking.
- TTM FCF margin is 56.0%, which supports liquidity and distributions.
- Revenue fell 6.5% TTM to 49.3M, the key operating risk.
- Shares trade at 7.3x EV/EBITDA and 6.0x EV/Revenue, which looks fair.
- I would turn more constructive if revenue stops declining for two straight quarters.
Performance Since Our Last Call
I last covered NewLake Capital Partners as a Hold on 2026-09-22. The prior call is still directionally intact: the stock has held up, but the fresh numbers still show a business that is cash-generative without yet proving durable top-line growth. Revenue is still down 6.5% TTM, so the core operating issue has not been fixed, even though the balance sheet remains a support. That leaves this article’s updated Hold view broadly consistent with the prior call.
Executive Summary
Rating: HOLD | NLCP
We’ll begin tracking this call’s performance since publication once sufficient adjusted-close data is available.
I would put my rating as a Hold because NewLake Capital Partners combines an 8.8% free cash flow yield with net cash and a 3.5x current ratio, but the business is still shrinking, with revenue down 6.5% TTM to 49.3M and forward EPS at 1.2. The balance sheet and cash conversion support the stock, yet the top line does not. I would raise my rating more towards a Buy if revenue returns to growth for two straight quarters and FCF margin stays above 50%, meaning cash generation remains strong while the base stops eroding.
Company Profile
NewLake Capital Partners is an internally managed REIT that provides long-term, single-tenant, triple-net sale-leaseback and build-to-suit capital to state-licensed cannabis operators, mainly through dispensary and cultivation properties. As of December 31, 2025, it owned 34 properties across 12 states, with 19 dispensaries and 15 cultivation facilities, and 31 of those properties were leased to 11 tenants. The portfolio generated $49.5M of rental income in FY2025, and leases carried a weighted average remaining term of 12.1 years. The company conducts business through NLCP Operating Partnership LP, its operating partnership, and is listed on the OTCQX Best Market under NLCP.
Economic Moat
Business Model
The long-term, triple-net lease structure is the core advantage here because it pushes real estate operating costs to the tenant while NewLake collects rent on cannabis facilities that are tied to state licenses and hard to relocate. In my view, that is difficult for a well-funded competitor to replicate within three years because the asset pool is constrained by licensing, zoning, and the need for properties already embedded in the operator’s permit footprint. Parent or affiliate guarantees on the leases, a weighted average remaining lease term of 12.1 years, and a portfolio concentrated in limited-license jurisdictions reinforce that edge. I also note the company’s cash-basis rent recognition for uncertain collectability, which tells me underwriting is conservative rather than aggressive.
Business & Operating Risks
The most material risk is tenant concentration and tenant credit stress. As of December 31, 2025, NewLake Capital Partners owned 34 properties leased to 11 tenants, and Curaleaf alone represented 25.8% of annualized rental revenue while Cresco Labs, Trulieve, and The Cannabist Company represented 14.8%, 12.4%, and 9.2%, respectively. That concentration already showed up in the numbers: during 2025, two tenants defaulted and vacated, and three properties became vacant, which means the risk is not hypothetical and is already pressuring cash rent collection and re-leasing costs. The Cannabist Company is the clearest stress point because it leases four properties and represented 9.0% of 2025 rental revenue; the filing also says it has withheld interest payments, entered forbearance agreements, and sold assets to meet maturing debt, so a further tenant failure would likely hit distributions and asset values directly.
Licensing and regulatory dependence is the second major risk. The filing says 31 of 34 properties were leased in limited-license jurisdictions, and if tenants fail to renew or maintain cannabis licenses, they may be unable to operate and could default on rent. That risk is already materializing in the operating data because three properties became vacant in 2025 after tenant defaults, which is consistent with the filing’s warning that state and local authorizations are a prerequisite to rent collection. The current 10-K also adds more explicit federal and state enforcement language than older filings, including the Supreme Court’s December 2025 refusal to review Canna Provisions v. Bondi and the note that DOJ withdrew prior marijuana enforcement guidance in late 2025, which makes the legal backdrop less predictable than it was a few years ago.
Capital access and financing risk is another clear headwind. According to their SEC filings, the company had $7.6M outstanding on its revolving credit facility as of December 31, 2025, and it relies on external capital because growth depends on new acquisitions. The filing also says many clearing firms are prohibited or very limited in settling cannabis securities, so access to capital may be constrained and best efforts offerings may raise less than expected. That matters because the company is a REIT with distribution obligations, so any tighter capital market could force slower growth or less room to support distributions.
The disclosed risks do not break the moat itself, but they do pressure the tenant-credit and licensing assumptions that make the triple-net model work.
Management Discussion & Analysis
Management is signaling a capital-light, rent-first posture rather than an aggressive growth push: in 2025 it acquired three dispensaries for approximately $1.7M and funded approximately $0.7M of improvement allowances, while also committing to sell the Hartford, Connecticut property, which is already classified as held for sale and carries a book value of approximately $4.8M. That mix tells me management is recycling capital into small, selective additions while exiting an asset where it has make-whole protection, so investors should read this as disciplined portfolio management rather than a broad expansion program. The bigger signal is defensive underwriting, not expansion for its own sake: rental income is still being recorded on a cash basis because collectability for each tenant is uncertain, which means reported revenue depends on tenant health more than on contractual rent growth. The company also says the broader cannabis sector faces billions in loans maturing by 2026 and limited refinancing access, and that is consistent with the fact that AYR stopped paying rent on the Pottsville, Pennsylvania and Sparks, Nevada properties in August 2025 and Revolutionary Clinics vacated Fitchburg, Massachusetts in July 2025. Against that backdrop, the move to a variable-rate revolving credit facility at Prime plus 1.0% and a 7.75% rate as of December 31, 2025 raises financing cost without meaningfully reducing leverage, so I do not read the capital structure changes as a de-risking event.
Management is responding to the tenant-credit risk, but the unresolved rent collection issues still define the story.
The track record is mixed, with more evidence of caution than of overpromising. In 2024’s 10-K, management highlighted a 31-property portfolio across 12 states with 13 tenants, and in 2025 that grew to 32 properties and then to 34 properties by December 31, 2025, so the portfolio did expand, but only modestly and not in a way that offset tenant stress. Prior filings also pointed to disciplined underwriting and triple-net leases, yet 2025 still saw two tenant defaults, three properties vacated, and rental income from AYR’s two cultivation facilities decline by approximately $0.3M, which shows the underwriting did not prevent cash rent disruption. Management’s tone has stayed constructive across the last several filings, but the numbers have been more fragile than the language, especially with collectability now explicitly assessed quarterly on a tenant-by-tenant basis and rental income recorded on a cash basis.
Recent Events
The most material development I see is the Q1 2026 earnings release on May 7, 2026, followed by an updated investor presentation the same day. That matters because it shows management is still actively communicating the portfolio, but the filing itself does not disclose any new acquisition, financing, or asset-level change that would alter NewLake Capital Partners’ structural position.
The June 4, 2026 annual meeting was more of a governance checkpoint than a strategic event. Stockholders elected all seven directors and ratified CBIZ CPAs P.C. as auditor for FY2026, which signals continuity rather than a reset. In my view, that leaves the investment case materially unchanged because the 8-Ks show routine corporate maintenance, not a new catalyst or a new risk.
Financial Analysis
Growth
NLCP — Financial Growth (Quarterly, USD Mil)
| Metric | 2025-06-30 | 2025-09-30 | 2025-12-31 | 2026-03-31 | 2026-06-30 |
|---|---|---|---|---|---|
| REVENUE (USD Mil) | 12.9 | 12.6 | 12.3 | 12.3 | 12.1 |
| EBIT (USD Mil) | 7.7 | 7 | 6.4 | 6.1 | 6.2 |
| EBITDA (USD Mil) | 11.5 | 10.9 | 10.2 | 10 | 10.1 |
| NET INCOME (USD Mil) | 7.3 | 6.7 | 6 | 5.8 | 5.9 |
| DILUTED EPS | 0.3 | 0.3 | 0.3 | 0.3 | 0.3 |
Source: Yahoo Finance — Quarterly Financial Statements
Revenue slipped from 12.9M in Q2 2025 to 12.1M in Q2 2026, while EBITDA eased from 11.5M to 10.1M and net income from 7.3M to 5.9M. On a year-over-year basis, Q2 2026 revenue was down 6.4% from Q2 2025, and quarterly earnings growth was -19.6%, so profit is falling faster than sales. The sequence from Q2 2025 through Q2 2026 is a steady step-down rather than a rebound, and that is a bear signal because the business is shrinking while earnings are deteriorating faster than revenue.
Profitability
NLCP — Profitability (TTM)
| Metric | TTM |
|---|---|
| Operating Margin (TTM) | 50.8% |
| Net Margin (TTM) | 49.4% |
| Return on Assets (TTM) | 3.8% |
| Return on Equity (TTM) | 6.3% |
| Gross Margin (TTM) | 97.4% |
| EBITDA Margin (TTM) | 82.8% |
Source: Yahoo Finance — Trailing Twelve Months (TTM)
TTM gross margin was 97.4%, EBITDA margin was 82.8%, operating margin was 50.8%, and net margin was 49.4%. The spread between gross margin and operating margin is wide, which means the business keeps most of its revenue after property-level costs but still gives up 46.7 percentage points to overhead, interest, and other non-gross expenses. That pattern fits a REIT platform that is already profitable at the operating line, but still carries meaningful corporate and financing drag. TTM ROA was 3.8% and TTM ROE was 6.3%, so equity returns are modest and only moderately amplified versus asset returns, which suggests returns are being driven more by the underlying property cash flow than by aggressive leverage. The gap between EBITDA margin and net margin is small, so non-cash charges are not masking the earnings picture.
Valuation
NLCP — Valuation Multiples
| Metric | Value |
|---|---|
| Current Share Price (USD) | 15 |
| Market Cap (USD Mil) | 315 |
| Enterprise Value (USD Mil) | 298 |
| Trailing P/E | 12.7 |
| Forward P/E | 12.8 |
| Price/Sales (TTM) | 6.4 |
| Price/Book (mrq) | 0.8 |
| EV/Revenue | 6 |
| EV/EBITDA | 7.3 |
| Beta (5Y Monthly) | 0.83 |
| FCF Yield % (TTM) | 8.8% |
| Forward EPS (USD) | 1.2 |
| Analyst Target Price – Low (USD) | 17 |
| Analyst Target Price – Mean (USD) | 17.5 |
| Analyst Target Price – High (USD) | 18 |
| # Analyst Opinions | 2 |
Source: Yahoo Finance
At a current share price of 15.0, the stock trades at 6.0x EV/Revenue and 6.4x Price/Sales, which implies the market is paying about six times annual revenue for a REIT with a cannabis-tenant model that still needs stable rent collection and continued access to capital. The 7.3x EV/EBITDA multiple is the cleaner earnings anchor here, and it says investors are paying a mid-single-digit multiple for EBITDA that is already converting into cash, not a high-growth premium. FCF Yield is 8.8%, which is the most decision-relevant cheapness signal in this file because levered free cash flow was 27.6M over the last twelve months, or about 1.3 per share, versus a 15.0 share price. Trailing P/E is 12.7x and forward P/E is 12.8x, while Price/Book is 0.8x and book value per share is 18.6, so the stock trades below stated book even after a 6.3% 52-week gain. Beta is 0.83, and the 11.4% dividend yield with a 145.8% payout ratio shows the market is also pricing in a high distribution burden.
On my read, fair value sits in a $15-$18 range. That range is inside the $17-$18 analyst target band from two opinions, so the market is not far from consensus even though the stock still screens below book value. I would not call that a deep discount; rather, it looks like a cash-yield name where the valuation already reflects the revenue decline and the tenant-risk profile. On an earnings basis, a 1.2 forward EPS estimate against a 15.0 share price leaves the stock at roughly 12.8x forward earnings, which is reasonable for a net-cash REIT but not cheap enough to ignore the growth drag. Relative to peers, that EPS profile is richer than the raw dollar figure suggests because the company is producing it with a much smaller balance sheet and a lower leverage load.
Leverage
NLCP — Leverage & Coverage (Quarterly)
| Metric | Value |
|---|---|
| Total Debt/Equity % (mrq) | 2 |
| Current Ratio (mrq) | 3.5 |
| Total Debt (mrq, USD Mil) | 7.7 |
| Operating Cash Flow (TTM, USD Mil) | 41.7 |
| Levered Free Cash Flow (TTM, USD Mil) | 27.6 |
| Net Debt/EBITDA (TTM) | -0.4 |
| FCF Margin % (TTM) | 56.0% |
Source: Yahoo Finance — Quarterly Financial Statements
NewLake Capital Partners has 7.7M of total debt against a total debt/equity ratio of 2.0% and a current ratio of 3.5x, so the balance sheet is lightly levered and short-term liquidity is comfortable. Total cash is 25.8M, which gives extra near-term cushion beyond the current ratio. Operating cash flow was 41.7M and levered free cash flow was 27.6M, with FCF margin at 56.0%, so EBITDA is converting into cash efficiently rather than being absorbed by capex or working capital. Net debt/EBITDA was -0.4x, which means cash exceeds debt and refinancing risk is limited unless cash generation weakens materially or a large acquisition changes the capital structure. In my opinion, this is low refinancing risk because the company has net cash, strong FCF, and no obvious near-term balance-sheet pressure.
Insider Activity
The insider transaction record I see here is buying only, with 2 open-market purchases and no open-market sales in the 2024-12-31 to 2026-06-04 window. The activity is concentrated in one insider, President and CEO Anthony Coniglio, so the signal is supportive but narrow rather than broad-based. In my view, that is a bull signal because the only voluntary market-price trades are insider buys, but the limited sample means the alignment read is positive rather than decisive.
Comparable Analysis
Growth
| Company | Revenue TTM (USD Mil) | Revenue Growth YoY % | EBITDA TTM (USD Mil) |
|---|---|---|---|
| NLCP | 49.3 | -6.5% | 40.8 |
| IIPR | 263.6 | 0.7% | 202.6 |
| PW | 2.8 | 154.5% | 1.4 |
| AFCG | 19.1 | — | — |
| REFI | 48.8 | -7.5% | — |
| CTRE | 571.4 | 43.5% | 484.9 |
Source: Yahoo Finance
NLCP’s revenue fell 6.5% in TTM to 49.3M, while IIPR grew 0.7% on 263.6M of revenue and CTRE grew 43.5% on 571.4M, so NLCP is the only name in the group with a shrinking top line. That discount looks justified because NLCP’s 1.2 diluted EPS TTM is flat against IIPR’s 4.4 and CTRE’s 1.6, which tells me the market should not pay a growth premium for a business that is still contracting.
Valuation
| Company | Current Share Price (USD) | Trailing P/E | Forward P/E | EV/Revenue | EV/EBITDA | Price/Sales (TTM) | Price/Book (mrq) | Market Cap (USD Mil) | Enterprise Value (USD Mil) | Beta (5Y Monthly) | FCF Yield % (TTM) | Forward EPS | Analyst Target Price – Low | Analyst Target Price – Mean | Analyst Target Price – High | # Analyst Opinions |
|---|---|---|---|---|---|---|---|---|---|---|---|---|---|---|---|---|
| NLCP | 15 | 12.7 | 12.8 | 6 | 7.3 | 6.4 | 0.8 | 315 | 298 | 0.83 | 8.8% | 1.2 | 17 | 17.5 | 18 | 2 |
| IIPR | 56.2 | 12.7 | 12.8 | 7.9 | 10.3 | 5.9 | 0.9 | 1,548 | 2,082 | 1.40 | 6.5% | 4.4 | 51 | 64.5 | 90 | 4 |
| PW | 6.9 | — | 1.9 | 9.9 | 19.1 | 0.9 | -0.7 | 3 | 28 | 1.31 | 85.4% | 3.7 | — | — | — | — |
| AFCG | 3.5 | 18.2 | 4.7 | 9.3 | — | 4.1 | 0.4 | 78 | 178 | 1 | — | 0.7 | 8 | 8 | 8 | 1 |
| REFI | 10.8 | 7.9 | 5.6 | 8.3 | — | 5.7 | 0.8 | 277 | 404 | 0.34 | — | 1.9 | 10.5 | 15.1 | 20 | 4 |
| CTRE | 37.7 | 23.6 | 21.2 | 17.6 | 20.8 | 15.6 | 2 | 8,904 | 10,083 | 0.79 | -0.9% | 1.8 | 43 | 45.2 | 49 | 13 |
Source: Yahoo Finance
NLCP’s 8.8% FCF yield is the cleanest value signal here, and it beats IIPR’s 6.5% while CTRE is negative at -0.9%, so NLCP screens better on cash generation than the larger healthcare REITs. On the other hand, NLCP’s 7.3x EV/EBITDA and 6.0x EV/Revenue are still below IIPR’s 10.3x and 7.9x but far under CTRE’s 20.8x and 17.6x, which suggests the market is already discounting NLCP for weaker scale and a -6.5% revenue trend rather than rewarding its higher cash yield. Using peer EV/Revenue of 7.9x to 20.8x on NLCP’s 49.3M revenue gives an illustrative enterprise value of about $390M to $1B, or roughly $18.1 to $47.5 per share after netting NLCP’s 25.8M cash and 7.7M debt and dividing by 20.6M shares; that wide range shows how much the stock depends on which peer multiple you think is relevant, but the current 15.0 share price sits below even the low end of that peer band.
Profitability
| Company | Operating Margin (TTM) | Net Margin (TTM) | Return on Assets (TTM) | Return on Equity (TTM) | Gross Margin (TTM) | EBITDA Margin (TTM) |
|---|---|---|---|---|---|---|
| NLCP | 50.8% | 49.4% | 3.8% | 6.3% | 97.4% | 82.8% |
| IIPR | 48.8% | 52.3% | 3.3% | 7.4% | 88.3% | 76.8% |
| PW | 70.3% | -55.9% | 2.7% | -29.3% | 85.9% | 51.7% |
| AFCG | 54.5% | -17.1% | -0.9% | -1.8% | 100.0% | — |
| REFI | 62.7% | 60.2% | 6.4% | 9.6% | 100.0% | — |
| CTRE | 64.9% | 62.2% | 4.4% | 9.1% | 96.4% | 84.9% |
Source: Yahoo Finance
NLCP’s 97.4% gross margin, 82.8% EBITDA margin, 50.8% operating margin, and 49.4% net margin are all above IIPR’s 88.3%, 76.8%, 48.8%, and 52.3%, and well ahead of CTRE’s 96.4%, 84.9%, 64.9%, and 62.2% on the operating line but not the net line. The pattern points more to a scale and opex gap than a cost-of-revenue problem, because NLCP’s gross margin is already elite and the remaining spread is mostly about how much overhead the platform can absorb.
Leverage
| Company | Total Debt/Equity % (mrq) | Current Ratio (mrq) | Total Debt (mrq, USD Mil) | Operating Cash Flow TTM (USD Mil) | Free Cash Flow TTM (USD Mil) | Net Debt/EBITDA (TTM) | FCF Margin % (TTM) |
|---|---|---|---|---|---|---|---|
| NLCP | 2 | 3.5 | 7.7 | 41.7 | 27.6 | -0.4 | 56.0% |
| IIPR | 32.9 | 4.6 | 609 | 196.4 | 99.9 | 2 | 37.9% |
| PW | 419.2 | 7 | 19.6 | 1.5 | 2.2 | 11.4 | 77.5% |
| AFCG | 110.3 | 0.8 | 206.6 | -31.5 | — | — | — |
| REFI | 46.6 | 26.6 | 140.5 | 26.9 | — | — | — |
| CTRE | 26.7 | 3.3 | 1,205.1 | 447 | -80.3 | 2.4 | -14.1% |
Source: Yahoo Finance
NLCP’s 2.0% debt/equity and -0.4x net debt/EBITDA are far lighter than IIPR’s 32.9% debt/equity and 2.0x net debt/EBITDA, while the 3.5x current ratio is below REFI’s 26.6x but still comfortably above 1.0x. That balance sheet is a structural advantage, not a risk, because NLCP’s 27.6M of TTM free cash flow equals 56.0% of revenue and gives it more flexibility than IIPR’s 37.9% and CTRE’s -14.1%, even though CTRE has the stronger absolute scale.
Conclusion
I would put my rating as a Hold because the stock’s 8.8% free cash flow yield and net-cash balance sheet are real supports, but the revenue line is still slipping and the tenant base remains concentrated. The key tension is that the moat is intact on paper, yet the numbers are not showing enough growth to justify paying up for it.
I would raise my rating more towards a Buy if revenue returns to positive year-over-year growth for two straight quarters and FCF margin stays above 50.0%, because that would show the current cash yield is being earned on a stable base rather than a declining one. If annualized revenue moved back above $52M, roughly 5% above the current run rate, while leverage stayed below net cash, I would read that as proof the portfolio can compound without leaning on multiple expansion alone. I would also want to see the large tenant exposures stop driving vacancy before I got more constructive, because a second round of rent disruption would make the current yield look less durable.
I would move from Hold to Sell if tenant stress starts to hit cash rent again, especially if one of the large exposures such as Curaleaf or The Cannabist Company pushes vacancy higher and FCF margin falls below 45.0%, meaning the current cash yield is being eroded by collections risk. A second year of revenue decline, even if modest, would also matter because it would tell me the 12.1-year lease term is not enough to offset tenant credit weakness.
Weighing both sides, I think the bear case is more likely to show up first because the stock already reflects a fair amount of optimism after a 6.3% 52-week gain, while the revenue trend has not yet turned. I am not bearish enough to sell because the cash yield and balance sheet give real downside support, but I am not ready to buy until the operating line proves it can stop drifting lower.
What to Watch Next
- Revenue back to year-over-year growth for two straight quarters — would support a move toward Buy.
- FCF margin above 50.0% — would confirm the cash yield is holding on a stable base.
- Vacancy tied to Curaleaf or The Cannabist Company — would raise tenant-concentration risk.
- Annualized revenue above $52M — would suggest the portfolio is compounding again.
- FCF margin below 45.0% — would argue the current yield is being eroded by collections risk.
What’s your take? I rated NewLake Capital Partners (NLCP) HOLD above — but the goal here is to get this right, not just to publish an opinion. What would you add to this analysis, or which risk or catalyst do you think I’m under- or over-weighting? Tell me in the comments.
Sources
- SEC 10-K Annual Report — filed 2026-03-06
- SEC 8-K Filing (2026-06-08)
- SEC 8-K Filing (2026-05-08)
- SEC 8-K Filing (2026-03-05)
- SEC Form 4 Insider Transaction (2026-06-08)
- SEC Form 4 Insider Transaction (2026-06-08)
- SEC Form 4 Insider Transaction (2026-06-08)
- SEC 10-K Annual Report — FY2026
- SEC 10-K Annual Report — FY2025
- SEC 10-K Annual Report — FY2024
- SEC 10-K Annual Report — FY2023
- SEC 10-K Annual Report — FY2022
Data sourced from Yahoo Finance and SEC EDGAR. Not investment advice.
Leave a Comment