
| Company | Sep 25 | Oct 25 | Nov 25 | Dec 25 | Jan 26 | Feb 26 | Mar 26 | Apr 26 | May 26 | Jun 26 | Jul 26 | Aug 26 | 12-Mo |
|---|---|---|---|---|---|---|---|---|---|---|---|---|---|
| EPR | +7% | -15% | +7% | -4% | +9% | +10% | -15% | +12% | +3% | +2% | +8% | -5% | +16% |
| VICI | -2% | -8% | -4% | -1% | -0% | +8% | -8% | +7% | -3% | -4% | -1% | -3% | -19% |
| GLPI | -1% | -4% | -3% | +5% | +0% | +9% | -8% | +9% | -3% | -4% | +1% | -6% | -6% |
| RHP | -8% | -3% | +10% | +0% | +0% | +4% | -5% | +14% | +10% | +13% | +4% | -5% | +35% |
| PK | -4% | -7% | +5% | -1% | +4% | +3% | -5% | +9% | +6% | +20% | +6% | +2% | +42% |
| HST | +0% | -6% | +10% | +3% | +5% | +6% | -1% | +10% | +9% | +7% | +6% | -13% | +38% |
Source: Yahoo Finance monthly adjusted close.
Quick Thesis
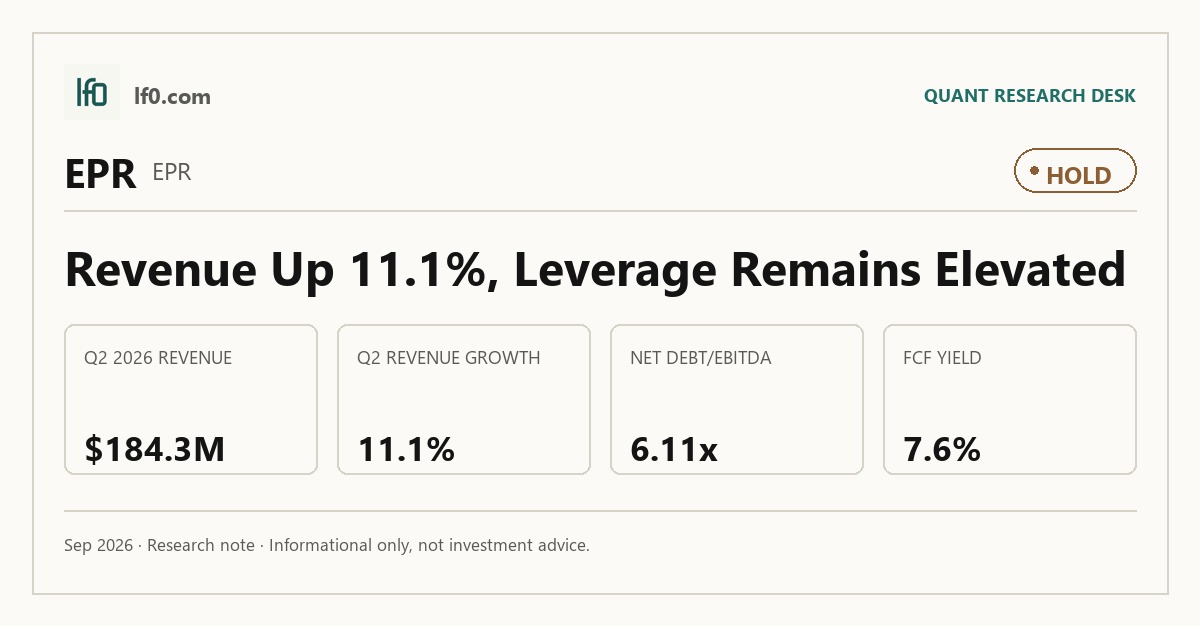
- Rated hold — cash generation is solid, but 6.1x net debt/EBITDA limits upside.
- Strongest strength: 54.3% operating margin and 45.7% FCF margin.
- Biggest risk: Topgolf, AMC, and Regal supplied 39.3% of 2025 revenue.
- Valuation looks fair at 10.8x EV/revenue and 13.8x EV/EBITDA.
- I would turn more constructive if net debt/EBITDA falls below 5.5x.
Executive Summary
Rating: HOLD | EPR
We’ll begin tracking this call’s performance since publication once sufficient adjusted-close data is available.
I would put my rating as a Hold because EPR Properties combines a 7.6% FCF yield and 54.3% operating margin with 6.1x net debt/EBITDA, so the equity is supported by real cash generation but still carries enough balance-sheet risk that I cannot call it cheap. The business also has a defensible lease structure, yet the 39.3% revenue concentration from Topgolf, AMC, and Regal keeps tenant risk high enough that the current 10.8x EV/revenue multiple already looks like fair credit for the model. I would raise my rating more towards a Buy if EPR can keep FCF margin above 45.0%, meaning cash conversion stays near the current 45.7% level, while net debt/EBITDA moves below 5.5x, which would show that leverage is coming down rather than being rolled forward.
Company Profile
EPR Properties was formed in 1997 as a self-administered Maryland real estate investment trust and completed its initial public offering on November 18, 1997. It earns revenue mainly through long-term triple-net leases and mortgage investments on experiential real estate, where tenants or borrowers pay most operating and maintenance costs. The portfolio spans 43 states and Canada and totaled about $5.7B of assets and $7B of total investments at December 31, 2025. As of that date, the company owned or financed 148 theatres, 60 eat & play properties, 26 attractions, 11 ski properties, 4 experiential lodging properties, 27 fitness & wellness properties, 1 gaming property, 1 cultural property, 46 early childhood education centers, and 9 private schools. It is listed on the New York Stock Exchange under EPR and is financed with unsecured debt, common shares, and preferred shares, including Series C, Series E, and Series G preferred stock.
Economic Moat
Business Model
The long-duration, triple-net lease structure is the part of EPR Properties’ model I view as hardest to copy within three years, because tenants and borrowers pay substantially all property operating costs while EPR locks in periodic rent or interest increases under contracts that are usually signed only after the asset and tenant are already matched. In practice, that gives EPR a cash-flow profile that is more predictable than a pure operating real estate owner, and the build-to-suit development program is a secondary edge because EPR can finance a project from start to finish and often secure cross-default provisions across multiple properties with the same tenant. The portfolio was 99% leased or operated at December 31, 2025, with 148 theatre properties, 60 eat & play properties, 26 attraction properties, 11 ski properties, 4 experiential lodging properties, 27 fitness & wellness properties, 1 gaming property, and 1 cultural property. I feel that this mix is defensible because it is tied to drive-to, discretionary venues that are harder to replace with e-commerce or at-home consumption, although the theatre book still leaves concentration risk because AMC and Regal together contributed 25.1% of FY2025 revenue.
Business & Operating Risks
Topgolf, AMC, and Regal are the clearest current credit risk because they account for $102.3M, $97.4M, and $82.8M of 2025 revenue, or 14.2%, 13.6%, and 11.5% respectively, according to the risk factors in their SEC 10-K. If any one of those tenants misses rent for a meaningful period, EPR Properties could be forced to reduce or suspend dividends and would need substitute tenants before cash flow normalizes, which is a direct threat to a REIT that must keep distributing cash. The financial data in this article already shows the risk is material, not hypothetical: the company is carrying $3.5B of total debt and depends on tenant cash flow to service it, so a Topgolf, AMC, or Regal default would hit both rent and refinancing capacity at the same time. A rough sensitivity is ugly: losing just Regal’s $82.8M of annual revenue would remove about 11.5% of 2025 revenue before any re-leasing delay or legal cost, which would pressure dividend coverage immediately. The disclosed risks do not break the moat outright, but they do test the very tenant concentration that makes the lease model work.
Refinancing and capital-market access is the second major risk. EPR relies in part on debt financing, has balloon payments in most financing arrangements, and had $3.5B of total debt outstanding as of December 31, 2025. Elevated interest rates could increase borrowing costs, limit refinancing, and force asset sales on unattractive terms. That is already showing up in the financial data here because the company is operating with meaningful leverage and limited flexibility to absorb a higher cost of capital, so this is not just boilerplate. The MD&A and the risk factors tell the same story: growth depends on new financing, but the current rate backdrop makes that financing more expensive and less certain.
The business is also exposed to experiential demand shocks that are more specific than generic real estate risk. The 10-K highlights theatres, eat and play, ski, attraction, experiential lodging, gaming, fitness and wellness, and cultural properties, all of which depend on discretionary spending and, in theatres, on film supply, release windows, and labor stability. That risk is already visible in the article’s financial data because these tenants operate in segments tied to consumer visitation, so a slowdown in discretionary spending would flow straight into rent coverage rather than being absorbed by a long lease term. Cybersecurity and artificial intelligence are newer additions to the risk stack, with the filing warning that cyber breaches could cause missed reporting deadlines, covenant violations, and reputational damage, while AI could worsen attack sophistication. Those are more forward-looking, but they are now explicit in the filing and were not a meaningful theme three years ago.
In 2023 and 2022, the dominant disclosed risk was COVID-19, including tenant closures, rent deferrals, and pandemic-driven disruption to experiential properties; that language has faded out of the current filing, which is a real improvement. In 2024 and 2025, the focus shifted toward inflation, higher rates, and refinancing pressure, and in 2026 the filing added tariffs, trade policy, cyber risk, and AI risk. The current risk profile is a material bear signal because the company still has concentrated tenant exposure, $3.5B of debt, and a financing model that is more vulnerable to rate and credit-market stress than it was before the pandemic.
Management Discussion & Analysis
Management is signaling a capital-allocation shift toward funding growth with the balance sheet rather than waiting on retained cash, and that is the right response to the refinancing pressure above. The clearest example is the December 5, 2025 at-the-market offering program, which allows up to $400M of common shares to be sold, and that tells me management wants equity flexibility to support acquisitions and development without overusing debt. They also issued $550M of senior notes due November 15, 2030 at 4.75% and used the net proceeds to repay the revolving credit facility, which pushes refinancing risk out to 2030 but does not reduce the $3.5B debt load, so investors should read it as liability management rather than deleveraging. The 2025 investment spend of $288.5M, with $129.4M into asset acquisitions, $72.7M into new development, and $50.1M into mortgage notes, says management is still leaning into portfolio expansion, but the filing also warns that tariffs could raise construction costs and reduce development yields, so the growth plan is more rate-sensitive than the headline spending suggests. The gap is that total revenue rose only 3.0% to $718.4M in 2025 while general and administrative expense rose 11.5% to $55.8M and interest expense rose 1.7% to $133.1M, which means the capital deployment is not yet translating into operating leverage; investors should not assume acquisitions are immediately accretive. The $400M ATM and the $90.6M cash balance together signal that management is keeping financing optionality open, but the presence of $629.6M of debt maturities in 2026 means that optionality is being preserved for refinancing as much as for growth.
Prior filings were broadly consistent on strategy but less clean on execution. In 2024’s 10-K, management said the challenging economic environment and a theatre tenant bankruptcy had increased the cost of capital and hurt near-term investment capacity, and the 2025 filing partially confirmed that caution because the company still had to refinance $300M of notes on April 1, 2025 and carry $179.6M of Series B notes due August 22, 2026. In 2023 and 2024, management repeatedly framed the business around predictable FFOAA and dividend growth, and 2025 did deliver FFOAA per diluted share of $5.12 versus $4.87 in 2024, so the core earnings objective was met even though the path included $55.8M of G&A, $2.2M of transaction costs, and $3M of retirement and severance expense. The leadership transition was disclosed cleanly: Executive Vice President and Chief Investment Officer Greg Zimmerman retired effective March 2, 2026, and Ben Fox, who joined in August 2025, will assume the role, which looks orderly rather than disruptive. Management credibility is solid but not pristine, because the tone has stayed constructive across years while the company has still had to rely on asset sales, debt issuance, and equity capacity to fund growth.
Recent Events
The most significant development I see here is the May 5, 2026 annual meeting outcome, where shareholders re-elected the full trustee slate and approved named executive pay on a non-binding basis. That outcome does not change the operating thesis, but it does confirm governance continuity and removes any near-term board disruption risk, which is supportive for a REIT that depends on steady capital allocation and lender confidence.
The May 6, 2026 8-K also confirms EPR Properties released first-quarter 2026 results, an investor presentation, and supplemental operating data. I view that as a routine disclosure rather than a strategic inflection, so it leaves the core thesis unchanged. The February 25, 2026 filing was the same pattern for fourth-quarter and full-year 2025 results, which reinforces that recent filings have been informational, not transformative.
Taken together, the recent 8-Ks leave the investment case materially unchanged: governance is stable, but there is no disclosed transaction, financing action, or strategic shift that would materially strengthen or weaken the structural position.
Financial Analysis
Growth
EPR — Financial Growth (Quarterly, USD Mil)
| Metric | 2025-06-30 | 2025-09-30 | 2025-12-31 | 2026-03-31 | 2026-06-30 |
|---|---|---|---|---|---|
| REVENUE (USD Mil) | 165.8 | 170.2 | 173.3 | 171.2 | 184.3 |
| EBIT (USD Mil) | 109.6 | 100.5 | 94 | 98 | 106.1 |
| EBITDA (USD Mil) | 151.7 | 143 | 137.6 | 142.9 | 154.7 |
| NET INCOME (USD Mil) | 75.6 | 66.6 | 66.9 | 62.6 | 67.2 |
| DILUTED EPS | 0.9 | 0.8 | 0.8 | 0.7 | 0.8 |
Source: Yahoo Finance — Quarterly Financial Statements
EPR’s revenue has been edging higher, not accelerating. Revenue rose from $165.8M in Q2 2025 to $184.3M in Q2 2026, a 11.1% increase, after $170.2M in Q3 2025, $173.3M in Q4 2025, and $171.2M in Q1 2026. EBITDA grew faster than revenue in the latest quarter, rising to $154.7M in Q2 2026 from $151.7M in Q2 2025, while net income moved from $75.6M to $67.2M over the same span, so earnings lagged revenue. The quarter-to-quarter dip in Q1 2026 was modest and not obviously seasonal from the data. This is a neutral growth signal: steady, but not strong enough to imply a re-rating.
Profitability
EPR — Profitability (TTM)
| Metric | TTM |
|---|---|
| Operating Margin (TTM) | 54.3% |
| Net Margin (TTM) | 35.6% |
| Return on Assets (TTM) | 4.2% |
| Return on Equity (TTM) | 11.3% |
| Gross Margin (TTM) | 91.9% |
| EBITDA Margin (TTM) | 77.7% |
Source: Yahoo Finance — Trailing Twelve Months (TTM)
TTM operating margin of 54.3%, gross margin of 91.9%, and EBITDA margin of 77.7% show a business with very little direct property-level cost pressure, which fits EPR’s triple-net lease model where tenants bear most operating expenses. The 23.4-point gap between gross margin and operating margin, and the 14.2-point gap between EBITDA margin and operating margin, imply that overhead and depreciation still absorb a meaningful share of revenue, so investors should weight operating margin more than gross margin when judging true earnings power. TTM net margin of 35.6% remains solid, but it sits well below EBITDA margin, which signals that non-cash charges and financing costs still take a large bite out of reported profit. TTM ROA of 4.25% versus TTM ROE of 11.3% suggests returns are being amplified by leverage rather than pure asset productivity. The profitability profile is a bull signal because margins are high and the business is already well into positive earnings territory, so the key watchpoint is whether operating margin stays above 50% and net margin keeps tracking EBITDA margin rather than slipping further.
Valuation
EPR — Valuation Multiples
| Metric | Value |
|---|---|
| Current Share Price (USD) | 57.8 |
| Market Cap (USD Mil) | 4,431 |
| Enterprise Value (USD Mil) | 7,946 |
| Trailing P/E | 18.4 |
| Forward P/E | 18.2 |
| Price/Sales (TTM) | 6 |
| Price/Book (mrq) | 1.9 |
| EV/Revenue | 10.8 |
| EV/EBITDA | 13.8 |
| Beta (5Y Monthly) | 1.01 |
| FCF Yield % (TTM) | 7.6% |
| Forward EPS (USD) | 3.2 |
| Analyst Target Price – Low (USD) | 58 |
| Analyst Target Price – Mean (USD) | 64.7 |
| Analyst Target Price – High (USD) | 70.5 |
| # Analyst Opinions | 11 |
Source: Yahoo Finance
EPR Properties trades at 10.8x EV/revenue and 13.8x EV/EBITDA on a current share price of $57.8, with a 6.0x trailing P/S and 18.4x trailing P/E. The primary read is EV/revenue: at 10.8x, the market is paying for a durable rent stream and assuming the experiential portfolio keeps converting into cash at a high rate, because the stock already sits above its 52-week low of $48.1 and near its 52-week high of $65.0. The 13.8x EV/EBITDA multiple is rich for a property owner, so investors are implicitly underwriting stable tenant performance and continued spread capture between property income and funding costs. FCF yield is 7.6%, which is a solid cash return at a $57.8 share price and suggests the equity is not priced as a deep value name. Price/book is 1.9x against book value per share of $30.2, so buyers are paying almost 2.0x accounting equity for a portfolio the market believes is worth more than its balance sheet cost. Beta is 1.0, so the stock is not being priced as a defensive utility-like asset. On the analysis here, I would put fair value in a range of $58–$66, which sits inside the analyst target range of $58–$70.5 and close to the $64.7 consensus mean; that tells me the market is already near the center of informed expectations rather than pricing in a clear misread. Forward EPS of $3.18 is close to VICI’s $3 and GLPI’s $3.3, so EPR’s higher share price is really a valuation choice, not a much stronger earnings base. Overall, the valuation signal is neutral to slightly expensive, and the current multiple already reflects the quality of the cash stream.
Leverage
EPR — Leverage & Coverage (Quarterly)
| Metric | Value |
|---|---|
| Total Debt/Equity % (mrq) | 152.2 |
| Current Ratio (mrq) | 1.7 |
| Total Debt (mrq, USD Mil) | 3,524.9 |
| Operating Cash Flow (TTM, USD Mil) | 440.8 |
| Levered Free Cash Flow (TTM, USD Mil) | 337.7 |
| Net Debt/EBITDA (TTM) | 6.1 |
| FCF Margin % (TTM) | 45.7% |
Source: Yahoo Finance — Quarterly Financial Statements
EPR’s leverage is elevated but still serviceable. Total Debt/Equity was 152.2%, current ratio was 1.666, and total debt was $3.5B, so the balance sheet is not lightly geared. Against that, operating cash flow was $440.8M and levered free cash flow was $337.7M, which shows the portfolio is still throwing off cash after interest and capex. Net debt/EBITDA was 6.1x, and FCF margin was 45.7%, so EBITDA converts well into cash, but the debt load still leaves limited room for a sharp downturn or a refinancing done at materially higher rates. In my opinion, this is medium refinancing risk because liquidity is adequate today, yet leverage is high enough that a weaker tenant environment or a higher coupon at the next maturity would tighten flexibility quickly. The profile is a bear-leaning neutral signal: cash generation is solid, but the debt stack keeps financial flexibility constrained.
Insider Activity
The insider transaction record I see here is one-sided: 14 open-market sales and 0 open-market purchases over 2025-01-02 to 2026-06-01, so insiders are net sellers. The selling is broad rather than concentrated, with multiple executives and a director involved, which weakens the alignment signal for shareholders. Bear signal.
Comparable Analysis
Growth
| Company | Revenue TTM (USD Mil) | Revenue Growth YoY % | Diluted EPS TTM |
|---|---|---|---|
| EPR | 739 | 10.6% | 3.1 |
| VICI | 4,097.6 | 5.7% | 2.6 |
| GLPI | 1,655.1 | 9.0% | 3.4 |
| RHP | 2,733.8 | 13.6% | 4.1 |
| PK | 2,545 | 1.0% | -0.8 |
| HST | 6,234 | 3.6% | 1.5 |
Source: Yahoo Finance
EPR’s revenue growth was 10.6% TTM, ahead of VICI at 5.7% and HST at 3.6%, but behind RHP at 13.6% and PK at 1.0%. That puts EPR in the middle of the group, so the stock deserves neither a deep discount nor a clear premium on growth alone, especially because its quarterly earnings growth was -13.2% while RHP posted 26.4% and HST 8.4%, which tells me EPR’s top line is not yet translating into the same earnings acceleration.
Valuation
| Company | Current Share Price (USD) | Trailing P/E | Forward P/E | EV/Revenue | EV/EBITDA | Price/Sales (TTM) | Price/Book (mrq) | Market Cap (USD Mil) | Enterprise Value (USD Mil) | Beta (5Y Monthly) | FCF Yield % (TTM) | Forward EPS | Analyst Target Price – Low | Analyst Target Price – Mean | Analyst Target Price – High | # Analyst Opinions |
|---|---|---|---|---|---|---|---|---|---|---|---|---|---|---|---|---|
| EPR | 57.8 | 18.4 | 18.2 | 10.8 | 13.8 | 6 | 1.9 | 4,431 | 7,946 | 1.01 | 7.6% | 3.2 | 58 | 64.7 | 70.5 | 11 |
| VICI | 24 | 9.3 | 8 | 10.8 | 12.2 | 6.4 | 0.9 | 26,404 | 44,379 | 0.68 | 1.0% | 3 | 26 | 32.2 | 38 | 24 |
| GLPI | 39.9 | 11.6 | 12 | 12.1 | 12.2 | 7.2 | 2.3 | 11,956 | 20,073 | 0.68 | 4.2% | 3.3 | 43 | 52.9 | 63 | 23 |
| RHP | 121.5 | 29.6 | 25.5 | 4.3 | 14.2 | 3.1 | 10.1 | 8,385 | 11,832 | 1.19 | 6.8% | 4.8 | 125 | 139.4 | 152 | 14 |
| PK | 15.2 | — | 27.8 | 2.7 | 10.7 | 1.2 | 1 | 3,058 | 6,839 | 1.33 | 34.9% | 0.5 | 11 | 15.9 | 20.5 | 16 |
| HST | 22.3 | 15 | 21.1 | 3.1 | 11.3 | 2.5 | 2.4 | 15,479 | 19,187 | 1.10 | 10.9% | 1.1 | 21 | 25.3 | 29 | 20 |
Source: Yahoo Finance
EPR trades at 10.8x EV/revenue, 18.4x trailing P/E, 18.2x forward P/E, and a 7.6% FCF yield, while VICI is 10.8x EV/revenue, 9.3x P/E, and 1.0% FCF yield, GLPI is 12.1x EV/revenue, 11.6x P/E, and 4.2% FCF yield, HST is 3.1x EV/revenue, 15.0x P/E, and 10.9% FCF yield, and PK is 2.7x EV/revenue with a 34.9% FCF yield. On a peer multiple range, EPR’s 10.8x EV/revenue applied to $739M of revenue implies about $7.9B of EV, or roughly $58 per share after netting $3.5B of debt and $16.3M of cash and dividing by 76.6M shares, which is essentially the current $57.8 price and says the market is already discounting a fair amount of quality. Forward EPS of $3.18 is close to VICI’s $3 and GLPI’s $3.3, so the higher share price is really a valuation choice, not a much stronger earnings base. EPR’s valuation also looks more defensible because its 45.7% FCF margin is far stronger than VICI’s 6.5% and GLPI’s 30.6%, even though the leverage profile is less forgiving than those peers.
Profitability
| Company | Operating Margin (TTM) | Net Margin (TTM) | Return on Assets (TTM) | Return on Equity (TTM) | Gross Margin (TTM) | EBITDA Margin (TTM) |
|---|---|---|---|---|---|---|
| EPR | 54.3% | 35.6% | 4.2% | 11.3% | 91.9% | 77.7% |
| VICI | 70.2% | 67.5% | 4.8% | 9.8% | 99.3% | 88.8% |
| GLPI | 77.5% | 58.5% | 6.4% | 19.4% | 102.2% | 99.6% |
| RHP | 23.3% | 9.9% | 5.4% | 22.6% | 35.2% | 30.6% |
| PK | 17.6% | -6.4% | 2.7% | -4.9% | 30.9% | 25.1% |
| HST | 18.2% | 16.5% | 4.3% | 15.6% | 29.2% | 27.2% |
Source: Yahoo Finance
EPR’s 91.9% gross margin, 77.7% EBITDA margin, 54.3% operating margin, and 35.6% net margin all exceed VICI’s 99.3%, 88.8%, 70.2%, and 67.5% only on gross and EBITDA, while EPR still beats HST’s 29.2%, 27.2%, 18.2%, and 16.5%, RHP’s 35.2%, 30.6%, 23.3%, and 9.9%, and PK’s 30.9%, 25.1%, 17.6%, and -6.4%. The gap looks structural rather than cyclical: EPR’s margins are much closer to the high-quality net-lease peers than to the hotel operators, which supports a premium multiple.
Leverage
| Company | Total Debt/Equity % (mrq) | Current Ratio (mrq) | Total Debt (mrq, USD Mil) | Operating Cash Flow TTM (USD Mil) | Free Cash Flow TTM (USD Mil) | Net Debt/EBITDA (TTM) | FCF Margin % (TTM) |
|---|---|---|---|---|---|---|---|
| EPR | 152.2 | 1.7 | 3,524.9 | 440.8 | 337.7 | 6.1 | 45.7% |
| VICI | 60.3 | 11.2 | 17,843.7 | 2,638.3 | 267 | 4.8 | 6.5% |
| GLPI | 155.7 | 24.3 | 8,379.9 | 1,203.4 | 506.8 | 4.9 | 30.6% |
| RHP | 334.6 | 1.3 | 4,132.6 | 691.9 | 568 | 4.5 | 20.8% |
| PK | 135.2 | 0.3 | 4,102 | 404 | 1,068.9 | 6 | 42.0% |
| HST | 85.3 | 1.7 | 5,645 | 1,606 | 1,692.4 | 2.2 | 27.2% |
Source: Yahoo Finance
EPR’s debt/equity is 152.2% and net debt/EBITDA is 6.1x, above VICI at 60.3% and 4.8x, GLPI at 155.7% and 4.9x, HST at 85.3% and 2.2x, and RHP at 334.6% and 4.5x. The 45.7% FCF margin is strong, but the 6.1x net leverage says EPR is more aggressively financed than VICI or HST, so the valuation should not be read as a pure quality premium. That leverage gap explains part of why EPR does not command the same multiple as the cleanest net-lease names even though its margins are strong.
Conclusion
The tension in this name is simple: EPR has the cash generation and margin profile to justify a premium, but the 6.1x net debt/EBITDA and 39.3% revenue concentration in Topgolf, AMC, and Regal keep the equity from looking truly cheap. I would put my rating as a Hold because the current numbers show a business that is functioning well, not one that has already de-risked enough to deserve a more aggressive call. The market is already giving credit for the quality of the rent stream, and the latest figures do not yet show that credit being earned by a meaningful reduction in leverage.
I would raise my rating more towards a Buy if EPR can keep FCF margin above 45.0%, meaning cash conversion stays near the current 45.7% level, while net debt/EBITDA moves below 5.5x, which would show that leverage is coming down rather than being rolled forward. If that happens alongside quarterly revenue holding above $180M, roughly the latest run rate, I would read it as proof that the portfolio can absorb refinancing costs and still fund the dividend without stretching the balance sheet.
I would move from Hold to Sell if any one of the three key tenants, Topgolf, AMC, or Regal, shows a sustained rent problem, because Regal alone represented $82.8M of 2025 revenue and losing that stream would cut about 11.5% of annual revenue before re-leasing costs or downtime. A second trigger would be net debt/EBITDA moving above 6.5x, which would tell me the current leverage is no longer being offset by cash flow and that the next refinancing could become meaningfully more expensive.
Weighing both sides, I lean to Hold because the cash yield and margin profile are good enough to support the current price, but not strong enough to ignore the tenant concentration and leverage. The bull case needs cleaner tenant performance and lower leverage before I get more constructive, while the bear case can arrive quickly if one of the large tenants stumbles, so I see the stock as fairly priced with limited room for error.
What to Watch Next
- Net debt/EBITDA below 5.5x — would support a move toward Buy.
- FCF margin above 45.0% — would confirm cash conversion is holding.
- Quarterly revenue above $180M — would show the run rate is intact.
- Sustained rent pressure at Topgolf, AMC, or Regal — would push the call toward Sell.
- Net debt/EBITDA above 6.5x — would signal refinancing risk is worsening.
What’s your take? I rated EPR Properties (EPR) HOLD above — but the goal here is to get this right, not just to publish an opinion. What would you add to this analysis, or which risk or catalyst do you think I’m under- or over-weighting? Tell me in the comments.
Sources
- SEC 10-K Annual Report — filed 2026-02-26
- SEC 8-K Filing (2026-05-07)
- SEC 8-K Filing (2026-05-06)
- SEC 8-K Filing (2026-02-25)
- SEC Form 4 Insider Transaction (2026-06-02)
- SEC Form 4 Insider Transaction (2026-06-02)
- SEC Form 4 Insider Transaction (2026-06-02)
- SEC 10-K Annual Report — FY2026
- SEC 10-K Annual Report — FY2025
- SEC 10-K Annual Report — FY2024
- SEC 10-K Annual Report — FY2023
- SEC 10-K Annual Report — FY2022
Data sourced from Yahoo Finance and SEC EDGAR. Not investment advice.
Leave a Comment