
| Company | Jul 25 | Aug 25 | Sep 25 | Oct 25 | Nov 25 | Dec 25 | Jan 26 | Feb 26 | Mar 26 | Apr 26 | May 26 | Jun 26 | 12-Mo |
|---|---|---|---|---|---|---|---|---|---|---|---|---|---|
| TTWO | -8% | +5% | +11% | -1% | -4% | +4% | -14% | -4% | -7% | +8% | +5% | +12% | +3% |
| TCEHY | +9% | +11% | +10% | -4% | -3% | -3% | -0% | -14% | -4% | -3% | -9% | +1% | -13% |
| NTES | -3% | +5% | +12% | -8% | -1% | +0% | -6% | -11% | -2% | +5% | +5% | +5% | -2% |
| EA | -5% | +13% | +17% | -1% | +1% | +1% | -0% | -2% | +2% | -1% | -0% | +2% | +29% |
| OTGLY | -13% | +4% | +7% | -8% | +1% | -4% | +10% | -8% | -4% | +17% | -17% | -6% | -23% |
Source: Yahoo Finance monthly adjusted close.
Executive Summary
Rating: SELL | TTWO
Daily adjusted-close performance will appear here after the next LF0 performance refresh.
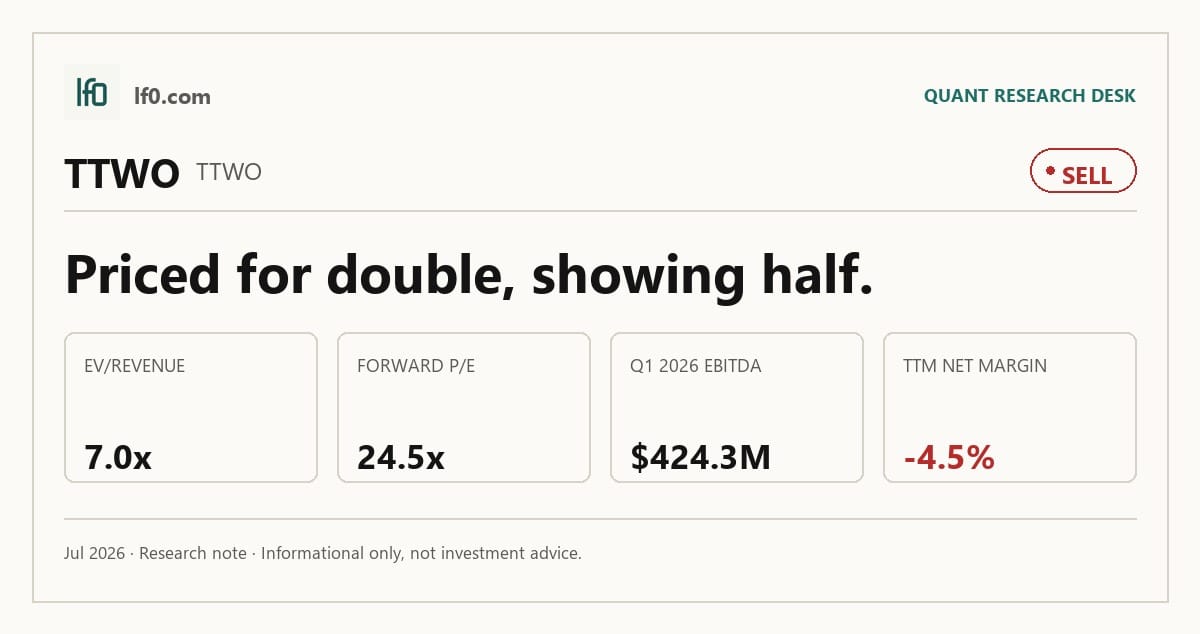
I would put my rating as a Sell because the stock already discounts a clean Grand Theft Auto VI launch while the latest reported margins are still thin, with TTM operating margin at 2.3% and EBITDA margin at 11.8%. I feel the franchise portfolio is real and the balance sheet is serviceable, but the current valuation leaves little room for execution error when the business is still dependent on a narrow release slate. In my view, the one catalyst that matters most is whether post-launch EBITDA can move above $786M in a quarter, which would show the release cycle is translating into durable earnings power rather than a one-off pop.
Company Profile
Take-Two Interactive Software was founded in 1993 and is listed on Nasdaq under TTWO. It develops, publishes, and markets interactive entertainment through Rockstar Games, 2K, and Zynga, with products built for console, mobile, and PC and distributed through retail, digital download, online platforms, and cloud streaming.
Its footprint spans offices and studios across the U.S., Canada, Europe, and Asia, including Rockstar’s New York offices, 2K’s Novato studios, and Zynga’s San Mateo headquarters. The company owns an office building in Los Angeles and office space in New York, while its principal executive offices are in New York under a lease through December 2037. It finances itself with equity and debt, and its common stock had 269 record holders as of May 11, 2026.
Economic Moat
Business Model
The moat here comes from owned intellectual property, not from distribution alone. Rockstar, 2K, and Zynga give Take-Two multiple ways to monetize the same content across console, mobile, PC, digital download, online platforms, and cloud streaming, and that breadth is harder for a well-funded rival to copy quickly than a pure publishing model.
I also think the live-operations footprint matters. The company already reaches consumers through retail, digital download, online platforms, and cloud streaming, so a new entrant would have to match both content quality and operating execution at scale. AI tools may help game play and consumer targeting, but I see that as an incremental support, not the core source of advantage.
The portfolio has become more integrated since the Zynga acquisition broadened the platform mix into mobile live services, but the repeated write-downs in FY2024 and FY2025 show that the moat is selective rather than broad. That is still a real edge, yet it depends on a small number of franchises landing well.
Business & Operating Risks
The biggest disclosed risk is franchise concentration: Grand Theft Auto contributed 12.4% of net revenue in FY2026, and the five best-selling franchises together accounted for 54.3% of net revenue. According to the risk factors in their SEC 10-K, Take-Two is dependent on the future success of Grand Theft Auto and other hit titles, so a delay or weaker reception for one release can move the whole income statement.
Platform dependence is the next issue. The company derived 39.0% of net revenue by product platform from Sony’s PlayStation and Microsoft’s Xbox in FY2026, and 91.0% of mobile revenue came from Apple and Google platforms, while the filing says it must obtain title-by-title approval from hardware licensors that are also competitors. That is a direct choke point on release timing, fee structures, and discoverability.
Regulatory and content exposure is also rising, especially around loot boxes, virtual currencies, privacy, and age-based rules. The E.U. Digital Services Act became fully applicable on February 17, 2024 and can impose fines of up to 6% of annual global revenues, while the FTC’s COPPA amendments became effective in April 2026 and expand covered personal information plus new retention and security duties.
Taken together, these risks do not break the moat, but they do cap how much pricing power the franchise portfolio can translate into. The managed-content advantage is real, yet it is vulnerable to platform gatekeepers and to concentration in a handful of releases.
Management Discussion & Analysis
Management is signaling a near-term capital allocation pivot toward de-risking the balance sheet and funding the release slate, not toward buybacks. Cash, cash equivalents, and restricted cash and cash equivalents rose to $1.6B at March 31, 2026, helped by proceeds from the May 2025 underwritten public offering of common stock and positive cash flow from product sales, while the company also repaid the $550M 2026 Notes on March 28, 2026 and the $600M 2025 Notes on April 14, 2025.
That response addresses the financing side of the risk profile, even if it does not reduce franchise concentration. The cleaner balance sheet gives management more room to absorb release timing risk, but it does not change the fact that earnings still depend on a narrow slate.
The 2026 capital plan still calls for $200M of capital expenditures, so investors should expect continued investment in software, fixed assets, and licenses rather than a step-up in free cash deployment. The clearest forward catalyst is Rockstar’s planned release of Grand Theft Auto VI on November 19, 2026, and the fact that Grand Theft Auto products generated 12.4% of fiscal 2026 net revenue means the launch can move the top line. Even so, the business is not waiting on one title to stay healthy, because fiscal 2026 net revenue growth to $6,656.4M and 19.0% net bookings growth to $6,721M were already driven mainly by NBA 2K, Borderlands 4, and Color Block Jam.
Management’s track record is mixed but not poor. Fiscal 2026 confirmed the impairment reset after the $3,545.2M goodwill charge in fiscal 2025, and the company repaid both note maturities on schedule. The weaker point is tone: in fiscal 2024 and fiscal 2025, management kept emphasizing product timing and strategy changes while results deteriorated into a $4,391.1M operating loss in fiscal 2025, so the narrative was slower than the numbers.
Recent Events
The most material recent event is the planned Grand Theft Auto VI release on November 19, 2026, which is the clearest structural test of the moat. If the launch lands well, it should reinforce the value of Take-Two’s owned-IP model; if it slips or underperforms, the concentration risk above becomes much more visible.
The other notable development is the company’s financing cleanup. The May 2025 equity raise and the repayment of the 2025 and 2026 Notes show management is using capital markets access to reduce near-term pressure, which supports the moat by preserving flexibility, even if it does not solve the dependence on hit titles.
Financial Analysis
Growth
TTWO — Financial Growth (Quarterly, USD Mil)
| Metric | 2025-03-31 | 2025-06-30 | 2025-09-30 | 2025-12-31 | 2026-03-31 |
|---|---|---|---|---|---|
| REVENUE (USD Mil) | 1,582.5 | 1,503.8 | 1,773.8 | 1,699 | 1,679.8 |
| EBIT (USD Mil) | -3,797.2 | 17.4 | -98 | -38.7 | 78.6 |
| EBITDA (USD Mil) | -3,313.8 | 280.4 | 263.1 | 269.5 | 424.3 |
| NET INCOME (USD Mil) | -3,726.2 | -11.9 | -133.9 | -92.9 | -59.5 |
| DILUTED EPS | -21.1 | -0.1 | -0.7 | -0.5 | -0.3 |
Source: Yahoo Finance — Quarterly Financial Statements
Revenue has been choppy rather than linear: TTWO posted $1.6B in Q1 2025, $1.5B in Q2 2025, $1.8B in Q3 2025, $1.7B in Q4 2025, and $1.7B in Q1 2026. The clearest growth point was Q3 2025, when revenue rose to $1.8B from $1.5B in Q2 2025, a 18.0% sequential jump that fits the release-timing pattern management describes.
EBITDA moved faster than revenue in Q1 2026, rising to $424.3M from $280.4M in Q2 2025, while net income stayed negative at -$59.5M in Q1 2026. That tells me the growth engine is still release-driven and not yet showing durable acceleration, so the top line is improving without yet proving a self-sustaining earnings inflection.
Profitability
TTWO — Profitability (TTM)
| Metric | TTM |
|---|---|
| Operating Margin (TTM) | 2.3% |
| Net Margin (TTM) | -4.5% |
| Return on Assets (TTM) | -0.5% |
| Return on Equity (TTM) | -10.6% |
| Gross Margin (TTM) | 57.7% |
| EBITDA Margin (TTM) | 11.8% |
Source: Yahoo Finance — Trailing Twelve Months (TTM)
TTM gross margin of 57.7% shows the game portfolio still clears a healthy amount after direct production costs, so the content layer is not the problem. The issue sits below that line: TTM EBITDA margin is 11.8%, which leaves a 45.9 percentage point gap to gross margin and points to heavy spending on development, marketing, and live-service support.
TTM operating margin of 2.3% is barely positive, while TTM net margin is -4.5%, so the business is not yet converting operating scale into bottom-line profit. TTM ROA of -0.5% and TTM ROE of -10.6% confirm that capital is still earning below cost, and the ROE gap versus ROA suggests leverage is amplifying weak underlying returns rather than creating efficiency.
I would watch for net margin moving toward operating margin, because that would show financing and non-operating drag is fading. For now, the profitability profile remains a bear signal.
Valuation
TTWO — Valuation Multiples
| Metric | Value |
|---|---|
| Market Cap (USD Mil) | 45,414 |
| Enterprise Value (USD Mil) | 46,262 |
| Trailing P/E | — |
| Forward P/E | 24.5 |
| Price/Sales (TTM) | 6.8 |
| Price/Book (mrq) | 12.9 |
| EV/Revenue | 7 |
| EV/EBITDA | 58.7 |
| Beta (5Y Monthly) | 0.96 |
| FCF Yield % (TTM) | 3.2% |
| Forward EPS (USD) | 10 |
| Analyst Target Price – Low (USD) | 170 |
| Analyst Target Price – Mean (USD) | 284.1 |
| Analyst Target Price – High (USD) | 368 |
| # Analyst Opinions | 29 |
Source: Yahoo Finance
TTWO screens as a growth and value blend, but the primary anchor is earnings power because the stock still trades at 24.5x forward P/E and 58.7x EV/EBITDA. That EV/EBITDA implies the market is pricing in a sharp step-up in profitability, not just steady execution, because the current TTM EBITDA margin is only 11.8%.
Price/Sales (TTM) is 6.8x and EV/Revenue is 7.0x, which means investors are paying for the GTA VI launch cycle and for the possibility that revenue converts into much higher operating profit after the November 19, 2026 release. FCF Yield (TTM) is 3.2%, so cash generation is positive but not cheap enough to offset the earnings multiple on its own. Beta is 1.0x, so the stock is not unusually volatile.
On the analysis here, I would put fair value in a wide range of roughly $0-$72 per share using a conservative peer-multiple lens, but that range is not a consensus target; it is my way of showing how much the stock depends on whether the launch cycle turns into sustained margin expansion. That sits well below the $284.1 analyst mean target across 29 opinions, which tells me the Street is more optimistic than I am about the speed and durability of the earnings recovery. I would rather underwrite the business on the current $6.7B revenue base and the still-thin margin profile than on a clean rerating that has not yet been earned.
I would also frame forward EPS at roughly $10.0 as a reasonable near-term anchor, but that figure looks rich relative to peers only if margins improve. Compared with NTES at $10.6 and EA at $9.6, TTWO is not obviously cheap on earnings power, especially when its own profitability is still far weaker than theirs.
Overall, the valuation picture is a bear signal because the multiple stack already discounts a strong GTA VI outcome.
Leverage
TTWO — Leverage & Coverage (Quarterly)
| Metric | Value |
|---|---|
| Total Debt/Equity % (mrq) | 84.3 |
| Current Ratio (mrq) | 1.2 |
| Total Debt (mrq, USD Mil) | 2,958.3 |
| Operating Cash Flow (TTM, USD Mil) | 624.3 |
| Levered Free Cash Flow (TTM, USD Mil) | 1,447.8 |
| Net Debt/EBITDA (TTM) | 1.2 |
| FCF Margin % (TTM) | 21.8% |
Source: Yahoo Finance — Quarterly Financial Statements
Total Debt/Equity was 84.3%, Current Ratio was 1.2x, and Total Debt was $3B. That leaves some balance-sheet room, but not a large cushion if a release delay or weaker consumer backdrop hits cash flow.
Cash generation is the real strength here: Operating Cash Flow was $624.3M TTM and Levered Free Cash Flow was $1.4B, with Net Debt/EBITDA at 1.2x and FCF Margin at 21.8%. In my view, that is manageable leverage because the company is producing cash well above debt service needs, and the current ratio gives near-term liquidity coverage.
The key cross-check is that leverage and profitability have to improve together. If EBITDA stays near the current run rate, the debt load is serviceable; if the launch cycle lifts margins, the balance sheet becomes a much smaller issue. For now, leverage is not the thesis problem, but it is also not a reason to pay a premium multiple.
Insider Activity
The insider transaction record I see here is one-sided selling: 74 open-market sales and 0 open-market purchases in the 2025-02-14 to 2026-06-04 window. Activity is concentrated, with Karl Slatoff and the CEO group accounting for multiple June sales, but it is also broad enough to include a director, the chief legal officer, and the chief financial officer.
In my view, that is a bear signal because open-market selling is both persistent and spread across senior insiders, which weakens alignment with shareholders. It does not prove anything on its own, but it does not help the case for paying up ahead of the launch cycle.
Comparable Analysis
Growth
| Company | Revenue TTM (USD Mil) | Revenue Growth YoY % | EBITDA TTM (USD Mil) | Diluted EPS TTM |
|---|---|---|---|---|
| TTWO | 6,656.4 | 6.1% | 788.5 | -1.6 |
| TCEHY | 768,202 | 9.1% | 282,354 | 3.6 |
| NTES | 114,388.5 | 6.1% | 40,247.8 | 8.1 |
| EA | 7,531 | 11.9% | 1,485 | 3.5 |
| OTGLY | — | 6.1% | 490.1 | 0.3 |
Source: Yahoo Finance
TTWO’s revenue growth of 6.1% TTM matches NTES at 6.1% and trails TCEHY at 9.1% and EA at 11.9%, so the market is not paying for a clear growth lead here. Diluted EPS is still negative at -1.6 TTM, while EA and NTES are already positive at 3.5 and 8.1, which makes TTWO’s growth look more like a pre-profitability bridge than a peer-leading expansion story.
Valuation
| Company | Trailing P/E | Forward P/E | EV/Revenue | EV/EBITDA | Price/Sales (TTM) | Price/Book (mrq) | Market Cap (USD Mil) | Enterprise Value (USD Mil) | Beta (5Y Monthly) | FCF Yield % (TTM) | Forward EPS | Analyst Target Price – Low | Analyst Target Price – Mean | Analyst Target Price – High | # Analyst Opinions |
|---|---|---|---|---|---|---|---|---|---|---|---|---|---|---|---|
| TTWO | — | 24.5 | 7 | 58.7 | 6.8 | 12.9 | 45,414 | 46,262 | 0.96 | 3.2% | 10 | 170 | 284.1 | 368 | 29 |
| TCEHY | 16.2 | 11.2 | 0.7 | 1.9 | 0.7 | 3.1 | 519,124 | 546,188 | 0.73 | 25.1% | 5.1 | 84.4 | 97.6 | 106.2 | 3 |
| NTES | 15.8 | 12.1 | 2.1 | 6 | 0.7 | 16.8 | 81,696 | 240,511 | 0.79 | 41.8% | 10.6 | 132.7 | 161.5 | 200.3 | 32 |
| EA | 59.6 | 21.7 | 6.8 | 34.5 | 7 | 7.8 | 52,472 | 51,299 | 0.64 | 4.2% | 9.6 | 168 | 205.8 | 210 | 14 |
| OTGLY | 46.8 | — | — | — | — | 0.5 | 6,174 | — | 0.40 | -3.9% | — | — | — | — | — |
Source: Yahoo Finance
TTWO’s FCF yield of 3.2% TTM is far below TCEHY’s 25.1%, NTES’s 41.8%, and EA’s 4.2%, while its forward P/E of 24.5x is above NTES at 12.1x and TCEHY at 11.2x. On an EV/Revenue basis, TTWO at 7.0x also screens rich versus NTES at 2.1x and TCEHY at 0.7x, and the market is clearly paying for a cleaner earnings path than the peer set implies.
A $1 investment a year ago would be worth $1.08 in TTWO, versus $0.83 in TCEHY, $0.96 in NTES, $1.38 in EA, and $0.87 in OTGLY. TTWO’s recent rebound looks more like a sentiment swing than a steady rerating, which is why I do not think the stock deserves a premium just because the launch calendar is visible.
Profitability
| Company | Operating Margin (TTM) | Net Margin (TTM) | Return on Assets (TTM) | Return on Equity (TTM) | Gross Margin (TTM) | EBITDA Margin (TTM) |
|---|---|---|---|---|---|---|
| TTWO | 2.3% | -4.5% | -0.5% | -10.6% | 57.7% | 11.8% |
| TCEHY | 34.3% | 30.6% | 7.9% | 20.5% | 56.5% | 36.8% |
| NTES | 41.4% | 29.8% | 11.0% | 22.1% | 65.7% | 35.2% |
| EA | 24.0% | 11.8% | 5.7% | 13.5% | 79.0% | 19.7% |
| OTGLY | 0.0% | 67.1% | 8.7% | 16.4% | — | — |
Source: Yahoo Finance
TTWO’s gross margin of 57.7% is close to TCEHY’s 56.5% and NTES’s 65.7%, but its operating margin of 2.3% and EBITDA margin of 11.8% are far below TCEHY’s 34.3% and 36.8% and NTES’s 41.4% and 35.2%. The gap looks more like an opex and development-spend burden than a cost-of-revenue problem, because TTWO’s gross margin is not the weak point; the issue is that operating leverage has not yet caught up with the content and live-service cost base.
TTWO’s ROE of -10.6% and ROA of -0.5% are also well below TCEHY, NTES, and EA, so capital efficiency is materially weaker than the peer group. That is the clearest reason I would not pay a peer-leading multiple for the stock today.
Leverage
| Company | Total Debt/Equity % (mrq) | Current Ratio (mrq) | Total Debt (mrq, USD Mil) | Operating Cash Flow TTM (USD Mil) | Free Cash Flow TTM (USD Mil) | Net Debt/EBITDA (TTM) | FCF Margin % (TTM) |
|---|---|---|---|---|---|---|---|
| TTWO | 84.3 | 1.2 | 2,958.3 | 624.3 | 1,447.8 | 1.2 | 21.8% |
| TCEHY | 33.5 | 1.4 | 405,511 | 327,514 | 130,086.6 | -0.2 | 16.9% |
| NTES | 6.5 | 3.3 | 10,955.5 | 52,366.2 | 34,148.8 | -4 | 29.8% |
| EA | 27.4 | 1 | 1,854 | 2,553 | 2,219.1 | -0.8 | 29.5% |
| OTGLY | 0.7 | 6 | — | — | -242.5 | — | — |
Source: Yahoo Finance
TTWO’s total debt to equity of 84.3% is higher than TCEHY’s 33.5%, NTES’s 6.5%, and EA’s 27.4%, but its net debt to EBITDA of 1.2x is still modest because it holds $2B of cash, or $10.7 per share. That makes the balance sheet a financing choice rather than a stress point, and TTWO’s 21.8% FCF margin is below NTES at 29.8% and EA at 29.5% but still healthy enough to fund development without leaning on leverage.
The leverage gap helps explain part of the valuation gap versus peers, but not all of it. In my view, investors are paying for the possibility that TTWO’s release cycle can close the profitability gap, not for balance-sheet safety.
Conclusion
I would put my rating as a Sell because the core tension is simple: the market is already paying for a successful Grand Theft Auto VI cycle, but the current numbers still show only 2.3% operating margin, 11.8% EBITDA margin, and negative net income. The franchise base is valuable and the balance sheet is not stressed, yet the stock is asking investors to trust a margin step-up that has not shown up in the reported run rate.
I would raise my rating more towards a Buy if the November 19, 2026 Grand Theft Auto VI release lifts quarterly EBITDA above $786M, because that would show the launch is converting into a materially stronger earnings base rather than a temporary spike. I would also want to see operating margin move into the high single digits, meaning the business is finally keeping more of each revenue dollar after development and marketing spend. If that happens while free cash flow stays above the current 21.8% margin, the valuation case changes quickly.
I would move from Sell to Hold if the launch is delayed but the company still shows clear pre-launch margin improvement, and I would stay bearish if the release slips again or the first two post-launch quarters fail to lift bookings and margin. In that case, the stock would be left with a 24.5x forward P/E on a business still earning only 2.3% operating margin, which is too much to pay for hope alone.
Weighing both cases, I lean against the stock today because the valuation already assumes the good outcome. The launch is real, but I want proof in margins before I get more constructive.
What’s your take? I rated Take-Two Interactive (TTWO) SELL above — but the goal here is to get this right, not just to publish an opinion. What would you add to this analysis, or which risk or catalyst do you think I’m under- or over-weighting? Tell me in the comments.
Sources
- SEC 10-K Annual Report — filed 2026-05-22
- SEC 8-K Filing (2026-05-21)
- SEC 8-K Filing (2026-02-03)
- SEC Form 4 Insider Transaction (2026-06-08)
- SEC Form 4 Insider Transaction (2026-06-03)
- SEC Form 4 Insider Transaction (2026-06-03)
- SEC 10-K Annual Report — FY2026
- SEC 10-K Annual Report — FY2025
- SEC 10-K Annual Report — FY2024
- SEC 10-K Annual Report — FY2023
- SEC 10-K Annual Report — FY2022
Data sourced from Yahoo Finance and SEC EDGAR. Not investment advice.
Leave a Reply