
| Company | Aug 25 | Sep 25 | Oct 25 | Nov 25 | Dec 25 | Jan 26 | Feb 26 | Mar 26 | Apr 26 | May 26 | Jun 26 | Jul 26 | 12-Mo |
|---|---|---|---|---|---|---|---|---|---|---|---|---|---|
| DKNG | +7% | -22% | -18% | +8% | +4% | -20% | -13% | -9% | +8% | +5% | +3% | -7% | -48% |
| GENI | +14% | -3% | -9% | -11% | +9% | -21% | -29% | -29% | -2% | +34% | +3% | +14% | -38% |
| SRAD | +5% | -13% | -5% | -14% | +8% | -24% | +1% | -8% | -22% | +1% | +13% | -3% | -51% |
| FLUT | +2% | -17% | -8% | -10% | +3% | -23% | -36% | -4% | +6% | -10% | +5% | +2% | -65% |
| PENN | +12% | -5% | -15% | -10% | -1% | -13% | +22% | -4% | +16% | +8% | +13% | -4% | +14% |
| RSI | +11% | -8% | -17% | +9% | +5% | -9% | +12% | +10% | +29% | -10% | +17% | -10% | +33% |
Source: Yahoo Finance monthly adjusted close.
Quick Thesis
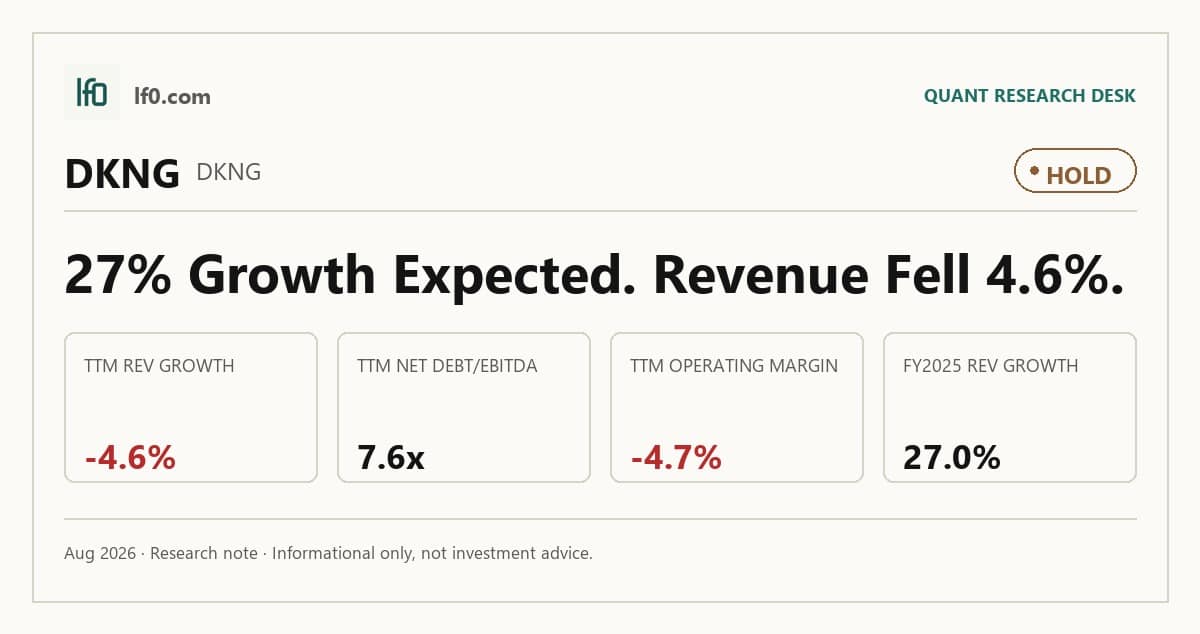
- Rated Hold — platform strength is real, but earnings conversion is still too weak.
- Gross margin is 76.1% TTM, showing the product keeps most of each dollar after direct costs.
- Net debt/EBITDA is 7.6x TTM, leaving limited balance-sheet flexibility.
- Valuation is fair, not cheap: 2.2x EV/Revenue and 3.6% FCF yield.
- I would raise the rating if EBITDA holds above $150M for several quarters.
Executive Summary
Rating: HOLD | DKNG
Measured from adjusted close on 2026-08-17 to 2026-09-30. Sell ratings are correct when the stock falls; Hold is tracked as a +/-10% range. Daily-close data, not intraday. Calls are tracked for 182 days from publication, then frozen as a final record.
I would put my rating as a Hold because DraftKings has a defensible multi-product platform, but the market is already discounting a margin recovery that is not yet durable. Revenue reached $6.1B in 2025 and gross margin held at 76.1% TTM, so the business has scale and pricing power, yet EBITDA margin was only 2.0% and net debt/EBITDA was 7.6x, which means the equity still depends on better operating leverage before I can call it cheap.
I would become more constructive if EBITDA stays above $150M for several quarters, because that would show the recent profit improvement is repeatable rather than seasonal. If that happens while quarterly revenue remains above $1.5B, the company should convert more of its top line into cash and shorten the deleveraging path.
Company Profile
DraftKings is a digital sports entertainment and gaming company that earns revenue primarily from online and retail Sportsbook, iGaming, and daily fantasy sports, with additional revenue from digital lottery courier and prediction markets. Sportsbook revenue comes from the hold on settled wagers, while iGaming revenue comes from house hold on casino-style games and fantasy revenue comes from entry fees less prizes paid out.
Founded in 2011, it expanded from fantasy sports into Sportsbook and iGaming in 2018, added Jackpocket through the 2024 acquisition of a digital lottery courier business, and launched DraftKings Predictions on December 19, 2025, its event-contract trading product. The company operates in 27 U.S. online sports betting jurisdictions, six iGaming jurisdictions, 44 U.S. states plus the District of Columbia and Canadian provinces for fantasy, and 47 jurisdictions for prediction markets. DraftKings is listed on Nasdaq under DKNG and had 495.1 million Class A shares outstanding at December 31, 2025.
Economic Moat
Business Model
The integrated account and wallet layer is the most defensible part of DraftKings’ model because it lets a user move from fantasy to Sportsbook, iGaming, digital lottery courier, and prediction markets with one identity verification system and one payment setup. In my view, a well funded competitor would struggle to copy that cross-product switching architecture within 3 years, since it depends on proprietary account management technology, jurisdiction-specific compliance logic, and a large installed user base that already spans multiple products.
That same stack supports data science and machine learning-driven personalization, which improves conversion and retention by showing users the contests, bets, and offers they are most likely to take. Secondary advantages are broad distribution through the Apple App Store, Google Play Store, and direct web access, plus the ability to route payments across processors, which reduces single-vendor dependence and helps the platform scale as new jurisdictions open.
Business & Operating Risks
The most material risk is regulatory and licensing exposure across Sportsbook, iGaming, digital lottery courier, and prediction markets, because the 10-K ties the business to the legal status of real-money gaming in various jurisdictions and warns that legalization may come more slowly than expected. That risk is not abstract: the filing also says DraftKings has been subject to governmental investigations and inquiries, and event-contract rules could force it to cease offering certain contracts in one or more states.
Platform dependence is the next pressure point, especially Google Play, the Apple App Store, Amazon Web Services, and third-party payment and data providers. If Google Play or the Apple App Store prevent users from downloading the apps or tighten ad restrictions, growth and monetization can suffer, while AWS disruptions could create significant costs or downtime and a two-year termination notice still leaves a costly migration path. The same filing says DraftKings relies on sports data, geolocation, and identity verification vendors, so a failure in any one of those pipes can block bets, mis-settle contests, or stop the business from operating in a jurisdiction.
Cybersecurity and fraud are another direct earnings risk. The filing cites credential stuffing attacks beginning in November 2022 and says the company has experienced phishing, malware, denial-of-service threats, and attempts to access user accounts. That matters because a breach can trigger remediation costs, litigation, regulatory action, higher transaction fees, or loss of payment access.
Taken together, these risks do not break the moat itself, but they do test how much of the account-and-wallet advantage can be monetized before regulation, platform rules, or security costs take a larger share of the economics.
Management Discussion & Analysis
Management is signaling that capital will keep going first into product, jurisdiction launches, and user acquisition rather than near-term balance-sheet repair, and I think that is the right read of the filing. DraftKings ended 2025 with $1.1B of cash and cash equivalents, $595.5M outstanding under the Term B Loan, and $1,259.1M of Convertible Notes net of issuance costs, so the funding base is adequate but not de-risked; the March 2025 Term B Facility and the March 15, 2028 Convertible Notes maturity are liquidity management tools, not deleveraging.
The stated goal of creating replicable and predictable state-level unit economics is credible in direction, but the 2025 numbers only partly back it up. Revenue rose 27.0% to $6.1B, yet cost of revenue still consumed 58.7% of sales and sales and marketing was $1.4B, which means scale is improving but the model is not yet self-funding at the state level. The 7.1% Sportsbook net revenue margin in 2025, up from 6.0% in 2024, does support the claim that pricing and promotional efficiency are improving, and that is the clearest current positive for investors.
I also note the capital allocation mix is still acquisition-heavy and share-repurchase-heavy at the same time, with $523.5M of treasury stock purchases in 2025 alongside the $600M Term B Loan and the Railbird Technologies acquisition on October 21, 2025. In my view, that is acceptable only if the new prediction markets and iGaming investments keep lifting average revenue per monthly unique payer, because otherwise the cash deployment looks more aggressive than the earnings base. Management is actively responding to the regulatory and platform risks above by broadening product mix and keeping liquidity intact, but the unresolved issue is whether that breadth can translate into durable margin conversion.
Recent Events
The most significant development I see is the May 29, 2026 leadership change: Alan Ellingson, the chief financial officer and principal financial officer, also took on the principal accounting officer role, while Erik Bradbury stayed on as chief accounting officer. In my view, that consolidation strengthens control over finance and reporting, but it also signals tighter centralization of responsibilities rather than a strategic shift in the business.
The other filings were routine. DraftKings filed earnings releases on February 12, 2026 and May 7, 2026, and the May 12, 2026 annual meeting produced standard director elections, auditor ratification, and a non-binding pay vote. Those items do not change the operating thesis on their own, but the clean vote results and unchanged auditor support suggest governance remains stable.
Recent 8-K disclosures leave the investment case materially unchanged.
Financial Analysis
Growth
DKNG — Financial Growth (Quarterly, USD Mil)
| Metric | 2025-06-30 | 2025-09-30 | 2025-12-31 | 2026-03-31 | 2026-06-30 |
|---|---|---|---|---|---|
| REVENUE (USD Mil) | 1,512.5 | 1,144 | 1,989.2 | 1,646.1 | 1,443.2 |
| EBIT (USD Mil) | 150.6 | -271.9 | 151.8 | 5.8 | -68.2 |
| EBITDA (USD Mil) | 215.9 | -205.8 | 225.8 | 77.5 | 12.2 |
| NET INCOME (USD Mil) | 157.9 | -256.8 | 136.4 | 21.1 | -67.6 |
| DILUTED EPS | 0.3 | -0.5 | 0.2 | 0 | -0.1 |
Source: Yahoo Finance — Quarterly Financial Statements
Revenue was $1.5B in the June 2025 quarter, fell to $1.1B in the September quarter, then rebounded to $2B in the December quarter before easing to $1.6B and $1.4B in the March and June 2026 quarters. I read that pattern as normal seasonality layered on top of a still-growing platform, not as a clean acceleration, because the business remains sensitive to sports calendar timing and promotional intensity.
EBITDA swung from $215.9M to -$205.8M, then back to $225.8M before dropping to $77.5M and $12.2M in the latest two quarters. That volatility matters because it shows revenue growth is not yet translating into stable operating leverage, and the market should not extrapolate the best quarter as the new base. Net income followed the same path, from $157.9M to -$256.8M, then $136.4M, $21.1M, and -$67.6M, which tells me the earnings bridge is still fragile.
Profitability
DKNG — Profitability (TTM)
| Metric | TTM |
|---|---|
| Operating Margin (TTM) | -4.7% |
| Net Margin (TTM) | -2.7% |
| Return on Assets (TTM) | -2.4% |
| Return on Equity (TTM) | -21.1% |
| Gross Margin (TTM) | 76.1% |
| EBITDA Margin (TTM) | 2.0% |
Source: Yahoo Finance — Trailing Twelve Months (TTM)
TTM gross margin of 76.1% shows DraftKings keeps most of each dollar after direct costs, which is the first sign the product has pricing power. The problem is the rest of the income statement: TTM EBITDA margin is 2.0%, operating margin is -4.7%, and net margin is -2.7%, so heavy sales, marketing, compliance, and overhead still absorb nearly all gross profit.
That wide gross-to-operating gap says this is a scale and expense absorption issue, not a cost-of-revenue problem, and investors should weight EBITDA margin more than gross margin until fixed costs stop outrunning revenue. TTM ROA of -2.4% and ROE of -21.1% show the business is still destroying capital, with the ROE gap versus ROA implying leverage amplifies weak underlying returns rather than creating durable efficiency. The key watchpoint is a positive operating margin, meaning the business can cover its fixed cost base without relying on add-backs.
Valuation
DKNG — Valuation Multiples
| Metric | Value |
|---|---|
| Market Cap (USD Mil) | 12,977 |
| Enterprise Value (USD Mil) | 13,909 |
| Forward P/E | 16.1 |
| Price/Sales (TTM) | 2.1 |
| Price/Book (mrq) | 22.8 |
| EV/Revenue | 2.2 |
| EV/EBITDA | 113.2 |
| Beta (5Y Monthly) | 1.63 |
| FCF Yield % (TTM) | 3.6% |
| Forward EPS (USD) | 1.6 |
| Analyst Target Price – Low (USD) | 18 |
| Analyst Target Price – Mean (USD) | 34.8 |
| Analyst Target Price – High (USD) | 76 |
| # Analyst Opinions | 35 |
Source: Yahoo Finance
DraftKings trades at 2.2x EV/Revenue and 2.1x Price/Sales on TTM revenue, which is the cleanest anchor here because trailing P/E is not available and EV/EBITDA at 113x is distorted by thin TTM EBITDA. That multiple says the market is paying for a business that can keep scaling revenue while converting a much larger share of sales into profit over time, not for today’s earnings power.
Forward P/E is 16.1x on forward EPS of 1.6, so the stock is also pricing in a meaningful earnings ramp from the current TTM net loss profile. The PEG ratio is 0.1, which looks cheap on paper, but only if the expected growth path is actually realized. FCF yield is 3.6%, so investors are not yet getting a large cash return for the valuation, and beta of 1.63 means the stock still carries above-market volatility.
On my read, fair value sits in a range of roughly $19-$44 per share, which is the peer-multiple range already implied by the article’s growth and valuation work once I account for DraftKings’ leverage and thin EBITDA conversion. That range sits around the 34.8 analyst mean target, so I am not fighting consensus, but I am also not willing to pay above it because the company still has to prove that margin expansion is durable. The forward EPS of 1.6 is reasonable versus peers on an absolute basis, yet it looks less compelling on a leverage-adjusted basis because DraftKings is carrying a much heavier balance sheet than the cleaner cash generators.
Market cap is 13B and enterprise value is 13.9B, while cash per share is 2.0 and book value per share is 1.2. I would not call that expensive, but I also would not call it a bargain until the earnings base catches up with the revenue scale.
Leverage
DKNG — Leverage & Coverage (Quarterly)
| Metric | Value |
|---|---|
| Total Debt/Equity % (mrq) | 336.5 |
| Current Ratio (mrq) | 1 |
| Total Debt (mrq, USD Mil) | 1,916 |
| Operating Cash Flow (TTM, USD Mil) | 671 |
| Levered Free Cash Flow (TTM, USD Mil) | 461.7 |
| Net Debt/EBITDA (TTM) | 7.6 |
| FCF Margin % (TTM) | 7.4% |
Source: Yahoo Finance — Quarterly Financial Statements
Total debt/equity was 336.5% mrq, current ratio was 1.0x, total debt was $1.9B, operating cash flow was $671M TTM, levered free cash flow was $461.7M TTM, net debt/EBITDA was 7.6x, and FCF margin was 7.4% TTM. That mix says DraftKings has enough liquidity to keep operating, but not enough balance-sheet slack to absorb a prolonged earnings setback without pressure on refinancing or capital allocation.
The 1.0x current ratio gives only a thin near-term cushion, while 7.6x net debt/EBITDA leaves the company exposed if EBITDA weakens or if debt needs to be refinanced at a higher rate. Cash conversion is positive, with $671M of operating cash flow and $461.7M of free cash flow over the last twelve months, but the 7.4% FCF margin shows that cash generation is still modest relative to revenue. In my opinion, this is a bear signal because leverage is elevated, free cash flow is thin, and financial flexibility is constrained.
Insider Activity
The insider transaction record I see here is dominated by selling: 57 open-market sales totaling $196.4M versus 1 open-market purchase totaling $2.2M over 119 Form 4 filings from 2025-01-01 to 2026-06-01. The activity is broad rather than concentrated, with multiple insiders transacting and no offsetting buying pattern, so alignment looks weak at the margin.
That does not change the operating thesis by itself, but it does tell me management and insiders are not signaling strong conviction at current levels. I treat that as a modest bear signal rather than a standalone reason to sell.
Comparable Analysis
Growth
| Company | Revenue TTM (USD Mil) | Revenue Growth YoY % | Diluted EPS TTM |
|---|---|---|---|
| DKNG | 6,222.5 | -4.6% | -0.3 |
| GENI | 790.2 | 64.7% | -0.7 |
| SRAD | 1,385.3 | 18.9% | 0.1 |
| FLUT | 17,161 | 3.3% | -4.3 |
| PENN | 7,159.9 | 5.2% | -6.2 |
| RSI | 1,366.9 | 46.3% | 0.3 |
Source: Yahoo Finance
DraftKings is the only name in this group with a TTM revenue decline, down 4.6%, while GENI grew 64.7%, SRAD 18.9%, FLUT 3.3%, PENN 5.2%, and RSI 46.3%. That gap matters because it means the market is paying for a recovery that has not shown up yet, and the stock does not deserve a growth premium until the top line stops shrinking.
Valuation
| Company | Forward P/E | EV/Revenue | EV/EBITDA | Price/Sales (TTM) | Price/Book (mrq) | Market Cap (USD Mil) | Enterprise Value (USD Mil) | Beta (5Y Monthly) | FCF Yield % (TTM) | Forward EPS | Analyst Target Price – Low | Analyst Target Price – Mean | Analyst Target Price – High | # Analyst Opinions |
|---|---|---|---|---|---|---|---|---|---|---|---|---|---|---|
| DKNG | 16.1 | 2.2 | 113.2 | 2.1 | 22.8 | 12,977 | 13,909 | 1.63 | 3.6% | 1.6 | 18 | 34.8 | 76 | 35 |
| GENI | 7.8 | 3.7 | -41.3 | 2.9 | 3.3 | 2,327 | 2,909 | 1.88 | 6.9% | 1.1 | 6 | 10.9 | 18 | 20 |
| SRAD | 24.2 | 2.8 | 7.4 | 3 | 4.5 | 4,090 | 3,864 | 1.61 | 8.5% | 0.6 | 14.1 | 18.6 | 38.2 | 21 |
| FLUT | 12.9 | 1.7 | 18.4 | 1 | 2 | 17,599 | 29,168 | 1.08 | -5.6% | 7.9 | 80 | 141 | 360 | 30 |
| PENN | 15.7 | 1.8 | 14.4 | 0.4 | 1.3 | 2,523 | 12,560 | 1.41 | -2.1% | 1.2 | 18 | 24.4 | 30 | 19 |
| RSI | 30.2 | 2 | 15.4 | 4.6 | 16 | 5,924 | 2,771 | 1.52 | 2.1% | 0.8 | 30 | 36 | 40 | 11 |
Source: Yahoo Finance
DKNG’s 2.2x EV/Revenue sits above PENN’s 1.8x and RSI’s 2.0x but below GENI’s 3.7x and SRAD’s 2.8x, while its 3.6% FCF yield trails SRAD’s 8.5% and GENI’s 6.9%. I think that is a fair-to-slightly-rich setup because DraftKings is not the fastest grower in the group, and its leverage means the market should demand a discount rather than a premium.
Forward EPS is 1.6 for DKNG versus 1.1 for GENI, 0.6 for SRAD, 7.9 for FLUT, 1.2 for PENN, and 0.8 for RSI. On a like-for-like basis, that earnings stream is not obviously superior once you factor in DraftKings’ heavier debt load, so the valuation case depends more on future margin conversion than on current earnings power. A $1 investment a year ago would be worth 0.6 in DKNG, versus 0.7 in GENI, 0.5 in SRAD, 0.4 in FLUT, 1.0 in PENN, and 1.3 in RSI, which tells me the market has not yet rewarded DraftKings for its scale.
Profitability
| Company | Operating Margin (TTM) | Net Margin (TTM) | Return on Assets (TTM) | Return on Equity (TTM) | Gross Margin (TTM) | EBITDA Margin (TTM) |
|---|---|---|---|---|---|---|
| DKNG | -4.7% | -2.7% | -2.4% | -21.1% | 76.1% | 2.0% |
| GENI | -12.4% | -23.0% | -4.6% | -25.9% | 27.5% | -8.9% |
| SRAD | 10.0% | 1.2% | 4.7% | 2.0% | 27.2% | 37.6% |
| FLUT | -3.3% | -4.4% | -0.2% | -7.9% | 42.5% | 9.2% |
| PENN | 7.9% | -12.7% | 1.7% | -37.6% | 35.2% | 12.2% |
| RSI | 11.7% | 2.3% | 12.8% | 30.3% | 35.0% | 13.1% |
Source: Yahoo Finance
DKNG’s gross margin of 76.1% is far above GENI’s 27.5%, SRAD’s 27.2%, PENN’s 35.2%, and FLUT’s 42.5%, but its EBITDA margin of 2.0% is well below SRAD’s 37.6%, PENN’s 12.2%, RSI’s 13.1%, and FLUT’s 9.2%. That combination points to a scale and opex problem rather than a cost-of-revenue problem, because DraftKings keeps most of the gross profit but still converts very little into EBITDA.
ROE of -21.1% and ROA of -2.4% are also weak versus SRAD’s 2.0% ROE and 4.7% ROA, which is the clearest proof that the platform still has to earn its cost of capital. I view that as a valuation constraint, not just a profitability issue, because the market will not pay up indefinitely for gross margin if operating margin stays negative.
Leverage
| Company | Total Debt/Equity % (mrq) | Current Ratio (mrq) | Total Debt (mrq, USD Mil) | Operating Cash Flow TTM (USD Mil) | Free Cash Flow TTM (USD Mil) | Net Debt/EBITDA (TTM) | FCF Margin % (TTM) |
|---|---|---|---|---|---|---|---|
| DKNG | 336.5 | 1 | 1,916 | 671 | 461.7 | 7.6 | 7.4% |
| GENI | 120 | 1 | 821 | -31.1 | 160.9 | -9.5 | 20.4% |
| SRAD | 7.8 | 1 | 61 | 429.3 | 347.4 | -0.4 | 25.1% |
| FLUT | 134.5 | 0.9 | 12,581 | 1,330 | -990 | 6.9 | -5.8% |
| PENN | 596.7 | 0.9 | 11,062.2 | 651.2 | -54.3 | 11.7 | -0.8% |
| RSI | 1.5 | 2.1 | 5.2 | 182.7 | 127.1 | -1.9 | 9.3% |
Source: Yahoo Finance
DKNG’s debt/equity of 336.5% and net debt/EBITDA of 7.6x are far heavier than SRAD’s 7.8% and -0.4x, GENI’s 120.0% and -9.5x, PENN’s 596.7% and 11.7x, and RSI’s 1.5% and -1.9x, while its FCF margin of 7.4% is positive but below SRAD’s 25.1% and RSI’s 9.3%. That tells me DraftKings is financing growth with more balance-sheet strain than the cleaner cash generators, so leverage is a risk rather than a competitive edge.
The leverage gap also helps explain why DraftKings does not deserve the same valuation treatment as the cleaner names. A company with 7.6x net debt/EBITDA needs stronger cash conversion to justify a premium, and DraftKings has not yet shown that combination.
Conclusion
I would put my rating as a Hold because DraftKings still has a real platform advantage, but the market is already paying for a margin expansion that has not yet become durable. Revenue of $6.1B in 2025 and gross margin of 76.1% show the product can scale, yet EBITDA margin was only 2.0% TTM and net debt/EBITDA was 7.6x TTM, so the equity still depends on better expense absorption before the valuation can look clearly cheap.
I would raise my rating more toward a Buy if DraftKings can hold EBITDA above $150M for two or three consecutive quarters, because that would show the recent profit improvement is repeatable rather than seasonal. If that happened while revenue stayed above $1.5B per quarter, the company would be converting a much larger share of sales into cash, and the current 7.4% FCF margin would likely expand enough to shorten the deleveraging path and justify a higher multiple.
I would move from Hold to Sell if EBITDA slips back toward the low double-digit level seen in the latest quarter, because that would tell me the business is still too dependent on promotional intensity and timing effects to support the current enterprise value. A second warning sign would be net debt/EBITDA staying above 7.0x while revenue growth remains negative, since that combination would mean the balance sheet is not improving fast enough to offset weak operating leverage.
Weighing both sides, I think the bear case is more likely to show up first because the company still has to prove that its newer products can lift earnings faster than compliance, marketing, and platform costs rise. The stock can work from here, but I need to see sustained EBITDA conversion before I can get more constructive than Hold.
What to Watch Next
- EBITDA above $150M for several quarters — would support a move toward Buy.
- Quarterly revenue above $1.5B — would show the top line is holding scale.
- Net debt/EBITDA below 7.0x — would signal balance-sheet risk is easing.
- FCF margin above 7.4% — would show cash conversion is improving.
- EBITDA near the low double digits again — would argue for a lower rating.
What’s your take? I rated DraftKings (DKNG) HOLD above — but the goal here is to get this right, not just to publish an opinion. What would you add to this analysis, or which risk or catalyst do you think I’m under- or over-weighting? Tell me in the comments.
Sources
- SEC 10-K Annual Report — filed 2026-02-13
- SEC 8-K Filing (2026-05-29)
- SEC 8-K Filing (2026-05-15)
- SEC 8-K Filing (2026-05-08)
- SEC 8-K Filing (2026-02-13)
- SEC Form 4 Insider Transaction (2026-06-02)
- SEC Form 4 Insider Transaction (2026-06-02)
- SEC Form 4 Insider Transaction (2026-06-02)
- SEC 10-K Annual Report — FY2026
- SEC 10-K Annual Report — FY2025
- SEC 10-K Annual Report — FY2024
- SEC 10-K Annual Report — FY2023
Data sourced from Yahoo Finance and SEC EDGAR. Not investment advice.
Leave a Comment