
| Company | Sep 25 | Oct 25 | Nov 25 | Dec 25 | Jan 26 | Feb 26 | Mar 26 | Apr 26 | May 26 | Jun 26 | Jul 26 | Aug 26 | 12-Mo |
|---|---|---|---|---|---|---|---|---|---|---|---|---|---|
| MMM | -0% | +7% | +4% | -7% | -4% | +8% | -12% | +1% | +5% | +6% | +9% | -2% | +13% |
| CAT | +14% | +21% | -0% | -1% | +15% | +13% | -5% | +26% | -2% | +22% | -23% | -2% | +92% |
| HON | -4% | +1% | -4% | +2% | +17% | +8% | -7% | -5% | +12% | -10% | +9% | -12% | +0% |
| EMR | -1% | +6% | -4% | -0% | +11% | +3% | -13% | +7% | +3% | -0% | +5% | +2% | +17% |
| ITW | -1% | -6% | +2% | -1% | +6% | +11% | -10% | -1% | -4% | +10% | +6% | -4% | +7% |
| GE | +9% | +3% | -3% | +3% | -0% | +12% | -17% | +2% | +12% | +15% | -4% | -7% | +23% |
Source: Yahoo Finance monthly adjusted close.
Quick Thesis
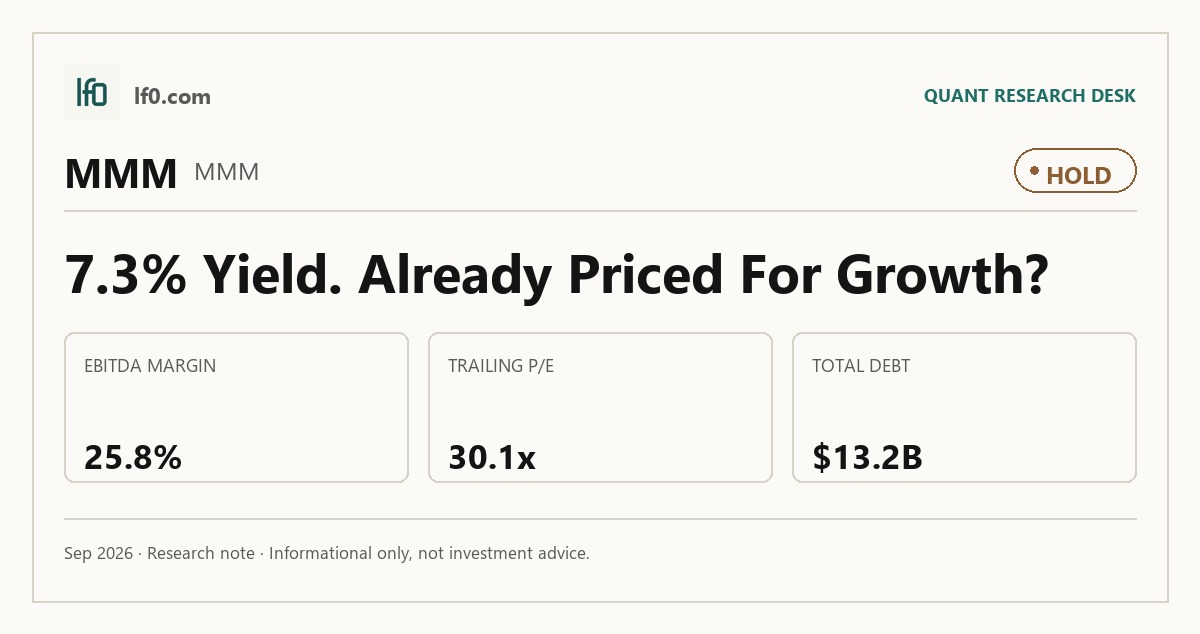
- Rated Hold because cash generation is solid, but growth is only 2.5% TTM.
- Strongest support: 7.3% TTM FCF yield and 25.8% EBITDA margin.
- Biggest risk: $13.2B of debt, alongside heavy PFAS and settlement cash demands.
- Valuation looks fair to slightly cheap at 14.7x EV/EBITDA.
- I would raise the rating if quarterly revenue stays above $6.5B and FCF holds above $6B.
Executive Summary
Rating: HOLD | MMM
We’ll begin tracking this call’s performance since publication once sufficient adjusted-close data is available.
I would put my rating as a Hold because 3M’s cash conversion is good enough to support the equity, but not strong enough to overcome slow top-line growth and a still-heavy legal cash burden. The company generated a 7.3% TTM FCF yield and a 25.8% EBITDA margin, which tells me the core industrial franchise is still producing real cash, yet 2.5% TTM revenue growth and 11.9% net margin do not justify a more aggressive call. In my view, the stock is already discounting a fair amount of that cash generation, so I do not see a clean mispricing today. I would move more toward a Buy if quarterly revenue stays above $6.5B and free cash flow remains above $6B over the next twelve months, because that would show the current yield is being backed by durable operating power rather than timing effects.
Company Profile
3M Company was incorporated in Delaware in 1929 to continue operations begun in 1902. Today it is a diversified technology company organized around three continuing segments: Safety and Industrial, Transportation and Electronics, and Consumer. Revenue comes from abrasives, adhesives and tapes, safety equipment, electronics materials, automotive and aerospace solutions, and consumer brands such as Scotch, Post-it, and Filtrete. The company sells through direct channels, wholesalers, retailers, jobbers, distributors, dealers, and e-commerce across many countries. As of December 31, 2025, it employed about 60,500 people, with 22,500 in the United States and 38,000 internationally. 3M trades on the New York Stock Exchange under MMM.
Economic Moat
Business Model
3M’s channel reach is the most defensible part of the model. Products move through direct sales, e-commerce, wholesalers, retailers, jobbers, distributors, and dealers in many countries, and management says long association with skilled marketing and sales representatives has built partner confidence that supports its marketplace position. I feel that this distribution system is hard for a well-funded competitor to replicate quickly because it is not just a list of outlets; it is a global commercial network tied to decades of customer relationships, and 3M is still using its commercial excellence initiative to strengthen and optimize that go-to-market channel. A secondary support is the patent and trademark base, since the company owns or licenses numerous U.S. and foreign patents and says those trademarks, patents, and trade secrets are an important competitive advantage, especially for new product introductions. That said, no single patent or group of related patents is essential to the company as a whole, so the real edge is the combination of channel access, product development, and manufacturing know-how rather than one protected asset.
The post-Health Care portfolio is narrower than the pre-spin structure, but I think that simplification helps the moat more than it hurts it. In 2021 the company operated four segments, including Health Care, and the April 1, 2024 separation left three continuing segments today. That makes the business more focused on industrial, electronics, and consumer end markets, which should make execution easier if management can keep translating the channel network into share.
Business & Operating Risks
The most material disclosed risk is PFAS, because 3M has already committed to pay $10.5B to $12.5B from 2024 through 2036 under the public water supplier settlement, and the company ended PFAS manufacturing at the end of 2025. PFOA and PFOS were designated hazardous substances in 2024, which can force additional investigation and remediation under CERCLA, so this is not a theoretical exposure. The mechanism is straightforward: remediation, litigation, product substitution, and possible restrictions on PFAS-containing products can hit cash flow, raise compliance cost, and disrupt supply chains. I view this as a live drag on the equity, not a distant legal overhang.
Trade and geopolitical exposure is the next major risk, because 3M derived approximately 56.0% of 2025 revenue from outside the United States and the filing flags tariffs, retaliatory countermeasures, U.S.-China trade tension, export controls, sanctions, and currency volatility. The damage mechanism is broad but concrete: higher production costs, limited access to end markets, supply chain disruption, and lower profitability if tariffs or trade restrictions force pricing changes or sourcing shifts. Operational execution is also a real risk because 3M is in the middle of a worldwide enterprise resource planning (ERP) system rollout and ongoing restructuring, and those changes could reduce sales, hurt employee relationships, and slow productivity gains. The Aearo Combat Arms Earplug Settlement adds another large, specific liability, with 3M committed to contribute $6.0B between 2023 and 2029. Taken together, these risks do threaten the moat, but they do so mainly through cash drain and execution friction rather than by breaking the channel network itself.
Management Discussion & Analysis
Management is still pushing growth investment and shareholder returns, but it is doing so against a meaningful legal and refinancing burden. 3M invested $0.9B in property, plant and equipment in 2025 and expects about $1.1B of capital spending in 2026, which tells me it is still funding productivity and sustainability projects rather than simply harvesting cash. The company also authorized a new $7.5B repurchase program in February 2025 and bought back $3.3B of stock in 2025, while raising the first-quarter 2026 dividend to $0.78 per share, up 7 percent. That is a confident capital-allocation posture, but it is not a clean deleveraging story because the company also faces $3.4B of PFAS-related and CAE settlement payments in 2025 and $1.5B of debt due in 2026.
The balance sheet is workable, not pristine. 3M ended 2025 with $5.9B of cash, cash equivalents and marketable securities, plus an undrawn $4.25B revolving credit facility that expires in May 2028, yet it also has $1.5B of long-term debt maturing in 2026. I read that as manageable refinancing risk rather than distress. Management’s tone is more credible than in the worst years because the numbers do show progress: 2025 adjusted operating margin reached 23.4%, and the company delivered 0.9% organic sales growth. Still, the filing shows litigation, PFAS exit costs, and Solventum-related dis-synergies remain a large drag, so the operating improvement is real but incomplete.
Recent Events
The April 30, 2026 credit agreement for a $1.43B term loan and a $200M revolving credit facility to fund the Madison Safety & Flow Holdings LLC acquisition is the most important recent event. It strengthens 3M’s fire safety platform, but it also adds a 364-day financing layer and a 3.0x EBITDA-to-interest covenant, so the deal improves portfolio breadth while testing balance-sheet flexibility. I see that as consistent with the moat thesis: management is still willing to buy into categories where 3M’s channels and industrial relationships matter, but it is doing so with more leverage discipline than in the past.
The board changes are also constructive. On February 3, 2026, 3M added Neil G. Mitchill, Jr., the chief financial officer of RTX Corporation, and on June 5, 2026 it added Jennifer W. Rumsey, the chair and chief executive officer of Cummins Inc. Both appointments bring industrial and financial discipline to the board, which should support oversight as 3M pushes through the acquisition and debt structure. The April 21, 2026 first-quarter earnings release and the May 12, 2026 annual meeting were routine, so they do not change the thesis by themselves.
Financial Analysis
Growth
MMM — Financial Growth (Quarterly, USD Mil)
| Metric | 2025-06-30 | 2025-09-30 | 2025-12-31 | 2026-03-31 | 2026-06-30 |
|---|---|---|---|---|---|
| REVENUE (USD Mil) | 6,344 | 6,517 | 6,133 | 6,030 | 6,500 |
| EBIT (USD Mil) | 1,160 | 1,379 | 980 | 1,092 | 1,322 |
| EBITDA (USD Mil) | 1,450 | 1,677 | 1,410 | 1,418 | 1,657 |
| NET INCOME (USD Mil) | 723 | 834 | 577 | 653 | 933 |
| DILUTED EPS | 1.3 | 1.6 | 1.1 | 1.2 | 1.8 |
Source: Yahoo Finance — Quarterly Financial Statements
3M’s revenue was $6.3B in Q2 2025, $6.5B in Q3 2025, $6.1B in Q4 2025, $6B in Q1 2026, and $6.5B in Q2 2026. That is a flat-to-slightly-up top line, with Q2 2026 revenue up 2.5% year over year from $6.3B in Q2 2025. EBITDA grew faster than revenue in Q2 2026, rising to $1.7B from $1.5B a year earlier, and net income rose to $933M from $723M. The Q4 2025 dip to $6.1B looks like a quarter-specific swing rather than a trend break, so I read the growth profile as steady but not yet strong enough to justify a premium multiple on its own.
Profitability
MMM — Profitability (TTM)
| Metric | TTM |
|---|---|
| Operating Margin (TTM) | 20.4% |
| Net Margin (TTM) | 11.9% |
| Return on Assets (TTM) | 8.7% |
| Return on Equity (TTM) | 81.9% |
| Gross Margin (TTM) | 39.4% |
| EBITDA Margin (TTM) | 25.8% |
Source: Yahoo Finance — Trailing Twelve Months (TTM)
TTM gross margin of 39.4% and EBITDA margin of 25.8% show 3M still has solid product economics, but the 13.6-point gap to TTM operating margin of 20.4% and the 13.9-point gap to TTM net margin of 11.9% tell me overhead, restructuring, and below-the-line items still absorb a large share of profit. That is a mature industrial profile, not an early-stage one, because the business is already converting more than one-third of sales into gross profit and more than one-quarter into EBITDA. TTM ROA of 8.7% versus TTM ROE of 81.9% implies returns are being amplified by leverage and a thin equity base rather than pure asset productivity, so I would not read the ROE as a clean sign of operating superiority. The key watch item is whether operating margin can hold near 20% while net margin closes the gap toward the low teens, which would show cleaner earnings quality and better support the moat thesis above.
Valuation
MMM — Valuation Multiples
| Metric | Value |
|---|---|
| Current Share Price (USD) | 169.5 |
| Market Cap (USD Mil) | 87,405 |
| Enterprise Value (USD Mil) | 95,315 |
| Trailing P/E | 30.1 |
| Forward P/E | 17.3 |
| Price/Sales (TTM) | 3.5 |
| Price/Book (mrq) | 29.6 |
| EV/Revenue | 3.8 |
| EV/EBITDA | 14.7 |
| Beta (5Y Monthly) | 1.07 |
| FCF Yield % (TTM) | 7.3% |
| Forward EPS (USD) | 9.8 |
| Analyst Target Price – Low (USD) | 120 |
| Analyst Target Price – Mean (USD) | 187.7 |
| Analyst Target Price – High (USD) | 219 |
| # Analyst Opinions | 18 |
Source: Yahoo Finance
3M trades at 3.8x EV/Revenue and 14.7x EV/EBITDA, with a 3.5x price/sales ratio and 30.1x trailing P/E. At the current share price of $169.5, the market is paying for a business that can keep converting roughly $25.2B of annual sales into a 25.8% EBITDA margin and sustain that earnings base, while the 17.3x forward P/E and 1.6x five-year expected PEG ratio imply investors are underwriting moderate growth rather than a sharp rerating. The 7.3% FCF yield is the cleanest value signal here, because it says the stock is not priced as a deep bargain but does offer solid cash return support at today’s price. The 29.6x price/book is less useful on its own because 3M’s book value per share is only $5.72, so the equity is being valued far above accounting capital.
On the analysis here, I would put fair value in a range of about $160-$190 per share. That sits inside the analyst target range of $120 to $219 and slightly below the $187.7 mean, which makes sense to me because I weight the legal cash burden and slower growth more heavily than the consensus appears to. The implied earnings path is roughly $9.5-$10.0 of EPS over the next year, which is close to the company’s $9.8 forward EPS and looks reasonable against peers that trade at richer multiples for faster growth, such as CAT and GE. In other words, the market is not ignoring 3M’s cash generation, but it is also not paying a growth premium for it.
Leverage
MMM — Leverage & Coverage (Quarterly)
| Metric | Value |
|---|---|
| Total Debt/Equity % (mrq) | 437.9 |
| Current Ratio (mrq) | 1.2 |
| Total Debt (mrq, USD Mil) | 13,160 |
| Operating Cash Flow (TTM, USD Mil) | 4,899 |
| Levered Free Cash Flow (TTM, USD Mil) | 6,350.1 |
| Net Debt/EBITDA (TTM) | 1.2 |
| FCF Margin % (TTM) | 25.2% |
Source: Yahoo Finance — Quarterly Financial Statements
3M’s leverage is manageable, but it is not a balance-sheet advantage. Total debt/equity was 437.9% mrq, current ratio was 1.2x, and total debt was $13.2B mrq, so the company is carrying a large debt load even though near-term liquidity is still adequate. Operating cash flow was $4.9B TTM, levered free cash flow was $6.4B TTM, net debt/EBITDA was 1.2x, and FCF margin was 25.2% TTM. That mix says EBITDA is converting into cash well, which gives 3M room to absorb a downturn and keep refinancing risk contained for now. The leverage profile does not threaten the moat directly, but it does limit how much of the cash engine can be turned into faster growth or a higher valuation multiple.
Insider Activity
The insider transaction record I see here is clearly net selling, with 77 open-market sales versus 4 purchases over the 2024-05-01 to 2026-05-12 window. The activity is concentrated in a few insiders, especially Theresa E. Reinseth and Zoe L. Dickson, rather than broad-based buying, which points to weak insider alignment at the margin. I would treat that as a mild caution flag rather than a thesis breaker, because the sales do not by themselves outweigh the company’s cash generation.
Comparable Analysis
LF0 has published standalone analyses of these peers: Honeywell (HON) (rated Hold); Emerson (EMR) (rated Hold); General Electric (GE) (rated Hold).
Growth
| Company | Revenue TTM (USD Mil) | Revenue Growth YoY % | EBITDA TTM (USD Mil) | Diluted EPS TTM |
|---|---|---|---|---|
| MMM | 25,180 | 2.5% | 6,488 | 5.6 |
| CAT | 74,729 | 24.0% | 16,251 | 23.2 |
| HON | 38,057 | 4.3% | 8,512 | 25.9 |
| EMR | 18,636 | 7.0% | 6,058 | 4.6 |
| ITW | 16,469 | 6.1% | 4,806 | 11 |
| GE | 50,639 | 21.1% | 11,483 | 8.5 |
Source: Yahoo Finance
3M’s revenue growth of 2.5% TTM trails CAT at 24.0%, GE at 21.1%, EMR at 7.0%, ITW at 6.1%, and HON at 4.3%, so MMM is the slowest grower in the group. Quarterly earnings growth of 32.8% is better than ITW and EMR, but it still sits below CAT and does not yet support a growth premium. That gap matters because 3M’s valuation is being asked to do more work than its top line does.
Valuation
| Company | Current Share Price (USD) | Trailing P/E | Forward P/E | EV/Revenue | EV/EBITDA | Price/Sales (TTM) | Price/Book (mrq) | Market Cap (USD Mil) | Enterprise Value (USD Mil) | Beta (5Y Monthly) | FCF Yield % (TTM) | Forward EPS | Analyst Target Price – Low | Analyst Target Price – Mean | Analyst Target Price – High | # Analyst Opinions |
|---|---|---|---|---|---|---|---|---|---|---|---|---|---|---|---|---|
| MMM | 169.5 | 30.1 | 17.3 | 3.8 | 14.7 | 3.5 | 29.6 | 87,405 | 95,315 | 1.07 | 7.3% | 9.8 | 120 | 187.7 | 219 | 18 |
| CAT | 820 | 35.3 | 25.3 | 5.6 | 25.6 | 5 | 19.4 | 376,910 | 416,110 | 1.59 | 1.3% | 32.4 | 575 | 975.6 | 1,225 | 26 |
| HON | 211.5 | 8.2 | 21.4 | 2.4 | 10.9 | 1.8 | 3.6 | 67,039 | 93,118 | 0.90 | 3.9% | 9.9 | 186 | 261.7 | 303 | 23 |
| EMR | 159.4 | 34.6 | 22 | 5.4 | 16.6 | 4.8 | 4.4 | 88,908 | 100,545 | 1.23 | 4.2% | 7.3 | 104 | 173.5 | 205 | 28 |
| ITW | 273.8 | 24.9 | 22.1 | 5.3 | 18.1 | 4.7 | 26.9 | 77,987 | 86,843 | 1 | 3.1% | 12.4 | 249 | 302.5 | 350 | 14 |
| GE | 318.2 | 37.6 | 35.1 | 6.7 | 29.7 | 6.5 | 18.7 | 330,194 | 340,706 | 1.35 | 2.0% | 9.1 | 347 | 397.3 | 450 | 21 |
Source: Yahoo Finance
3M’s 7.3% FCF yield is the cleanest anchor here because it converts cash better than most peers. That yield is above CAT at 1.3%, HON at 3.9%, EMR at 4.2%, ITW at 3.1%, and GE at 2.0%, so MMM screens cheaper on cash generation even though its 30.1x trailing P/E and 3.5x price/sales are richer than HON and still demanding versus the group. On a growth-adjusted basis, the stock looks more fairly priced than expensive because the market is paying for cash conversion, not for a growth surge that is not yet visible.
Profitability
| Company | Operating Margin (TTM) | Net Margin (TTM) | Return on Assets (TTM) | Return on Equity (TTM) | Gross Margin (TTM) | EBITDA Margin (TTM) |
|---|---|---|---|---|---|---|
| MMM | 20.4% | 11.9% | 8.7% | 81.9% | 39.4% | 25.8% |
| CAT | 22.2% | 14.5% | 9.0% | 57.0% | 29.7% | 21.8% |
| HON | 20.2% | 21.6% | 5.7% | 46.6% | 36.5% | 22.4% |
| EMR | 26.9% | 13.8% | 6.9% | 12.8% | 53.2% | 32.5% |
| ITW | 26.9% | 19.4% | 16.9% | 104.6% | 44.2% | 29.2% |
| GE | 20.6% | 17.7% | 5.1% | 48.2% | 31.1% | 22.7% |
Source: Yahoo Finance
MMM’s gross margin of 39.4% tops CAT at 29.7% and GE at 31.1%, while its EBITDA margin of 25.8% beats CAT at 21.8%, HON at 22.4%, and GE at 22.7%. The operating margin of 20.4% is also competitive, which points to a business with solid pricing and cost control rather than a pure scale story. Net margin of 11.9% is below HON at 21.6% and ITW at 19.4%, so the gap looks more like financing and below-the-line drag than a weak operating model.
Leverage
| Company | Total Debt/Equity % (mrq) | Current Ratio (mrq) | Total Debt (mrq, USD Mil) | Operating Cash Flow TTM (USD Mil) | Free Cash Flow TTM (USD Mil) | Net Debt/EBITDA (TTM) | FCF Margin % (TTM) |
|---|---|---|---|---|---|---|---|
| MMM | 437.9 | 1.2 | 13,160 | 4,899 | 6,350.1 | 1.2 | 25.2% |
| CAT | 232.8 | 1.4 | 45,146 | 13,569 | 5,049 | 2.4 | 6.8% |
| HON | 185.4 | 1.2 | 34,955 | 5,118 | 2,610.4 | 3 | 6.9% |
| EMR | 67.7 | 0.9 | 13,802 | 3,912 | 3,706.2 | 1.9 | 19.9% |
| ITW | 334.9 | 1.1 | 9,694 | 3,330 | 2,433 | 1.8 | 14.8% |
| GE | 113.2 | 1 | 20,230 | 9,800 | 6,594.6 | 0.9 | 13.0% |
Source: Yahoo Finance
MMM’s total debt/equity of 437.9% is far above CAT at 232.8%, HON at 185.4%, EMR at 67.7%, ITW at 334.9%, and GE at 113.2%, yet net debt/EBITDA of 1.2x is actually better than CAT at 2.4x and HON at 3.0x because MMM holds $5.3B of cash and generates $6.4B of FCF TTM, equal to a 25.2% FCF margin. That combination explains part of the valuation gap: peers such as CAT and HON trade on different leverage and growth expectations, while MMM is priced more as a cash compounder with legal overhang than as a pure growth name. The balance sheet is therefore a financing choice, not a distress signal, but it still caps how much rerating the market is likely to grant without better growth.
Conclusion
The key tension is simple: 3M’s cash engine is strong enough to support the stock, but the legal burden and slow growth keep that strength from translating into a cleaner rerating. I would put my rating as a Hold because the company is already producing a 7.3% FCF yield and a 25.8% EBITDA margin, yet 2.5% TTM revenue growth and the ongoing PFAS and settlement cash burden stop me from calling the shares cheap enough for a Buy. The leverage profile is manageable at 1.2x net debt/EBITDA, so I do not see balance-sheet stress as the base case; instead, I see a business that can fund itself, but not one that is obviously underpriced.
I would raise my rating more toward a Buy if quarterly revenue stays above $6.5B and free cash flow remains above $6B over the next twelve months, because that would show the current cash yield is being backed by durable operating power rather than timing effects. I would also want to see operating margin hold near 20% while the company keeps using buybacks without letting leverage drift higher, since that would tell me the cash is being compounded rather than merely distributed. On the downside, I would move from Hold to Sell if free cash flow falls below $5B over the next twelve months, because that would mean the current yield is being flattered by temporary working-capital or litigation timing rather than durable earnings power. I would also turn more cautious if revenue slips back below $6B in a quarter and EBITDA margin drops under 24%, since that would show the operating leverage is weaker than the current valuation assumes.
Weighing both sides, I think the cash generation case is more likely to hold than the downside case is to break immediately, but not by enough to justify paying up today. The stock looks investable, not mispriced enough to be aggressive, so I would wait for either a clearer growth inflection or a cheaper entry point before moving off Hold.
What to Watch Next
- Quarterly revenue above $6.5B — would support a move toward Buy.
- Free cash flow above $6B over the next twelve months — would confirm the cash yield is durable.
- EBITDA margin holding near 25% — would show the core operating engine is intact.
- Revenue below $6B in a quarter — would raise concern that growth is stalling again.
- Free cash flow below $5B — would argue the current valuation is too generous.
What’s your take? I rated 3M (MMM) HOLD above — but the goal here is to get this right, not just to publish an opinion. What would you add to this analysis, or which risk or catalyst do you think I’m under- or over-weighting? Tell me in the comments.
Sources
- SEC 10-K Annual Report — filed 2026-02-03
- SEC 8-K Filing (2026-06-08)
- SEC 8-K Filing (2026-05-13)
- SEC 8-K Filing (2026-05-06)
- SEC 8-K Filing (2026-04-21)
- SEC 8-K Filing (2026-02-05)
- SEC 8-K Filing (2026-01-20)
- SEC Form 4 Insider Transaction (2026-05-13)
- SEC Form 4 Insider Transaction (2026-05-13)
- SEC Form 4 Insider Transaction (2026-05-13)
- SEC 10-K Annual Report — FY2026
- SEC 10-K Annual Report — FY2025
- SEC 10-K Annual Report — FY2024
- SEC 10-K Annual Report — FY2023
- SEC 10-K Annual Report — FY2022
Data sourced from Yahoo Finance and SEC EDGAR. Not investment advice.
Leave a Comment