
| Company | Jul 25 | Aug 25 | Sep 25 | Oct 25 | Nov 25 | Dec 25 | Jan 26 | Feb 26 | Mar 26 | Apr 26 | May 26 | Jun 26 | 12-Mo |
|---|---|---|---|---|---|---|---|---|---|---|---|---|---|
| EMR | +9% | -9% | -1% | +6% | -4% | -0% | +11% | +3% | -13% | +7% | +3% | -0% | +9% |
| ROK | +6% | -2% | +2% | +5% | +8% | -2% | +8% | -3% | -12% | +14% | +11% | +10% | +51% |
| VRT | +13% | -12% | +18% | +28% | -7% | -10% | +15% | +37% | -2% | +31% | -4% | +6% | +161% |
| HON | -5% | -1% | -4% | +1% | -4% | +2% | +17% | +8% | -7% | -5% | +12% | -10% | -1% |
| ETN | +8% | -9% | +7% | +2% | -9% | -8% | +10% | +7% | -5% | +21% | -7% | +6% | +21% |
| IR | +2% | -6% | +4% | -8% | +5% | -1% | +9% | +9% | -15% | -0% | -10% | +14% | -1% |
Source: Yahoo Finance monthly adjusted close.
Executive Summary
Rating: HOLD | EMR
Measured from adjusted close on 2026-07-30 to 2026-09-14. Sell ratings are correct when the stock falls; Hold is tracked as a +/-10% range. Daily-close data, not intraday. Calls are tracked for 182 days from publication, then frozen as a final record.
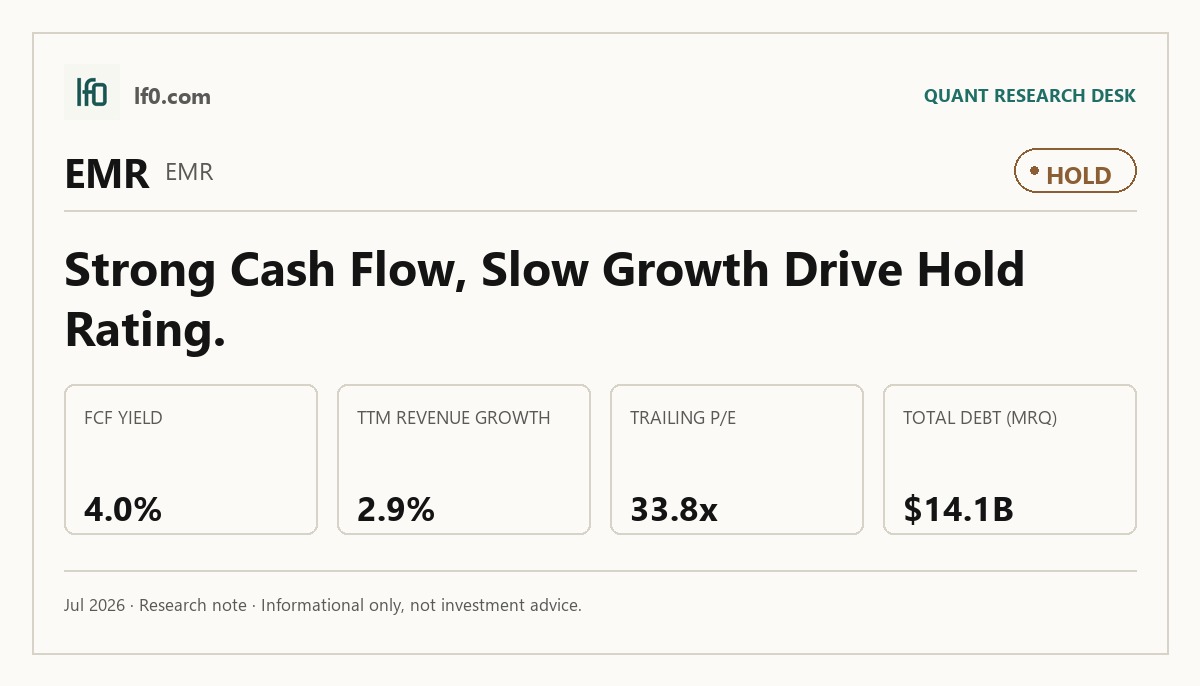
I would put my rating as a Hold because Emerson’s software-heavy portfolio is improving the quality of the business, but the stock already discounts a lot of that progress while growth remains only modest. The clearest strength is the move toward a more defensible automation and test-and-measurement stack, which I feel is harder to displace than the company’s older hardware mix. The main risk is that 2.9% TTM revenue growth is not fast enough to make the current multiple look obviously cheap, especially with 2.1x net debt to EBITDA still on the balance sheet. I would raise my rating more towards a Buy if full-year revenue growth moves above 5.0%, meaning the portfolio shift is finally translating into faster compounding rather than just better mix.
Company Profile
Emerson Electric Co. is a global technology and software company that sells automation hardware, control systems, and industrial software to process, hybrid, and discrete manufacturers. It earns revenue through direct sales and a network of independent representatives and distributors, with products spanning valves, instrumentation, control systems, test and measurement, and asset optimization software. The company was incorporated in Missouri in 1890 and is listed on the New York Stock Exchange under EMR.
Emerson operates globally, with 2024 sales by destination of 50% in the Americas, 30% in Asia, Middle East & Africa, and 20% in Europe. It had about 73,000 employees at September 30, 2024 and reported $8.4B of backlog at that date, with about 75% expected to convert to revenue over the next 12 months. The current structure centers on seven segments across two business groups, which reflects a portfolio that is now more industrial and software oriented than it was a few years ago.
Economic Moat
Business Model
The National Instruments acquisition gave Emerson a test-and-measurement platform that I think is the hardest asset for a well-funded rival to replicate quickly, because it combines modular instrumentation, data acquisition, and development software with embedded customer workflows. That matters because Emerson is no longer just a broad industrial supplier; it now has a more cohesive automation stack that links field devices, control systems, optimization software, and test equipment across process, hybrid, and discrete end markets. AspenTech deepens the software layer, while the direct sales force and intellectual property portfolio support the edge rather than define it. Emerson also runs a 24x7x365 global incident response operation and ISO 27001 audited data centers, which makes cyber resilience part of the product value proposition.
The moat is stronger than it was in the older portfolio because the mix is more software rich and less exposed to lower-growth consumer categories. In my view, that is a real structural improvement, not just a cosmetic reshuffle.
Business & Operating Risks
According to the risk factors in Emerson’s SEC 10-K, the company competes in highly competitive and potentially volatile markets against rivals with greater scale and financial resources, so pricing pressure can show up quickly when industrial demand softens. The filing also flags technology-transition risk around artificial intelligence, electrification, decarbonization, battery storage, hydrogen, carbon capture, and advanced nuclear power, which means Emerson has to keep innovating while defending its installed base. Supply chain, cyber, and global production risks remain material as well, given the company’s reliance on metals, electronics, and a globally distributed manufacturing footprint.
The disclosed risks do not directly threaten the test-and-measurement moat, but they do test Emerson’s ability to keep that software advantage relevant while the rest of the portfolio is still being reshaped.
Management Discussion & Analysis
Management is actively responding to the risks above through portfolio simplification and capital allocation, but the AspenTech transaction remains unresolved as of the filing date. Emerson has proposed to buy the remaining AspenTech shares for 240 per share in cash and is also exploring strategic alternatives for Safety & Productivity, so the company is still pruning the portfolio rather than settling into a steady-state structure.
The fiscal 2025 outlook calls for net sales up 3.5% to 5.5%, underlying sales up 3.0% to 5.0%, adjusted diluted EPS of $5.85 to $6.05, operating cash flow of $3.6B to $3.7B, and free cash flow of $3.2B to $3.3B. That guidance, together with planned share repurchases of about $2B and dividends of about $1.2B, tells me management is prioritizing cash returns and strategic reshaping over rapid deleveraging. The 2024 results support that stance: underlying sales rose 6.0% and adjusted diluted EPS from continuing operations rose to $5.49 from $4.44 in 2023, even though reported diluted EPS from continuing operations fell to $2.82 because acquisition accounting and the Copeland note loss weighed on GAAP results.
Recent Events
The most important recent development is Emerson’s November 5, 2024 proposal to buy the AspenTech shares it does not already own for $240 per share in cash. Because the offer depends on approval by an independent special committee and a majority of minority tender, it is not a done deal, but it would strengthen the software and automation stack if completed.
On the same date, Emerson disclosed that it is exploring strategic alternatives, including a cash sale, for Safety & Productivity. That points to a portfolio that is still being actively reworked, not merely managed. The June 6, 2024 transaction agreements to sell Emerson’s 40% Copeland stake for $1.5B and receive $1.9B from note repurchases reinforce the same message: capital is being recycled out of non-core assets and toward higher-conviction areas.
The May 7, 2024 board election of Calvin G. Butler, Jr., effective August 1, 2024, is a smaller but constructive governance signal because it adds utility-sector operating experience at a time when Emerson is making major portfolio decisions.
Financial Analysis
Growth
EMR — Financial Growth (Quarterly, USD Mil)
| Metric | 2025-03-31 | 2025-06-30 | 2025-09-30 | 2025-12-31 | 2026-03-31 |
|---|---|---|---|---|---|
| REVENUE (USD Mil) | 4,432 | 4,553 | 4,855 | 4,346 | 4,562 |
| EBIT (USD Mil) | 715 | 829 | 1,038 | 891 | 903 |
| EBITDA (USD Mil) | 1,099 | 1,201 | 1,417 | 1,250 | 1,272 |
| NET INCOME (USD Mil) | 485 | 586 | 636 | 605 | 618 |
| DILUTED EPS | 0.9 | 1 | 1.1 | 1.1 | 1.1 |
Source: Yahoo Finance — Quarterly Financial Statements
Revenue rose from $4.4B in Q1 2025 to $4.6B in Q1 2026, a 2.9% increase, after a stronger Q3 2025 and a softer Q4 2025. EBITDA moved from $1.1B to $1.3B over the same span, while net income increased from $485M to $618M, so earnings are growing faster than the top line. I read that as a sign that the portfolio mix is helping margins more than it is accelerating demand, which fits a business that is still in transition rather than in a clean growth phase.
Profitability
EMR — Profitability (TTM)
| Metric | TTM |
|---|---|
| Operating Margin (TTM) | 24.2% |
| Net Margin (TTM) | 13.4% |
| Return on Assets (TTM) | 6.7% |
| Return on Equity (TTM) | 12.3% |
| Gross Margin (TTM) | 52.7% |
| EBITDA Margin (TTM) | 32.1% |
Source: Yahoo Finance — Trailing Twelve Months (TTM)
TTM gross margin of 52.7% and EBITDA margin of 32.1% show Emerson still keeps more than half of revenue after direct costs, while operating margin of 24.2% indicates the company is converting that gross profit into solid operating earnings. Net margin of 13.4% is lower than operating margin, so below-the-line items still take a meaningful cut, but return on assets of 6.68% and return on equity of 12.3% show respectable capital efficiency. The margin profile is consistent with the software and automation moat described above: the business is not just growing, it is retaining a healthy share of each dollar of revenue.
Valuation
EMR — Valuation Multiples
| Metric | Value |
|---|---|
| Market Cap (USD Mil) | 81,623 |
| Enterprise Value (USD Mil) | 93,905 |
| Trailing P/E | 33.8 |
| Forward P/E | 20.3 |
| Price/Sales (TTM) | 4.5 |
| Price/Book (mrq) | 4 |
| EV/Revenue | 5.1 |
| EV/EBITDA | 16 |
| Beta (5Y Monthly) | 1.24 |
| FCF Yield % (TTM) | 4.0% |
| Forward EPS (USD) | 7.2 |
| Analyst Target Price – Low (USD) | 104 |
| Analyst Target Price – Mean (USD) | 163.5 |
| Analyst Target Price – High (USD) | 203 |
| # Analyst Opinions | 27 |
Source: Yahoo Finance
Emerson trades at 33.8x trailing P/E, 20.3x forward P/E, 5.1x EV/Revenue, and 16.0x EV/EBITDA, with a 4.0% TTM FCF yield and a 4.0x price/book multiple. On the analysis here, I would put fair value in a range of about $145-$175 per share, which sits around the analyst consensus mean of $163.5 and inside the $104 to $203 low-high range across 27 analyst opinions. That range is not a guarantee; it simply reflects a business with solid cash conversion, moderate leverage, and growth that is good but not fast enough to justify a much richer multiple.
Forward EPS is $7.17, and I would frame a reasonable earnings range around $6.9-$7.5 depending on how much of the backlog converts and how quickly the software mix lifts margins. That sits close to the company’s own forward EPS and is broadly in line with peers on an absolute basis, but Emerson looks less compelling than the faster growers when you compare earnings power against valuation. In other words, the market is paying for stability and cash generation, not for a breakout in EPS growth.
Leverage
EMR — Leverage & Coverage (Quarterly)
| Metric | Value |
|---|---|
| Total Debt/Equity % (mrq) | 69.2 |
| Current Ratio (mrq) | 0.9 |
| Total Debt (mrq, USD Mil) | 14,057 |
| Operating Cash Flow (TTM, USD Mil) | 3,558 |
| Levered Free Cash Flow (TTM, USD Mil) | 3,272.2 |
| Net Debt/EBITDA (TTM) | 2.1 |
| FCF Margin % (TTM) | 17.9% |
Source: Yahoo Finance — Quarterly Financial Statements
Total debt was $14.1B, total debt/equity was 69.2%, and the current ratio was 0.9x, so liquidity is not abundant. Operating cash flow was $3.6B TTM and levered free cash flow was $3.3B TTM, which gives Emerson room to service debt and still return capital. Net debt/EBITDA of 2.1x and FCF margin of 17.9% tell me the balance sheet is manageable, but not a source of upside on its own. The leverage profile supports the thesis because cash generation is strong enough to absorb the capital plan, yet it does not create the kind of balance-sheet flexibility that would make the stock stand out.
Insider Activity
The insider transaction record is one-sided: 11 open-market sales and 0 open-market purchases from 2025-01-02 to 2026-06-01. The selling is broad, with activity from the CEO, an executive vice president, a senior vice president, and multiple directors. I take that as a caution flag rather than a thesis breaker, because it suggests insiders are not leaning in at the current price.
Comparable Analysis
Growth
| Company | Revenue TTM (USD Mil) | Revenue Growth YoY % | EBITDA TTM (USD Mil) | Diluted EPS TTM |
|---|---|---|---|---|
| EMR | 18,316 | 2.9% | 5,875 | 4.3 |
| ROK | 8,804 | 11.9% | 1,969 | 9.7 |
| VRT | 11,479.6 | 24.1% | 2,616.8 | 4.4 |
| HON | 38,057 | 4.3% | 8,512 | 26 |
| ETN | 28,522 | 16.8% | 6,343 | 10.2 |
| IR | 7,781.3 | 7.6% | 2,021.8 | 1.5 |
Source: Yahoo Finance
Emerson’s revenue grew 2.9% TTM on $18.3B of revenue, while IR grew 7.6%, HON 4.3%, ROK 11.9%, ETN 16.8%, and VRT 24.1%. Emerson is the slowest grower in the group, which is why the stock needs cash conversion and margin stability to justify its multiple. The 27.9% quarterly earnings growth figure helps, but it does not fully close the gap to the faster peers.
Valuation
| Company | Trailing P/E | Forward P/E | EV/Revenue | EV/EBITDA | Price/Sales (TTM) | Price/Book (mrq) | Market Cap (USD Mil) | Enterprise Value (USD Mil) | Beta (5Y Monthly) | FCF Yield % (TTM) | Forward EPS | Analyst Target Price – Low | Analyst Target Price – Mean | Analyst Target Price – High | # Analyst Opinions |
|---|---|---|---|---|---|---|---|---|---|---|---|---|---|---|---|
| EMR | 33.8 | 20.3 | 5.1 | 16 | 4.5 | 4 | 81,623 | 93,905 | 1.24 | 4.0% | 7.2 | 104 | 163.5 | 203 | 27 |
| ROK | 47.6 | 31.4 | 6.2 | 27.8 | 5.8 | 14.5 | 51,118 | 54,803 | 1.54 | 1.9% | 14.6 | 282 | 474.6 | 555 | 24 |
| VRT | 50.5 | 25.1 | 7.5 | 32.9 | 7.5 | 20.2 | 85,672 | 86,002 | — | 3.2% | 8.9 | 236 | 376.2 | 500 | 26 |
| HON | 9.3 | 24.2 | 2.7 | 12 | 2 | 5.6 | 76,421 | 102,500 | 0.93 | 3.4% | 10 | 186 | 262 | 298 | 19 |
| ETN | 35.4 | 22.9 | 5.7 | 25.5 | 4.9 | 7.1 | 140,518 | 161,644 | 1.18 | 1.9% | 15.8 | 321 | 455.8 | 534 | 25 |
| IR | 57.2 | 22 | 4.7 | 18.2 | 4.3 | 3.3 | 33,111 | 36,835 | 1.17 | 3.1% | 3.9 | 80 | 93.5 | 115 | 13 |
Source: Yahoo Finance
Emerson’s 4.0% FCF yield is better than ROK’s 1.9%, ETN’s 1.9%, HON’s 3.4%, IR’s 3.1%, and VRT’s 3.2%, so the stock is not expensive on cash generation. At the same time, its 33.8x trailing P/E and 5.1x EV/Revenue are richer than HON’s 9.3x and 2.7x, and below ROK’s 47.6x and 6.2x. That spread makes sense only if Emerson’s steadier cash profile deserves a premium to the slower cash converters, but the market is not giving it a growth premium the way it does for VRT.
Profitability
| Company | Operating Margin (TTM) | Net Margin (TTM) | Return on Assets (TTM) | Return on Equity (TTM) | Gross Margin (TTM) | EBITDA Margin (TTM) |
|---|---|---|---|---|---|---|
| EMR | 24.2% | 13.4% | 6.7% | 12.3% | 52.7% | 32.1% |
| ROK | 20.7% | 12.4% | 9.3% | 27.2% | 48.9% | 22.4% |
| VRT | 19.5% | 15.1% | 10.6% | 43.9% | 38.0% | 22.8% |
| HON | 20.2% | 21.6% | 5.7% | 46.6% | 36.5% | 22.4% |
| ETN | 16.1% | 14.0% | 7.0% | 20.8% | 37.1% | 22.2% |
| IR | 17.1% | 7.5% | 5.1% | 5.7% | 43.2% | 26.0% |
Source: Yahoo Finance
Emerson’s 24.2% operating margin and 32.1% EBITDA margin are above IR’s 17.1% and 26.0%, HON’s 20.2% and 22.4%, and ROK’s 20.7% and 22.4%. Gross margin of 52.7% is also stronger than HON’s 36.5% and VRT’s 38.0%, which points to a better cost structure. Returns are less impressive: ROE of 12.3% and ROA of 6.68% trail VRT, HON, and ROK, so Emerson’s margin quality is good but not yet translating into top-tier capital efficiency.
Leverage
| Company | Total Debt/Equity % (mrq) | Current Ratio (mrq) | Total Debt (mrq, USD Mil) | Operating Cash Flow TTM (USD Mil) | Free Cash Flow TTM (USD Mil) | Net Debt/EBITDA (TTM) | FCF Margin % (TTM) |
|---|---|---|---|---|---|---|---|
| EMR | 69.2 | 0.9 | 14,057 | 3,558 | 3,272.2 | 2.1 | 17.9% |
| ROK | 113.4 | 1.1 | 4,054 | 1,535 | 974.5 | 1.8 | 11.1% |
| VRT | 68.4 | 1.4 | 3,256.2 | 3,354.2 | 2,733.5 | 0.1 | 23.8% |
| HON | 185.4 | 1.2 | 34,955 | 5,118 | 2,610.4 | 3 | 6.9% |
| ETN | 110.5 | 1.2 | 21,833 | 4,741 | 2,646.5 | 3.3 | 9.3% |
| IR | 48.4 | 2.2 | 4,951.2 | 1,299 | 1,035.4 | 1.8 | 13.3% |
Source: Yahoo Finance
Emerson’s 69.2% debt/equity and 2.1x net debt/EBITDA sit above VRT’s 0.1x net debt/EBITDA and IR’s 1.8x, while its 17.9% FCF margin is stronger than HON’s 6.9% and ETN’s 9.3%. That combination matters because it shows Emerson is using leverage to support a mature cash engine, not to fund a high-growth balance-sheet story. Compared with VRT and IR, the balance sheet is less clean, but the cash generation is strong enough that the leverage does not look threatening.
I would put my rating as a Hold because Emerson’s business quality is better than the headline growth rate suggests, but the valuation already reflects that quality. The key tension is that the company is generating solid cash and improving its mix, yet 2.9% TTM revenue growth and a 33.8x trailing P/E leave little margin for error. I would raise my rating more towards a Buy if revenue growth moves above 5.0% for a full year and adjusted diluted EPS reaches the top end of management’s $5.85 to $6.05 range, because that would show the software and automation mix is finally turning into faster earnings compounding. I would move from Hold to Sell if revenue slips below 2.0% for two consecutive quarters or if net debt to EBITDA rises above 2.5x, meaning leverage is starting to outrun cash generation. For now, the stronger cash profile and software mix keep the stock investable, but not compelling enough for a more aggressive call.
Conclusion
I would put my rating as a Hold because Emerson is already priced for steady cash generation, while the operating data still shows only modest top-line growth and a valuation that leaves limited room for disappointment. The 4.0% free cash flow yield (TTM) and 17.9% free cash flow margin (TTM) support the stock, but 2.9% revenue growth (TTM) and 2.1x net debt to EBITDA (TTM) tell me this is a solid industrial compounder, not a mispriced one.
I would raise my rating more towards a Buy if revenue growth moves above 5.0% for a full year, because that would show the software and automation mix is translating into a faster earnings base rather than just supporting margins. If adjusted diluted EPS reaches the top end of management’s FY2025 range at $6.05, roughly 3.4% above the midpoint, and free cash flow stays above $3.3B, that would imply the company is converting its backlog and software content into enough cash to justify a higher multiple. In that case, the current 20.3x forward P/E would look easier to own because the market would be paying for visible earnings acceleration, not just stability.
I would move from Hold to Sell if revenue slips back below 2.0% for two consecutive quarters or if net debt to EBITDA rises above 2.5x, because either outcome would suggest the current valuation is leaning on a growth profile that is not actually improving. A sharper warning sign would be free cash flow falling below $3.0B for FY2025, since that would mean the 17.9% margin is no longer holding and the balance sheet would have less room to absorb the AspenTech deal or a softer industrial cycle. If insider selling continues at the current pace, with the CEO and directors still net sellers, that would add to my caution rather than offset it.
Weighing both sides, I lean to the bear case on valuation timing rather than on business quality. Emerson has the better cash profile and the stronger software mix, but the slower growth versus peers means the stock needs clean execution to earn its multiple, and I do not yet see enough evidence that the next leg higher is arriving before the market has already paid for it.
What’s your take? I rated Emerson (EMR) HOLD above — but the goal here is to get this right, not just to publish an opinion. What would you add to this analysis, or which risk or catalyst do you think I’m under- or over-weighting? Tell me in the comments.
Sources
- SEC 10-K Annual Report — filed 2024-11-12
- SEC 8-K Filing (2024-11-05)
- SEC 8-K Filing (2024-11-05)
- SEC 8-K Filing (2024-08-07)
- SEC 8-K Filing (2024-06-06)
- SEC 8-K Filing (2024-05-08)
- SEC 8-K Filing (2024-02-09)
- SEC Form 4 Insider Transaction (2026-06-02)
- SEC Form 4 Insider Transaction (2026-04-08)
- SEC Form 4 Insider Transaction (2026-03-12)
- SEC 10-K Annual Report — FY2024
- SEC 10-K Annual Report — FY2023
- SEC 10-K Annual Report — FY2022
- SEC 10-K Annual Report — FY2021
- SEC 10-K Annual Report — FY2020
Data sourced from Yahoo Finance and SEC EDGAR. Not investment advice.
Leave a Comment