
| Company | Aug 25 | Sep 25 | Oct 25 | Nov 25 | Dec 25 | Jan 26 | Feb 26 | Mar 26 | Apr 26 | May 26 | Jun 26 | Jul 26 | 12-Mo |
|---|---|---|---|---|---|---|---|---|---|---|---|---|---|
| FE | +3% | +5% | +0% | +5% | -6% | +6% | +9% | -1% | -6% | -1% | +2% | +2% | +18% |
| AEP | -1% | +1% | +7% | +4% | -7% | +4% | +13% | -2% | +5% | -7% | +8% | -7% | +17% |
| EVRG | +2% | +7% | +1% | +2% | -7% | +6% | +9% | -1% | +1% | -0% | +5% | -4% | +21% |
| AEE | -1% | +5% | -2% | +4% | -5% | +3% | +10% | -2% | +3% | -5% | +5% | -3% | +11% |
| EXC | -2% | +3% | +2% | +3% | -7% | +3% | +10% | -0% | -6% | -1% | +3% | -2% | +6% |
| D | +2% | +3% | -4% | +7% | -6% | +3% | +6% | -2% | +4% | +5% | +2% | +1% | +24% |
Source: Yahoo Finance monthly adjusted close.
Quick Thesis
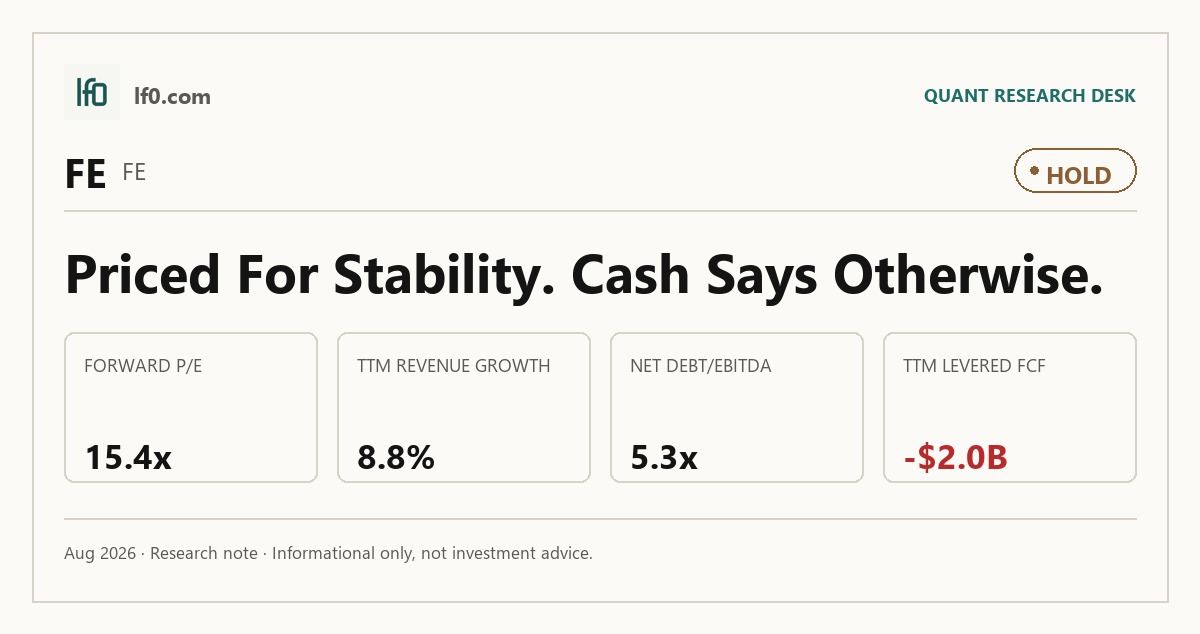
- Rated Hold — regulated growth is visible, but cash conversion is still weak.
- Core strength: a 65,000-square-mile regulated footprint serving more than 6 million customers.
- Core risk: $29B of debt and -$2B of levered free cash flow TTM.
- Valuation is fair, with 15.4x forward P/E and 10.5x EV/EBITDA.
- I would turn more constructive if levered free cash flow turns positive and net debt/EBITDA falls below 5.0x, meaning growth is funding itself.
Executive Summary
Rating: HOLD | FE
Measured from adjusted close on 2026-08-31 to 2026-10-20. Sell ratings are correct when the stock falls; Hold is tracked as a +/-10% range. Daily-close data, not intraday. Calls are tracked for 182 days from publication, then frozen as a final record.
I would put my rating as a Hold because FirstEnergy has a durable regulated asset base, but the company still has not shown me that higher capital spending is translating into self-funded cash generation. The franchise is real: it serves more than 6 million customers across a 65,000-square-mile footprint and carries a $21.3B rate base, which is the kind of structural advantage that is hard to replicate quickly. What keeps me at Hold is the financing profile, not the operating footprint. TTM levered free cash flow was -$2B and net debt/EBITDA was 5.3x, so the equity still depends on external capital and regulatory recovery rather than internal cash.
I would become more constructive if levered free cash flow turns positive and stays there for several quarters, because that would show the capital plan is beginning to fund itself rather than just expanding the rate base. If net debt/EBITDA moves below 5.0x, meaning leverage is clearly easing rather than merely stabilizing, I would view that as the clearest sign that the balance sheet is catching up with the investment program.
Company Profile
FirstEnergy Corp. is an investor-owned electric utility holding company that transmits, distributes, and generates electricity through regulated subsidiaries serving customers in Ohio, Pennsylvania, West Virginia, Maryland, New Jersey, and New York. Its network spans about 65,000 square miles and includes more than 24,000 miles of transmission lines, so the business is built around regulated asset growth rather than commodity sales. The company was formed in 1997 through the merger of Centerior Energy and Ohio Edison, and on January 1, 2024, the Pennsylvania companies were consolidated into FE PA, a single Pennsylvania distribution utility. FirstEnergy is listed on the NYSE under FE and is financed with regulated utility debt at the operating-company level plus about $6.8B of holding-company debt as of December 31, 2025.
Economic Moat
Business Model
The transmission and distribution franchise is the hardest piece to replicate within three years, because FirstEnergy’s regulated electric operating companies serve over 6 million customers across approximately 65,000 square miles and sit on a total rate base of about $21.3B as of December 31, 2025. In my view, a well-funded entrant cannot rebuild that footprint quickly because the service territories in Ohio, Pennsylvania, West Virginia, Maryland, New Jersey, and New York are already embedded in state regulation, and the distribution businesses generally face no competition inside those territories. The transmission platform adds another layer of durability: FirstEnergy operates more than 24,000 miles of transmission lines and two regional transmission operation centers, while the PJM formula-rate structure updates revenue annually and then true-ups actual costs, which gives the transmission base a more visible earnings path than a merchant model.
The business has also become cleaner over time. In 2024, the Pennsylvania companies were consolidated into FE PA, which reduced operating complexity and made regulation and capital planning easier to follow. The transmission side is still expanding through Valley Link and Grid Growth, and PJM awarded projects estimated at about $3B and $1B, respectively, which tells me the company is still gaining access to regulated growth rather than defending a static base. That matters for the moat because the regulated footprint and project pipeline reinforce each other: the larger the rate base, the more opportunities management has to compound it.
Business & Operating Risks
The most material disclosed risk is the HB 6 legacy overhang, because the 2026 10-K ties it directly to reputation, capital access, and covenant compliance. According to the risk factors in their SEC 10-K, FirstEnergy still has to keep publishing quarterly payments to 501(c)(4) entities, avoid statements that contradict the deferred prosecution agreement, and cooperate with the U.S. Attorney’s Office until related proceedings end. A breach could let prosecutors bring criminal or civil action and could trigger an event of default under credit agreements. That is not abstract legal boilerplate: this is a capital-intensive utility, so any covenant hit would quickly become a funding problem rather than just a legal one.
Regulatory recovery risk is the second major headwind. FirstEnergy says its distribution and transmission growth depends on timely approval of rates, inclusion in PJM’s Regional Transmission Expansion Plan, and evolving FERC policy on the base ROE component and recovery of network upgrade costs for large loads, including AI data centers. If state commissions or FERC delay recovery, the company carries the spend first and earns it back later, or not at all, which compresses returns on the $36 billion Energize365 plan for 2026 through 2030. The disclosed risks do not break the moat itself, but they do threaten the speed and quality of monetization of that moat.
Management Discussion & Analysis
Management is clearly responding to the regulatory and legal overhang by leaning harder into regulated investment rather than retrenchment. Energize365 was increased to $36 billion for 2026 to 2030, about 25% above the prior 2025 to 2029 plan, and FirstEnergy says the program will be funded with organic cash flow, debt including hybrid securities, and common equity. That tells me the priority is rate-base growth and reliability spending, but it also means investors should not read the plan as self-funded deleveraging because equity issuance is explicitly part of the financing stack.
The financing side is more constructive than the Ohio outcome. FirstEnergy extended its credit facilities by one year to October 2029 and October 2030 and ended 2025 with $4.8B of available liquidity, but the company also carried $325M of short-term borrowings and said it has not hedged floating-rate exposure. In other words, management is keeping the liquidity bridge open while it pushes the regulated buildout, yet the company still depends on stable market access rather than internal cash alone. The Ohio recovery gap remains the clearest sign that execution is uneven: the PUCO approved only a $34M net increase in base distribution revenues on November 19, 2025, while also triggering a $352M pre-tax impairment charge and a $275M restitution and refund settlement.
Recent Events
The most significant development I see here is the May 20, 2026 amendment to FirstEnergy Transmission, LLC’s governance agreement. FirstEnergy and Brookfield’s transmission partner extended the existing control framework to two new joint ventures, Valley Link and Grid Growth, without changing the 50.1% / 49.9% ownership split or the dispute mechanics. In my view, that strengthens the transmission investment thesis because it suggests the company is still expanding the regulated grid buildout while keeping minority governance rights intact.
The June 1, 2026 investor presentation update points in the same direction. It is a Regulation FD disclosure rather than a new transaction, but it signals that management is still actively framing strategic and regulatory priorities around Energize365, rate filings, and credit metrics. The only clear governance change outside the joint venture expansion was director Melvin Williams’ February 8, 2026 notice that he will not stand for re-election at the 2026 annual meeting. I do not read that as a thesis breaker, but it does add a small layer of board turnover while the company is still managing regulatory and capital allocation priorities.
Financial Analysis
Growth
FE — Financial Growth (Quarterly, USD Mil)
| Metric | 2025-03-31 | 2025-06-30 | 2025-09-30 | 2025-12-31 | 2026-03-31 | 2026-06-30 |
|---|---|---|---|---|---|---|
| REVENUE (USD Mil) | — | 3,380 | 4,148 | 3,797 | 4,202 | 3,678 |
| EBIT (USD Mil) | — | 663 | 871 | 267 | 876 | 729 |
| EBITDA (USD Mil) | — | — | 1,370 | — | — | 1,204 |
| NET INCOME (USD Mil) | — | 268 | 441 | -49 | 405 | 288 |
| DILUTED EPS | 0.2 | 0.1 | 0.2 | — | 0.2 | 0.1 |
Source: Yahoo Finance — Quarterly Financial Statements
Revenue rose from $3.4B in Q2 2025 to $4.2B in Q1 2026, then eased to $3.7B in Q2 2026, so the latest quarter was softer sequentially even though it remained above the prior-year base. EBIT followed a similar pattern, moving from $663M in Q2 2025 to $876M in Q1 2026 before slipping to $729M in Q2 2026. I do not see a clean explanation for the quarter-to-quarter swing in the filing, which is worth flagging because the business thesis depends on steady regulated conversion, not just one strong quarter.
Profitability
FE — Profitability (TTM)
| Metric | TTM |
|---|---|
| Operating Margin (TTM) | 19.3% |
| Net Margin (TTM) | 6.9% |
| Return on Assets (TTM) | 3.7% |
| Return on Equity (TTM) | 9.5% |
| Gross Margin (TTM) | 68.6% |
| EBITDA Margin (TTM) | 34.7% |
Source: Yahoo Finance — Trailing Twelve Months (TTM)
TTM operating margin was 19.3%, gross margin was 68.6%, and EBITDA margin was 34.7%, which points to a regulated utility that still has healthy line-level economics but absorbs a large amount of overhead, depreciation, and other below-gross costs before earnings reach the bottom line. Net margin was 6.9%, ROA was 3.7%, and ROE was 9.5%, so the company is profitable but not yet converting its asset base into especially high returns. The spread between gross margin and operating margin tells me the core franchise is intact, but the return profile still depends on disciplined capital deployment and rate recovery.
Valuation
FE — Valuation Multiples
| Metric | Value |
|---|---|
| Market Cap (USD Mil) | 26,264 |
| Enterprise Value (USD Mil) | 56,959 |
| Trailing P/E | 24.3 |
| Forward P/E | 15.4 |
| Price/Sales (TTM) | 1.7 |
| Price/Book (mrq) | 2 |
| EV/Revenue | 3.6 |
| EV/EBITDA | 10.5 |
| Beta (5Y Monthly) | 0.45 |
| FCF Yield % (TTM) | -7.7% |
| Forward EPS (USD) | 2.9 |
| Analyst Target Price – Low (USD) | 48 |
| Analyst Target Price – Mean (USD) | 53.2 |
| Analyst Target Price – High (USD) | 56 |
| # Analyst Opinions | 12 |
Source: Yahoo Finance
FirstEnergy trades at 24.3x trailing P/E, 15.4x forward P/E, 1.7x price/sales, 2.0x price/book, 3.6x EV/revenue, and 10.5x EV/EBITDA. I put more weight on EV/revenue and forward P/E than on trailing earnings because TTM free cash flow is -$2B and FCF yield is -7.7%, so the market is paying for regulated earnings visibility rather than current cash conversion. On the analysis here, I would put fair value in a range of about $48-$56 per share, which sits broadly inside the 12 analyst target range from $48 to $56; that tells me the market and the sell side are largely aligned, not arguing for a major rerating.
I would also frame earnings power at about $2.95 per share on a forward basis, which is consistent with the company’s own $2.9 forward EPS and only modestly below the peer group’s stronger names on a per-share basis. Against peers, that EPS profile is not expensive on a like-for-like basis because FirstEnergy’s lower revenue base is paired with a lower EV/revenue multiple than AEP, EVRG, AEE, and D. The valuation is therefore fair rather than cheap: the discount to the richer peers reflects weaker cash conversion and middling growth, not a broken business.
Leverage
FE — Leverage & Coverage (Quarterly)
| Metric | Value |
|---|---|
| Total Debt/Equity % (mrq) | 200.9 |
| Current Ratio (mrq) | 0.5 |
| Total Debt (mrq, USD Mil) | 28,983 |
| Operating Cash Flow (TTM, USD Mil) | 3,118 |
| Levered Free Cash Flow (TTM, USD Mil) | -2,014.6 |
| Net Debt/EBITDA (TTM) | 5.3 |
| FCF Margin % (TTM) | -12.9% |
Source: Yahoo Finance — Quarterly Financial Statements
FirstEnergy’s leverage is elevated but manageable. Total debt/equity was 200.9% mrq, current ratio was 0.5, and total debt was $29B mrq. That balance sheet gives limited near-term flexibility, because current assets cover only half of current liabilities, so the company is relying on steady regulated cash flow and access to capital markets rather than liquidity headroom.
Cash generation is the offset. Operating cash flow was $3.1B TTM, but levered free cash flow was -$2B TTM and FCF margin was -12.9%, which means EBITDA is not converting cleanly into residual cash after capex, interest, and other obligations. Net debt/EBITDA was 5.3x, and while that is not the worst in the peer set, it is still high enough that refinancing risk matters if capital markets tighten or if a large maturity needs to be rolled at higher rates. The key point is that leverage and cash conversion have to improve together; a utility can carry debt, but it cannot carry negative free cash flow forever without leaning harder on external funding.
Insider Activity
The insider transaction record I see here is one-sided: four open-market sales and no open-market purchases in the 2025-01-02 to 2026-06-01 window. The selling includes a director, the CFO, and the controller, which is enough to tell me that insiders were reducing exposure rather than adding to it. I would not overread the exact count, but the direction is still a mild bear signal because it does not show conviction buying into the regulated growth plan.
Comparable Analysis
Growth
| Company | Revenue TTM (USD Mil) | Revenue Growth YoY % | Diluted EPS TTM |
|---|---|---|---|
| FE | 15,636 | 8.8% | 1.9 |
| AEP | 22,791 | 7.0% | 5.8 |
| EVRG | 6,093.9 | 4.4% | 3.9 |
| AEE | 8,411 | -6.2% | 5.7 |
| EXC | 25,326 | 9.9% | 2.7 |
| D | 18,119 | 17.6% | 2.9 |
Source: Yahoo Finance
FirstEnergy’s 8.8% TTM revenue growth sits above AEP at 7.0% and EVRG at 4.4%, but below EXC at 9.9% and D at 17.6%. That puts FE in the middle of the pack rather than in the growth leaders, which is consistent with a regulated utility that is growing steadily but not fast enough to justify a premium on growth alone.
Valuation
| Company | Trailing P/E | Forward P/E | EV/Revenue | EV/EBITDA | Price/Sales (TTM) | Price/Book (mrq) | Market Cap (USD Mil) | Enterprise Value (USD Mil) | Beta (5Y Monthly) | FCF Yield % (TTM) | Forward EPS | Analyst Target Price – Low | Analyst Target Price – Mean | Analyst Target Price – High | # Analyst Opinions |
|---|---|---|---|---|---|---|---|---|---|---|---|---|---|---|---|
| FE | 24.3 | 15.4 | 3.6 | 10.5 | 1.7 | 2 | 26,264 | 56,959 | 0.45 | -7.7% | 2.9 | 48 | 53.2 | 56 | 12 |
| AEP | 21.1 | 17.7 | 5.3 | 13.4 | 2.9 | 2.1 | 66,210 | 120,717 | 0.51 | -9.1% | 6.9 | 129 | 144 | 173 | 20 |
| EVRG | 20.4 | 17.6 | 5.8 | 12.4 | 3 | 1.8 | 18,513 | 35,124 | 0.52 | -7.8% | 4.6 | 80 | 92 | 103 | 11 |
| AEE | 18.5 | 18.1 | 6.1 | 13.1 | 3.5 | 2.1 | 29,159 | 51,304 | 0.48 | -6.1% | 5.8 | 108 | 120.4 | 136 | 15 |
| EXC | 15.9 | 14.2 | 3.8 | 11.5 | 1.8 | 1.5 | 44,450 | 96,207 | 0.40 | -6.0% | 3 | 41 | 48.9 | 58 | 17 |
| D | 22.6 | 17.1 | 6.5 | 14 | 3.2 | 2.1 | 57,354 | 116,967 | 0.63 | -16.0% | 3.8 | 66 | 71.8 | 80 | 11 |
Source: Yahoo Finance
FE’s 15.4x forward P/E is below AEP at 17.7x, EVRG at 17.6x, AEE at 18.1x, and D at 17.1x, while its EV/revenue of 3.6x is far below AEP at 5.3x, EVRG at 5.8x, AEE at 6.1x, and D at 6.5x. That discount is partly explained by FE’s weaker cash conversion and higher leverage, because the market is not paying the same multiple for a balance sheet that still carries 5.3x net debt/EBITDA and negative free cash flow. On a peer basis, the stock looks fairly priced rather than cheap.
Profitability
| Company | Operating Margin (TTM) | Net Margin (TTM) | Return on Assets (TTM) | Return on Equity (TTM) | Gross Margin (TTM) | EBITDA Margin (TTM) |
|---|---|---|---|---|---|---|
| FE | 19.3% | 6.9% | 3.7% | 9.5% | 68.6% | 34.7% |
| AEP | 23.3% | 13.8% | 3.0% | 10.1% | 46.4% | 39.6% |
| EVRG | 25.2% | 15.2% | 2.9% | 9.3% | 52.7% | 46.6% |
| AEE | 25.2% | 18.6% | 3.1% | 11.9% | 52.4% | 46.5% |
| EXC | 16.6% | 11.0% | 2.8% | 9.7% | 42.4% | 33.0% |
| D | 29.2% | 14.0% | 3.0% | 8.3% | 46.2% | 46.0% |
Source: Yahoo Finance
FE’s operating margin of 19.3% trails AEP at 23.3%, EVRG at 25.2%, AEE at 25.2%, and D at 29.2%, while its EBITDA margin of 34.7% is also below most of the group. Gross margin at 68.6% is much higher than the peer range, which tells me the comparison is being distorted by different utility cost structures rather than by a simple execution gap. FE’s ROA of 3.7% is the best in the group, but ROE of 9.5% sits below AEE and AEP, so the company is generating decent asset returns without the same leverage-driven lift some peers enjoy.
Leverage
| Company | Total Debt/Equity % (mrq) | Current Ratio (mrq) | Total Debt (mrq, USD Mil) | Net Debt/EBITDA (TTM) | FCF Margin % (TTM) |
|---|---|---|---|---|---|
| FE | 200.9 | 0.5 | 28,983 | 5.3 | -12.9% |
| AEP | 160.8 | 0.5 | 53,525 | 5.9 | -26.3% |
| EVRG | 160.6 | 0.4 | 16,498 | 5.8 | -23.7% |
| AEE | 157.8 | 0.5 | 21,808 | 5.6 | -21.2% |
| EXC | 177.4 | 1.1 | 52,673 | 6.1 | -10.6% |
| D | 160.5 | 0.8 | 53,932 | 6.4 | -50.7% |
Source: Yahoo Finance
FE’s total debt/equity of 200.9% is above AEP, EVRG, AEE, EXC, and D, but its net debt/EBITDA of 5.3x is actually the lowest in the group. That split matters because it says the raw balance sheet looks stretched, yet cash-adjusted leverage is not the worst among peers. Even so, FE’s -12.9% FCF margin is still a drag, and that is why the market is not awarding it the richer valuation multiples given to the cleaner cash converters.
Conclusion
I would put my rating as a Hold because the tension in this name is now clear: FirstEnergy has a durable regulated footprint and a visible capital plan, but the cash flow still has not caught up with the investment pace. The moat is intact, and the recent joint-venture expansion reinforces that, yet TTM levered free cash flow remains negative at -$2B while net debt/EBITDA sits at 5.3x, so the numbers do not yet show a self-funding utility.
I would raise my rating more towards a Buy if levered free cash flow turns positive and stays there for several quarters, because that would show the capital plan is translating into cash rather than just rate base. A second positive trigger would be net debt/EBITDA moving below 5.0x, meaning leverage is clearly easing and the company is funding more of its growth internally. That would also make the dividend feel better covered and reduce the need to lean on external capital.
I would move from Hold to Sell if the Ohio recovery gap widens again or if another large rate filing lands below expectations and leaves the company carrying more spend before recovery. If net debt/EBITDA rises toward 6.0x, meaning roughly $1B of extra debt on the current EBITDA base, financing flexibility would tighten further and the negative free cash flow profile would become harder to ignore.
Weighing both sides, I think the bear case is more likely to show up first because the company still has to prove that higher capital spending can be converted into cash, not just rate base. The regulated asset base is real, but until free cash flow improves, I see the stock as a wait for proof rather than a name to add aggressively.
What to Watch Next
- Levered free cash flow turning positive — would support a move toward Buy.
- Net debt/EBITDA below 5.0x — would show leverage is easing.
- Ohio rate recovery improving — would reduce execution risk.
- Another large rate filing approved below expectations — would push the rating lower.
- Net debt/EBITDA near 6.0x — would tighten financing flexibility further.
What’s your take? I rated FirstEnergy (FE) HOLD above — but the goal here is to get this right, not just to publish an opinion. What would you add to this analysis, or which risk or catalyst do you think I’m under- or over-weighting? Tell me in the comments.
Sources
- SEC 10-K Annual Report — filed 2026-02-18
- SEC 8-K Filing (2026-06-01)
- SEC 8-K Filing (2026-05-20)
- SEC 8-K Filing (2026-04-28)
- SEC 8-K Filing (2026-02-17)
- SEC 8-K Filing (2026-02-12)
- SEC Form 4 Insider Transaction (2026-06-03)
- SEC Form 4 Insider Transaction (2026-04-03)
- SEC Form 4 Insider Transaction (2026-04-03)
- SEC 10-K Annual Report — FY2026
- SEC 10-K Annual Report — FY2025
- SEC 10-K Annual Report — FY2024
- SEC 10-K Annual Report — FY2023
- SEC 10-K Annual Report — FY2022
Data sourced from Yahoo Finance and SEC EDGAR. Not investment advice.
Leave a Comment