
| Company | Aug 25 | Sep 25 | Oct 25 | Nov 25 | Dec 25 | Jan 26 | Feb 26 | Mar 26 | Apr 26 | May 26 | Jun 26 | Jul 26 | 12-Mo |
|---|---|---|---|---|---|---|---|---|---|---|---|---|---|
| PEG | -8% | +2% | -3% | +4% | -3% | +3% | +5% | -5% | +1% | -4% | +4% | -6% | -12% |
| PPL | +2% | +3% | -2% | +1% | -4% | +4% | +8% | -1% | -2% | -5% | +4% | -3% | +2% |
| ES | -3% | +12% | +4% | -9% | +1% | +3% | +10% | -8% | +2% | -2% | +6% | -1% | +13% |
| CNP | -2% | +3% | -1% | +5% | -4% | +4% | +10% | -1% | +1% | -3% | +4% | -5% | +11% |
| FE | +3% | +5% | +0% | +5% | -6% | +6% | +9% | -1% | -6% | -1% | +2% | +2% | +18% |
| AEP | -1% | +1% | +7% | +4% | -7% | +4% | +13% | -2% | +5% | -7% | +8% | -7% | +17% |
Source: Yahoo Finance monthly adjusted close.
Quick Thesis
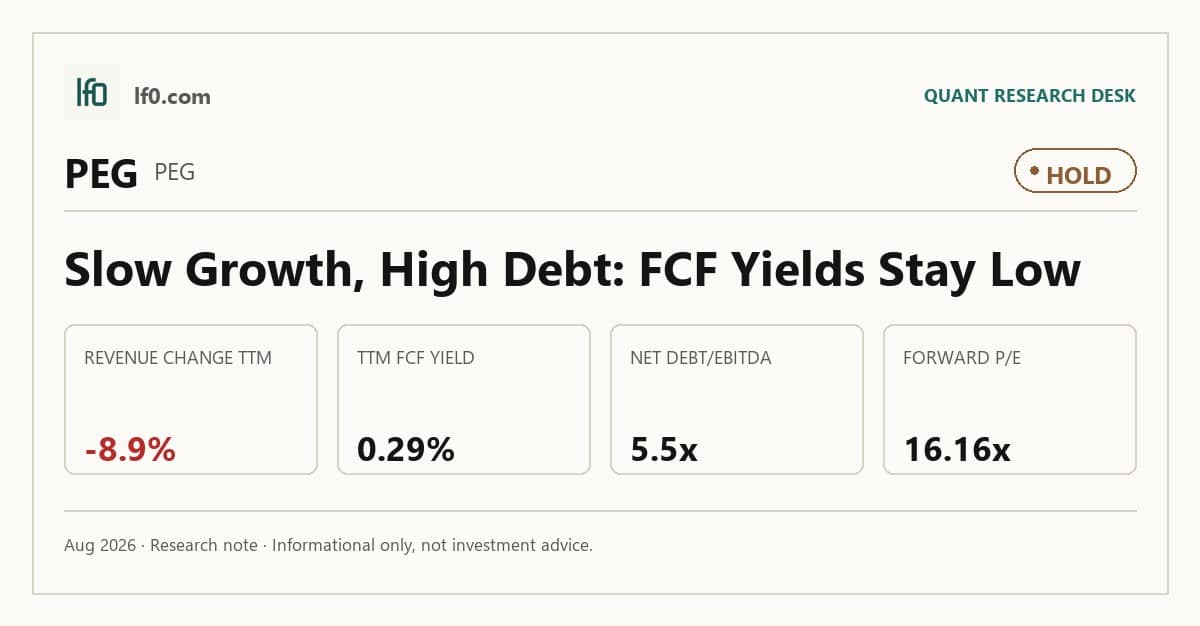
- Rated hold because the regulated franchise is solid, but cash conversion is weak.
- Strongest point: $3.6B of operating cash flow TTM.
- Biggest risk: 5.5x net debt/EBITDA, with only $107.8M of levered free cash flow.
- Valuation is fair to slightly rich at 14.0x EV/EBITDA and 4.97x EV/revenue.
- I would turn more constructive if FCF margin moves materially above 1.0% and leverage falls below 5.0x.
Executive Summary
Rating: HOLD | PEG
Measured from adjusted close on 2026-08-17 to 2026-10-01. Sell ratings are correct when the stock falls; Hold is tracked as a +/-10% range. Daily-close data, not intraday. Calls are tracked for 182 days from publication, then frozen as a final record.
I would put my rating as a Hold because PSEG’s regulated New Jersey franchise and nuclear fleet support earnings visibility, but the stock already prices in a lot of that stability while growth and cash conversion remain uneven. The strongest financial point is the $3.6B of operating cash flow TTM, which shows the utility still funds a large capital program without relying on equity. The biggest risk is 5.5x net debt/EBITDA, paired with only $107.8M of levered free cash flow and a 0.9% FCF yield, so the balance sheet has limited room if regulators slow recovery or financing costs stay high. I would move more towards a Buy if PSEG can hold operating margin near 19.0% while lifting FCF margin materially above 1.0%, meaning the capital program is turning into real cash rather than just rate base.
Company Profile
Public Service Enterprise Group Incorporated is a regulated energy holding company whose main operating subsidiary, Public Service Electric and Gas Company, delivers electricity and natural gas to customers in New Jersey through transmission, distribution, and utility service rates. It also owns nuclear generation assets, including the New Jersey nuclear plants and a 25.2% interest in the Peach Bottom plants, with output sold into wholesale power markets. Founded in 1903, the company has grown through utility expansion and generation ownership rather than a recent listing path. Its asset base spans utility networks, nuclear facilities, and related transmission infrastructure, and it is financed with a mix of common equity and long-term debt.
Economic Moat
Business Model
The regulated New Jersey electric and gas franchise is the hard-to-replicate core, because PSE&G earns under regulated rate tariffs for electric transmission and electric and natural gas distribution in a designated service territory. I feel that a well-funded entrant could not rebuild that franchise within 3 years. PSE&G is also the provider of last resort for gas and electric commodity service, which deepens customer stickiness because the utility remains the backstop when customers need service regardless of market conditions. In my view, that franchise right, not capital alone, is the moat.
The business mix has also become cleaner. In 2022, PSEG still had a 6,750 MW fossil generation portfolio, but that portfolio was sold in February 2022. Since then, management has shifted capital toward PSE&G and the regulated utility base, while the nuclear fleet remains a second earnings engine rather than the center of the story. That shift makes the equity easier to underwrite because more of the value now comes from regulated returns than from merchant power exposure.
Business & Operating Risks
The biggest disclosed risk is that PSE&G’s capital program can be slowed, disallowed, or under-recovered by regulators, because the company is still relying on extensive investment in capital improvements and timely recovery of those investments through rates. The filing also highlights nearly $1B of funding for the Clean Energy Future – Energy Efficiency II Program, while FERC could remove the 50 basis point adder for RTO membership, which would reduce annual net income and cash inflows by about $40M. That is a direct risk to the regulated earnings stream, not a side issue.
Resource adequacy in PJM is the other major pressure point. Demand is being pushed by data centers, EV adoption, electrification and other factors, and insufficient supply has already driven increases in energy and capacity prices as well as affordability concerns. Climate, weather, and cyber risk are more explicit too, with the filing citing Superstorm Sandy, Tropical Storms Isaias and Ida, sea level rise, extreme heat and drought, ransomware, denial of service attacks, and third-party system dependence. The risk set is broader than it was a few years ago, but it does not break the moat itself; it mainly tests whether the regulated franchise can keep recovering capital and storm costs on time.
Management Discussion & Analysis
Management is actively leaning into the risks above by pushing regulated rate-base growth and extending the nuclear fleet’s useful life. PSE&G’s regulated rate base rose from about $34B at December 31, 2024 to about $36B at December 31, 2025, and management laid out a 2026 to 2030 regulated capital program of $22.5B to $25.5B. That is the right response to a utility that needs steady recovery, but it also keeps funding needs elevated.
The project mix reinforces the point. The October 2024 Clean Energy Future Energy Efficiency II approval authorized about $2.9B, and the November 2025 Gas System Modernization Program III approval authorized $1.05B plus $360M of additional gas main investment. On the nuclear side, management extended the useful lives of Salem 1, Salem 2 and Hope Creek, completed the Hope Creek refueling-cycle extension from 18 months to 24 months in October 2025, and is planning power uprates at Salem Units 1 and 2. I think that is credible because nuclear output was about 30.9 terawatt hours in 2025 at a 91.2% capacity factor, so the fleet is still doing the job management is underwriting.
The financing side is less comfortable. PSE&G still had $450M of 0.95% Secured Medium-Term Notes due March 2026 and $425M of 2.25% Secured Medium-Term Notes due September 2026, so the growth plan is being funded, but it is not de-risking the balance sheet. In my view, management is responding to the disclosed risks, yet the response is capital intensive enough that leverage remains a live issue.
Recent Events
The most important recent event was PSEG’s $500M senior notes issuance on June 3, 2026, which extends funding for the regulated utility platform and supports the capital program without forcing an immediate equity raise. I view that as supportive, not distressed, because long-dated debt is part of the utility model.
The January 20, 2026 board addition of Geisha J. Williams, disclosed on January 21, 2026, is a modest governance positive. It broadens oversight at a time when the company is leaning on capital markets and large-scale execution. By contrast, the April 21, 2026 annual meeting, disclosed April 23, 2026, left supermajority voting requirements in place after shareholders rejected all three charter and bylaw amendments. That limits flexibility if management later wants to simplify the capital structure or push through governance changes.
The May 5, 2026 first-quarter earnings release and call were routine, so they do not change the moat view. The recent 8-Ks leave the investment case slightly stronger on financing, but still constrained by governance inertia and a capital program that needs steady execution.
Financial Analysis
Growth
PEG — Financial Growth (Quarterly, USD Mil)
| Metric | 2025-06-30 | 2025-09-30 | 2025-12-31 | 2026-03-31 | 2026-06-30 |
|---|---|---|---|---|---|
| REVENUE (USD Mil) | 2,805 | 3,226 | 2,915 | 3,848 | 2,554 |
| EBIT (USD Mil) | 974 | 973 | 530 | 1,120 | 667 |
| EBITDA (USD Mil) | 1,330 | 1,337 | 896 | 1,503 | 1,042 |
| NET INCOME (USD Mil) | 585 | 622 | 315 | 741 | 334 |
| DILUTED EPS | 1.2 | 1.2 | 0.6 | 1.5 | 0.7 |
Source: Yahoo Finance — Quarterly Financial Statements
Revenue moved from $2.8B in Q2 2025 to $3.2B in Q3 2025, then slipped to $2.9B in Q4 2025 before jumping to $3.8B in Q1 2026 and falling back to $2.6B in Q2 2026. That pattern is lumpy rather than steadily compounding, so I would not extrapolate one quarter’s run rate. EBITDA followed the same shape, rising to $1.5B in Q1 2026 before easing to $1B in Q2 2026, which tells me the business is still tied to timing and seasonal effects rather than a clean growth inflection. The latest quarter weakness is important because it shows the regulated base is stable, but not immune to volatility in the earnings bridge.
Profitability
PEG — Profitability (TTM)
| Metric | TTM |
|---|---|
| Operating Margin (TTM) | 18.9% |
| Net Margin (TTM) | 16.0% |
| Return on Assets (TTM) | 3.2% |
| Return on Equity (TTM) | 11.8% |
| Gross Margin (TTM) | 33.3% |
| EBITDA Margin (TTM) | 35.6% |
Source: Yahoo Finance — Trailing Twelve Months (TTM)
TTM operating margin of 18.9% and EBITDA margin of 35.6% show that PSEG still converts a solid share of revenue into pre-depreciation earnings, which is what I would expect from a regulated utility with stable cost recovery. Net margin of 16.0% remains healthy, but gross margin of 33.3% is well below the stronger peers in the comparable set, which suggests the cost structure is not as efficient as the best names. ROA of 3.2% and ROE of 11.8% point to acceptable asset returns and decent equity returns, but not a best-in-class capital-efficiency profile. The key link to the moat is that the regulated franchise is still producing solid margins, yet the spread is not wide enough to make execution risk irrelevant.
Valuation
PEG — Valuation Multiples
| Metric | Value |
|---|---|
| Market Cap (USD Mil) | 37,643 |
| Enterprise Value (USD Mil) | 62,386 |
| Trailing P/E | 18.8 |
| Forward P/E | 16.2 |
| Price/Sales (TTM) | 3 |
| Price/Book (mrq) | 2.2 |
| EV/Revenue | 5 |
| EV/EBITDA | 14 |
| Beta (5Y Monthly) | 0.53 |
| FCF Yield % (TTM) | 0.3% |
| Forward EPS (USD) | 4.7 |
| Analyst Target Price – Low (USD) | 73 |
| Analyst Target Price – Mean (USD) | 85.8 |
| Analyst Target Price – High (USD) | 96 |
| # Analyst Opinions | 18 |
Source: Yahoo Finance
PSEG trades at 14.0x EV/EBITDA, 16.2x forward P/E, 4.97x EV/revenue, and 3.0x price/sales, with a 0.29% TTM FCF yield. That is not a distressed multiple, and the cash yield is too thin for me to call it cheap on cash generation. On the analysis here, I would put fair value in a range of about $74-$88 per share, which is broadly in line with the peer-multiple work and sits inside the $73–$96 analyst target range from 18 opinions. My own range is a little below the consensus mean of $85.8 because I weight the weak FCF yield and 5.5x net debt/EBITDA more heavily than the market appears to. Forward EPS of 4.67 implies the stock is not expensive on earnings alone, but the earnings base still has to convert into cash before I would argue for a premium.
Leverage
PEG — Leverage & Coverage (Quarterly)
| Metric | Value |
|---|---|
| Total Debt/Equity % (mrq) | 142.4 |
| Current Ratio (mrq) | 0.9 |
| Total Debt (mrq, USD Mil) | 24,678 |
| Operating Cash Flow (TTM, USD Mil) | 3,592 |
| Levered Free Cash Flow (TTM, USD Mil) | 107.8 |
| Net Debt/EBITDA (TTM) | 5.5 |
| FCF Margin % (TTM) | 0.9% |
Source: Yahoo Finance — Quarterly Financial Statements
Total debt was $24.7B at the most recent quarter, with total debt/equity of 142.4% and a current ratio of 0.9x. Operating cash flow was $3.6B TTM, but levered free cash flow was only $107.8M and FCF margin was 0.9%, which is the clearest sign that capex and other claims are absorbing most of the cash the utility generates. Net debt/EBITDA of 5.5x leaves the company serviceable but not flexible, so the balance sheet can support the plan, yet it does not give much room for a miss. That is why I think the leverage profile matters more than the headline debt number: the issue is not solvency, it is how little cash is left after the regulated investment cycle.
Insider Activity
The insider record is net selling. The most visible trades are repeated sales by Ralph A. LaRossa, with additional sales from Kim C. Hanemann and Richard T. Thigpen, which weakens the alignment signal for outside shareholders. I would not overread one quarter of selling in a utility, but I do think the pattern is more consistent with a management team that is comfortable monetizing stock than one aggressively signaling undervaluation.
Comparable Analysis
Growth
| Company | Revenue TTM (USD Mil) | Revenue Growth YoY % | EBITDA TTM (USD Mil) | Diluted EPS TTM |
|---|---|---|---|---|
| PEG | 12,543 | -8.9% | 4,463 | 4 |
| PPL | 9,398 | 4.2% | 3,759 | 1.7 |
| ES | 13,998.4 | 2.3% | 4,933 | 4.7 |
| CNP | 9,620 | 10.7% | 3,854 | 1.7 |
| FE | 15,636 | 8.8% | 5,422 | 1.9 |
| AEP | 22,791 | 7.0% | 9,029 | 1.2 |
Source: Yahoo Finance
PSEG’s revenue fell 8.9% TTM, while PPL grew 4.2%, ES grew 2.3%, CNP grew 10.7%, FE grew 8.8%, and AEP grew 7.0%. That makes PSEG the only name in the group with negative top-line growth, which is hard to ignore for a utility unless the decline is clearly temporary. EBITDA TTM of $4.5B is still substantial, but the growth gap says the market is paying for stability rather than acceleration.
Valuation
| Company | Trailing P/E | Forward P/E | EV/Revenue | EV/EBITDA | Price/Sales (TTM) | Price/Book (mrq) | Market Cap (USD Mil) | Enterprise Value (USD Mil) | Beta (5Y Monthly) | FCF Yield % (TTM) | Forward EPS | Analyst Target Price – Low | Analyst Target Price – Mean | Analyst Target Price – High | # Analyst Opinions |
|---|---|---|---|---|---|---|---|---|---|---|---|---|---|---|---|
| PEG | 18.8 | 16.2 | 5 | 14 | 3 | 2.2 | 37,643 | 62,386 | 0.53 | 0.3% | 4.7 | 73 | 85.8 | 96 | 18 |
| PPL | 21.2 | 17 | 5 | 12.5 | — | 1.8 | 27,002 | 47,151 | 0.59 | -7.2% | 2.1 | 36 | 41.5 | 48 | 14 |
| ES | 15.4 | 14.7 | 4 | 11.2 | 1.9 | 1.7 | 27,119 | 55,400 | 0.70 | 3.0% | 4.9 | 52 | 73.8 | 85 | 12 |
| CNP | 24.1 | 19.4 | 5.3 | 13.3 | 2.8 | 2.3 | 26,678 | 51,085 | 0.46 | -19.5% | 2.1 | 40 | 46 | 50 | 16 |
| FE | 25.2 | 16 | 3.7 | 10.7 | 1.7 | 2.1 | 27,296 | 57,844 | 0.45 | -7.3% | 2.9 | 48 | 53.3 | 56 | 12 |
| AEP | 108 | 18.3 | 5.4 | 13.6 | 3 | 2.1 | 68,191 | 122,508 | 0.51 | -8.8% | 6.9 | 129 | 144.9 | 173 | 20 |
Source: Yahoo Finance
PSEG trades at 4.97x EV/revenue and 13.98x EV/EBITDA, versus PPL at 5.02x and 12.5x, ES at 3.96x and 11.2x, CNP at 5.31x and 13.3x, FE at 3.7x and 10.7x, and AEP at 5.38x and 13.6x. On a peer EV/revenue range of roughly 3.7x to 5.4x, PSEG’s implied enterprise value is about $46.4B to $67B, which supports a share-price range around the mid-$40s to high-$80s after adjusting for debt and cash. That range is not far from the current price, but I think the market is giving PSEG credit for cash generation that has not yet shown up in FCF yield. A $1 investment one year ago would be worth 0.93 in PSEG versus $1.03 in PPL, $1.17 in ES, $1.11 in CNP, $1.18 in FE, and $1.17 in AEP, so the stock has lagged the better peers even before you adjust for the weaker growth profile.
Profitability
| Company | Operating Margin (TTM) | Net Margin (TTM) | Return on Assets (TTM) | Return on Equity (TTM) | Gross Margin (TTM) | EBITDA Margin (TTM) |
|---|---|---|---|---|---|---|
| PEG | 18.9% | 16.0% | 3.2% | 11.8% | 33.3% | 35.6% |
| PPL | 23.6% | 13.5% | 3.2% | 8.6% | 44.1% | 40.0% |
| ES | 23.9% | 10.4% | 3.3% | 9.0% | 52.8% | 35.2% |
| CNP | 24.5% | 11.6% | 3.0% | 9.8% | 47.0% | 40.1% |
| FE | 19.3% | 6.9% | 3.7% | 9.5% | 68.6% | 34.7% |
| AEP | 23.3% | 13.8% | 3.0% | 10.1% | 46.4% | 39.6% |
Source: Yahoo Finance
PSEG’s operating margin of 18.9% trails PPL at 23.6%, ES at 23.9%, CNP at 24.5%, and AEP at 23.3%, while its net margin of 16.0% is respectable but not enough to offset the weaker top-line trend. Gross margin of 33.3% is well below PPL at 44.1%, ES at 52.8%, CNP at 47.0%, FE at 68.6%, and AEP at 46.4%, which tells me the company is not operating with the same cost efficiency as the stronger peers. ROE of 11.8% is better than most of the group, but ROA of 3.2% is only average, so the return profile is decent rather than exceptional.
Leverage
| Company | Total Debt/Equity % (mrq) | Current Ratio (mrq) | Total Debt (mrq, USD Mil) | Operating Cash Flow TTM (USD Mil) | Free Cash Flow TTM (USD Mil) | Net Debt/EBITDA (TTM) | FCF Margin % (TTM) |
|---|---|---|---|---|---|---|---|
| PEG | 142.4 | 0.9 | 24,678 | 3,592 | 107.8 | 5.5 | 0.9% |
| PPL | 135.4 | 0.9 | 20,376 | 2,654 | -1,938.4 | 5.3 | -20.6% |
| ES | 180.7 | 0.8 | 29,807.8 | 4,430.4 | 812 | 5.7 | 5.8% |
| CNP | 210.3 | 1.1 | 24,642 | 2,576 | -5,191.9 | 6.3 | -54.0% |
| FE | 200.9 | 0.5 | 28,983 | 3,118 | -2,007.1 | 5.3 | -12.8% |
| AEP | 160.8 | 0.5 | 53,525 | 7,694 | -5,995.9 | 5.9 | -26.3% |
Source: Yahoo Finance
PSEG’s total debt/equity of 142.4% is lower than CNP at 210.3% and FE at 200.9%, but its 5.5x net debt/EBITDA and 0.9x current ratio still leave it with limited flexibility. PPL and FE sit at 5.3x net debt/EBITDA, ES at 5.7x, CNP at 6.3x, and AEP at 5.9x, so PSEG is not the most levered utility in the group, yet its 0.9% FCF margin is one of the weakest. That combination matters because a utility with modest leverage can still be fragile if free cash flow is nearly flat, and the market is paying for balance-sheet safety as much as for earnings quality.
Conclusion
I would put my rating as a Hold because the key tension is not whether PSEG has a moat — it does — but whether that moat is translating into enough free cash flow to justify the current valuation. The regulated New Jersey franchise and nuclear fleet still support earnings visibility, yet the latest numbers show only 0.9% FCF margin, 5.5x net debt/EBITDA, and a share price that already reflects utility-style stability.
I would raise my rating more towards a Buy if PSEG can keep operating margin near 19.0% while lifting FCF margin materially above 1.0%, because that would show the capital program is turning into cash rather than just rate base. If net debt/EBITDA moves below 5.0x, meaning leverage is clearly easing, I would read that as evidence that the company can fund growth and still improve equity protection. On the other hand, I would move from Hold to Sell if rate recovery slips, FCF stays near 0.9%, and debt remains above $24B, because that would mean the capital plan is consuming cash faster than it is creating it.
Weighing both paths, I think the hold case arrives first because the franchise is intact and the nuclear and regulated utility assets are still doing their job. What keeps me from getting more constructive is that the current valuation already assumes more cash generation than the latest numbers justify, so I need to see FCF improve before I would step up to Buy.
What to Watch Next
- FCF margin above 1.0% — would support a move toward Buy.
- Net debt/EBITDA below 5.0x — would show leverage is easing.
- Operating margin holding near 19.0% — would confirm the utility base is still stable.
- Rate recovery staying on schedule — would reduce the risk of cash leakage.
- Debt staying above $24B with weak FCF — would keep the Sell case alive.
What’s your take? I rated Public Service Enterprise Group (PEG) HOLD above — but the goal here is to get this right, not just to publish an opinion. What would you add to this analysis, or which risk or catalyst do you think I’m under- or over-weighting? Tell me in the comments.
Sources
- SEC 10-K Annual Report — filed 2026-02-26
- SEC 8-K Filing (2026-06-03)
- SEC 8-K Filing (2026-05-05)
- SEC 8-K Filing (2026-04-23)
- SEC 8-K Filing (2026-02-26)
- SEC 8-K Filing (2026-01-21)
- SEC Form 4 Insider Transaction (2026-06-02)
- SEC Form 4 Insider Transaction (2026-05-05)
- SEC Form 4 Insider Transaction (2026-05-05)
- SEC 10-K Annual Report — FY2026
- SEC 10-K Annual Report — FY2025
- SEC 10-K Annual Report — FY2024
- SEC 10-K Annual Report — FY2023
- SEC 10-K Annual Report — FY2022
Data sourced from Yahoo Finance and SEC EDGAR. Not investment advice.
Leave a Comment