
| Company | Sep 25 | Oct 25 | Nov 25 | Dec 25 | Jan 26 | Feb 26 | Mar 26 | Apr 26 | May 26 | Jun 26 | Jul 26 | Aug 26 | 12-Mo |
|---|---|---|---|---|---|---|---|---|---|---|---|---|---|
| RTX | +6% | +7% | -2% | +5% | +10% | +1% | -5% | -9% | +2% | +6% | +13% | -3% | +33% |
| LMT | +10% | -1% | -7% | +6% | +31% | +4% | -8% | -14% | +2% | -3% | +14% | -4% | +26% |
| KTOS | +39% | -1% | -16% | -0% | +36% | -16% | -18% | -11% | +2% | -22% | -7% | +9% | -23% |
| NOC | +4% | -4% | -2% | +0% | +21% | +5% | -6% | -15% | -3% | -9% | +7% | -0% | -7% |
| GD | +5% | +2% | -1% | -1% | +5% | +2% | -4% | +1% | +1% | +2% | +9% | -3% | +16% |
| LHX | +10% | -5% | -3% | +5% | +17% | +6% | -5% | -7% | -2% | -7% | -5% | -4% | -3% |
Source: Yahoo Finance monthly adjusted close.
Quick Thesis
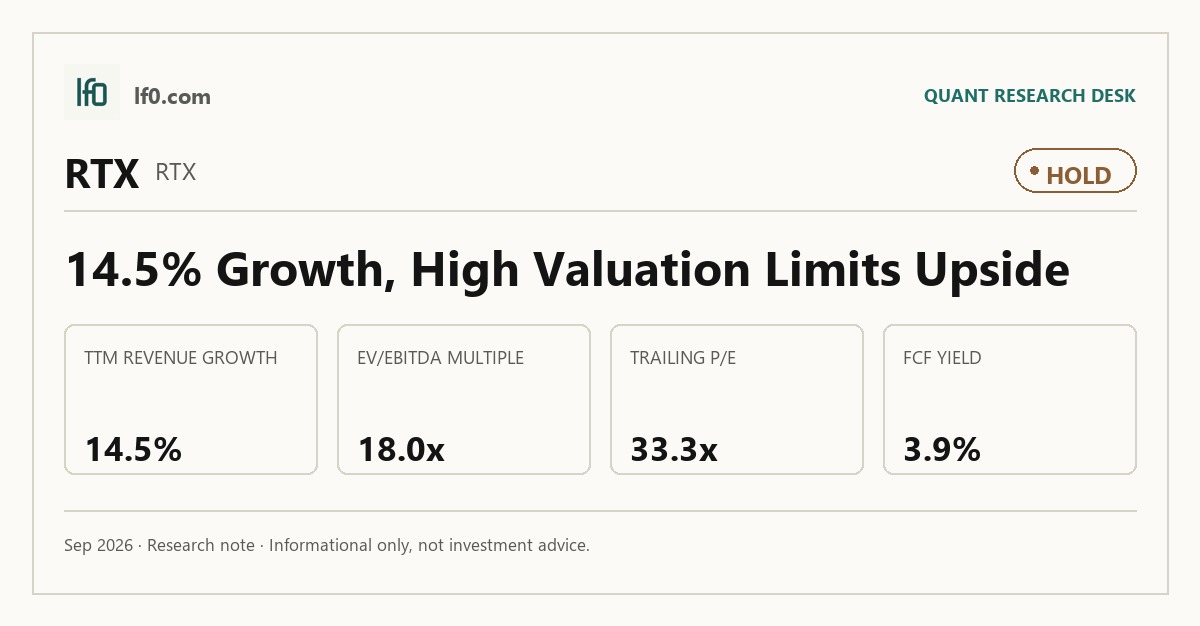
- Rated Hold — strong backlog and cash flow, but the stock already prices in much of it.
- RTX’s key strength is $268B of backlog and $9.9B of TTM levered free cash flow.
- The main risk is execution: $38.9B of debt and the Pratt & Whitney powder metal issue.
- Valuation is rich versus peers at 23.9x forward P/E and 17.9x EV/EBITDA.
- I would raise my rating if operating margin holds above 12.7% and free cash flow stays near 10.6%.
Executive Summary
Rating: HOLD | RTX
We’ll begin tracking this call’s performance since publication once sufficient adjusted-close data is available.
I would put my rating as a Hold because RTX has a durable installed-base franchise and a large backlog, but the shares already discount a lot of that strength at 23.9x forward P/E and 17.9x EV/EBITDA. In my view, the key support is the combination of $268B of backlog and $9.9B of TTM levered free cash flow, which gives the company room to absorb normal volatility. The main issue is that the Pratt & Whitney powder metal problem and defense-program execution risk are still live, so I do not see enough margin for error at the current price. I would turn more constructive if operating margin stays above 12.7% and free cash flow remains near 10.6% of revenue, because that would show backlog is converting into cash at a pace the market may still be underestimating.
Company Profile
RTX Corporation is an aerospace and defense company incorporated in Delaware in 1934 and listed on the NYSE under RTX. It earns revenue from original equipment and aftermarket parts and services in commercial aerospace, plus prime contractor and subcontractor work on defense and government programs worldwide. The business is organized into Collins Aerospace, Pratt & Whitney, and Raytheon. Collins supplies aircraft systems, cabin interiors, connected aviation services, and defense communications; Pratt & Whitney designs, manufactures, and services commercial, military, business jet, and helicopter engines, including the PW1000G Geared Turbofan (GTF) engine family and the F135 engine for the F-35; Raytheon provides missiles, radars, sensors, air and missile defense, and space systems. RTX has about 180,000 employees, operates roughly 225 manufacturing, production, or overhaul facilities in about 25 countries, and serves customers in 52 countries. At December 31, 2025, it had $268B of backlog.
Economic Moat
Business Model
Collins Aerospace’s aftermarket services and long-term maintenance agreements are the most defensible part of RTX’s model, because once an airline or defense operator has a certified fleet on a Collins platform, the installed base creates recurring demand for spare parts, overhaul, repair, engineering support, and fleet management that I feel a well-funded entrant cannot replicate within 3 years. That stickiness is reinforced by the scale of the commercial customer base, with Boeing and Airbus together representing 16% of Collins segment sales in 2025, which means Collins is embedded in the two largest airframer ecosystems rather than selling into a fragmented niche. Pratt & Whitney adds a second layer of durability through the GTF engine family, which now powers more than 2,600 aircraft for over 90 operators across three platforms, and the 21-facility aftermarket network that increased PW1100G-JM shop visit output by approximately 26% year over year in 2025 shows how the installed base is being monetized. Raytheon’s defense franchise is also hard to dislodge because it sits on prime contractor and major subcontractor roles across Patriot, LTAMDS, SM-3, AMRAAM, and SPY-6 programs, where qualification, security, and program continuity create switching friction that is far more durable than ordinary industrial demand.
The shift from four principal segments in 2022 to three after the July 1, 2023 streamlining concentrated RTX around the businesses with the clearest installed-base and program-lock-in economics. That matters because it makes the moat easier to see in the numbers: the company is leaning more heavily on recurring service revenue and less on a fragmented portfolio of overlapping activities. The 2025 awards for Collins’ FAA Radar System Replacement work, the STARS follow-on, and over $4B of long-term airline maintenance and spare-parts agreements reinforce that mix, so the moat is not just a story about scale; it is a business model built around recurring access to critical platforms.
Business & Operating Risks
The most material disclosed risk is dependence on U.S. government defense spending and contract execution, because RTX’s U.S. government revenues largely result from contracts awarded under various U.S. government programs and the filing warns that shutdowns, continuing resolutions, stop work orders, delayed awards, delayed payments, and contract terminations could hit results and liquidity. According to the risk factors in their SEC 10-K, even partial funding can leave programs only partially funded initially, and RTX may use its own funds to meet delivery dates without guaranteed reimbursement. Fixed-price development contracts add another layer of pressure because cost overruns can fall entirely on RTX rather than on the customer.
The second risk is the Pratt & Whitney Geared Turbofan powder metal matter, which requires accelerated inspection of the PW1100G-JM fleet and has caused increased engine removals, inspections, shop visits, aircraft on ground levels, and costs to the company. The filing says the issue will continue to drive significant incremental shop visits through the end of 2026, so this is not a one-quarter nuisance; it is a multi-period drag on margins and cash. The October 2024 deferred prosecution agreements and SEC Administrative Order add compliance friction, with potential penalties, debarment risk, and divestiture delays if obligations are breached. Taken together, these risks do not break the moat, but they do threaten the very cash conversion and aftermarket reliability that make the moat valuable in the first place.
Management Discussion & Analysis
Management is responding to those risks with a mix of debt reduction, selective capital returns, and backlog conversion. The company repaid $1.1B of term loan due 2026 on December 17, 2025, $1.5B of notes due 2025 on August 18, 2025, and $750M of term loan due 2025 on May 7, 2025, which pushes maturities out even if it does not materially shrink the absolute debt load. That is sensible given the operating backdrop, but it also tells me management is prioritizing balance-sheet flexibility over aggressive buybacks, especially with only about $0.6B of remaining repurchases authorized and just $50M of buybacks in 2025.
The capital allocation stance is supported by cash generation, not by wishful thinking. RTX still declared a $0.68 per share dividend on February 6, 2026, and it ended 2025 with $14.2B of operating cash flow and $9.9B of levered free cash flow, so the payout is covered. At the same time, the company is carrying $38.9B of commercial aerospace financing and other contractual commitments plus $29B of 2026 purchase obligations, which means the powder metal issue and any tariff shock would still matter. In my view, management is actively addressing the balance-sheet side of the risk, but the operational side remains unresolved.
Management’s credibility is mixed. The powder metal issue proved more persistent than earlier framing suggested, yet the company did convert some regulatory openings into revenue and kept the backlog growing to $268B. I do not see a leadership break in the period covered here, but I do see a management team that has been more optimistic than the operating reality at times.
Recent Events
The January 27, 2026 and April 21, 2026 earnings releases show RTX is still operating on a normal reporting cadence rather than through a strategic reset. That is useful because it suggests continuity in execution, but it does not change the structural case on its own.
The only non-routine governance change was James A. Winnefeld Jr.’s resignation from the board on March 5, 2026, which reduced the board from 11 to 10 directors. I view that as a modest governance change, not a thesis breaker, because the filing says the resignation was not tied to any dispute or disagreement.
The April 30, 2026 annual meeting, disclosed on May 4, 2026, brought no surprise control event: all directors were elected, say-on-pay passed, and PricewaterhouseCoopers LLP was reappointed as auditor. The recent 8-Ks therefore leave the moat thesis intact, while the real question remains whether execution can keep pace with the backlog.
Financial Analysis
Growth
RTX — Financial Growth (Quarterly, USD Mil)
| Metric | 2025-06-30 | 2025-09-30 | 2025-12-31 | 2026-03-31 | 2026-06-30 |
|---|---|---|---|---|---|
| REVENUE (USD Mil) | 21,581 | 22,478 | 24,238 | 22,076 | 24,708 |
| EBIT (USD Mil) | 2,520 | 2,921 | 2,667 | 2,926 | 3,170 |
| EBITDA (USD Mil) | 3,596 | 4,012 | 3,826 | 3,997 | 4,249 |
| NET INCOME (USD Mil) | 1,657 | 1,918 | 1,622 | 2,059 | 2,139 |
| DILUTED EPS | 1.2 | 1.4 | 1.2 | 1.5 | 1.6 |
Source: Yahoo Finance — Quarterly Financial Statements
| Metric | 2025-06-30 | 2025-09-30 | 2025-12-31 | 2026-03-31 | 2026-06-30 |
|---|---|---|---|---|---|
| Revenue USD Mil | 21,581 | 22,478 | 24,238 | 22,076 | 24,708 |
| EBIT USD Mil | 2,520 | 2,921 | 2,667 | 2,926 | 3,170 |
| EBITDA USD Mil | 3,596 | 4,012 | 3,826 | 3,997 | 4,249 |
| Net Income USD Mil | 1,657 | 1,918 | 1,622 | 2,059 | 2,139 |
| Diluted EPS USD | 1.2 | 1.4 | 1.2 | 1.5 | 1.6 |
RTX’s revenue rose to $24.7B in the latest quarter from $21.6B a year earlier, and that 14.5% growth is strong enough to support the moat thesis rather than merely decorate it. EBITDA increased to $4.2B and net income to $2.1B, so the company is not just growing sales; it is converting that growth into earnings. The key point is that this is not a standalone top-line story: the backlog and installed-base model are finally showing up in both revenue and profit, which is what makes the growth more credible.
Profitability
RTX — Profitability (TTM)
| Metric | TTM |
|---|---|
| Operating Margin (TTM) | 12.7% |
| Net Margin (TTM) | 8.3% |
| Return on Assets (TTM) | 4.2% |
| Return on Equity (TTM) | 12.3% |
| Gross Margin (TTM) | 20.3% |
| EBITDA Margin (TTM) | 17.0% |
Source: Yahoo Finance — Trailing Twelve Months (TTM)
| Metric | TTM |
|---|---|
| Operating Margin TTM | 12.7% |
| Net Margin TTM | 8.3% |
| Return on Assets TTM | 4.2% |
| Return on Equity TTM | 12.3% |
| Gross Margin TTM | 20.3% |
| EBITDA Margin TTM | 17.0% |
RTX’s 12.7% operating margin and 17.0% EBITDA margin show a business that is earning solid spread on its revenue base, even if the 8.3% net margin still reflects interest, depreciation, and other below-EBITDA costs. ROA of 4.2% and ROE of 12.3% are respectable, but they are not so high that I would call the company a pure capital-efficiency winner. What matters most to me is that operating margin is holding up while revenue grows, because that is the clearest sign that the backlog is turning into profitable work rather than low-quality volume.
Valuation
RTX — Valuation Multiples
| Metric | Value |
|---|---|
| Current Share Price (USD) | 187.7 |
| Market Cap (USD Mil) | 252,920 |
| Enterprise Value (USD Mil) | 285,238 |
| Trailing P/E | 33.3 |
| Forward P/E | 23.9 |
| Price/Sales (TTM) | 2.7 |
| Price/Book (mrq) | 3.8 |
| EV/Revenue | 3.1 |
| EV/EBITDA | 17.9 |
| Beta (5Y Monthly) | 0.29 |
| FCF Yield % (TTM) | 3.9% |
| Forward EPS (USD) | 7.9 |
| Analyst Target Price – Low (USD) | 200 |
| Analyst Target Price – Mean (USD) | 234.1 |
| Analyst Target Price – High (USD) | 265 |
| # Analyst Opinions | 22 |
Source: Yahoo Finance
| Metric | Value |
|---|---|
| Current Share Price USD | 187.7 |
| Market Cap USD Mil | 252,920 |
| Enterprise Value USD Mil | 285,238 |
| Trailing P/E | 33.3 |
| Forward P/E | 23.9 |
| Price/Sales TTM | 2.7 |
| Price/Book mrq | 3.8 |
| EV/Revenue | 3.1 |
| EV/EBITDA | 17.9 |
| Beta 5Y Monthly | 0.29 |
| FCF Yield % TTM | 3.9% |
| Forward EPS USD | 7.9 |
| Analyst Target Price Low USD | 200 |
| Analyst Target Price Mean USD | 234.1 |
| Analyst Target Price High USD | 265 |
| Analyst Opinions | 22 |
RTX is not cheap. At 23.9x forward P/E, 17.9x EV/EBITDA, and a 3.9% FCF yield, the market is paying for durable cash generation and a backlog that should support earnings, but it is also leaving little room for disappointment. On my read, fair value sits around $200-$235, which is close to the analyst range of 200-$265 and slightly below the 234.1 mean because I weight the powder metal drag and execution risk more heavily than the consensus appears to. The implied EPS range is about $7.9-$8.8, anchored by the company’s 7.86 forward EPS and the current margin profile; that is not a cheap earnings base relative to peers, especially when the stock already trades at a premium multiple to the large-prime group. The valuation case is therefore balanced: the market is paying for quality, but not at a level that leaves much cushion if margins slip.
Leverage
RTX — Leverage & Coverage (Quarterly)
| Metric | Value |
|---|---|
| Total Debt/Equity % (mrq) | 57 |
| Current Ratio (mrq) | 1 |
| Total Debt (mrq, USD Mil) | 38,856 |
| Operating Cash Flow (TTM, USD Mil) | 14,206 |
| Levered Free Cash Flow (TTM, USD Mil) | 9,880 |
| Net Debt/EBITDA (TTM) | 1.9 |
| FCF Margin % (TTM) | 10.6% |
Source: Yahoo Finance — Quarterly Financial Statements
| Metric | Value |
|---|---|
| Total Debt/Equity % mrq | 57 |
| Current Ratio mrq | 1 |
| Total Debt mrq USD Mil | 38,856 |
| Operating Cash Flow TTM USD Mil | 14,206 |
| Levered Free Cash Flow TTM USD Mil | 9,880 |
| Net Debt/EBITDA TTM | 1.9 |
| FCF Margin % TTM | 10.6% |
Leverage is manageable, not a source of stress. Total debt of $38.9B and net debt/EBITDA of 1.9x are acceptable for a company with this cash flow base, and $14.2B of operating cash flow plus $9.9B of levered free cash flow show that the balance sheet is being supported by real earnings power. The current ratio of 1.011 is the one number that keeps me cautious, because it leaves little liquidity cushion if the powder metal issue or a government funding delay hits at the wrong time. In other words, the balance sheet is serviceable, but it is not so strong that it can absorb a prolonged operational miss without consequences.
Insider Activity
| Date | Insider | Role | Type | Shares | Price |
|---|---|---|---|---|---|
| 2026-02-23 | Williams Dantaya M | EVP & Chief HR Officer | S | 12,713 | $202.83 |
| 2026-02-19 | Calio Christopher T. | Chairman, President an | S | 1,041 | $205.25 |
| 2026-02-19 | Calio Christopher T. | Chairman, President an | S | 11,420 | $204.70 |
| 2026-02-19 | Calio Christopher T. | Chairman, President an | S | 51,107 | $203.57 |
| 2026-02-19 | Maharajh Ramsaran | EVP and General Counse | S | 15,124 | $204.65 |
| 2026-02-19 | Mitchill Neil G. JR | EVP, Chief Financial O | S | 5,921 | $205.54 |
| 2026-02-19 | Mitchill Neil G. JR | EVP, Chief Financial O | S | 6,303 | $205.54 |
| 2026-02-19 | Mitchill Neil G. JR | EVP, Chief Financial O | S | 23,531 | $205.57 |
The insider record is clearly net selling: 26 open-market sales versus 1 open-market purchase, with $61.8M of sales against $23,580 of buying over the 2025-02-05 to 2026-02-23 window. Because the selling is broad and includes senior executives, I read it as a mild negative signal rather than a one-off tax event. It does not break the thesis, but it does tell me management is not leaning into the stock at these levels.
Comparable Analysis
LF0 has published standalone analyses of these peers: L3Harris Technologies (LHX) (rated Sell).
Growth
| Company | Revenue TTM (USD Mil) | Revenue Growth YoY % | EBITDA TTM (USD Mil) | Diluted EPS TTM |
|---|---|---|---|---|
| RTX | 93,500 | 14.5% | 15,895 | 5.6 |
| LMT | 77,014 | 10.5% | 9,680 | 27 |
| KTOS | 1,522.5 | 30.5% | 87 | 0.2 |
| NOC | 42,892 | 5.1% | 7,255 | 31.4 |
| GD | 54,861 | 8.1% | 6,633 | 16.3 |
| LHX | 22,932 | 8.4% | 4,142 | 9.9 |
Source: Yahoo Finance
RTX’s 14.5% revenue growth is ahead of LMT at 10.5%, GD at 8.1%, LHX at 8.4%, and NOC at 5.1%, while KTOS is faster at 30.5%. That puts RTX in the upper tier of the large-prime group, but not in the highest-growth bucket overall. The important connection is that RTX’s stronger growth is already paired with a much larger revenue base, so the market is paying for scale and execution rather than just a faster percentage rate.
Valuation
| Company | Current Share Price (USD) | Trailing P/E | Forward P/E | EV/Revenue | EV/EBITDA | Price/Sales (TTM) | Price/Book (mrq) | Market Cap (USD Mil) | Enterprise Value (USD Mil) | Beta (5Y Monthly) | FCF Yield % (TTM) | Forward EPS | Analyst Target Price – Low | Analyst Target Price – Mean | Analyst Target Price – High | # Analyst Opinions |
|---|---|---|---|---|---|---|---|---|---|---|---|---|---|---|---|---|
| RTX | 187.7 | 33.3 | 23.9 | 3.1 | 17.9 | 2.7 | 3.8 | 252,920 | 285,238 | 0.29 | 3.9% | 7.9 | 200 | 234.1 | 265 | 22 |
| LMT | 518.1 | 19.2 | 15.8 | 1.8 | 14.1 | 1.6 | 13.6 | 119,573 | 136,320 | 0.10 | 4.7% | 32.8 | 503 | 636.7 | 756 | 19 |
| KTOS | 44.1 | 275.4 | 40 | 4.6 | 80.8 | 5.4 | 2.4 | 8,273 | 7,029 | 1.11 | -1.4% | 1.1 | 60 | 102.8 | 150 | 21 |
| NOC | 505.8 | 16.2 | 16.6 | 2 | 11.9 | 1.7 | 4 | 71,855 | 86,600 | -0.11 | 3.5% | 30.5 | 538 | 644.5 | 815 | 22 |
| GD | 334.2 | 20.5 | 18 | 1.7 | 14.4 | 1.6 | 3.4 | 90,409 | 95,419 | 0.32 | 4.9% | 18.6 | 319 | 420.3 | 465 | 21 |
| LHX | 237.7 | 24 | 17.6 | 2.4 | 13.4 | 1.9 | 2.2 | 44,263 | 55,677 | 0.51 | 3.6% | 13.5 | 264 | 335.3 | 405 | 15 |
Source: Yahoo Finance
RTX trades at 3.1x EV/Revenue and 17.9x EV/EBITDA, versus LMT at 1.8x and 14.1x, NOC at 2.0x and 11.9x, GD at 1.7x and 14.4x, and LHX at 2.4x and 13.4x. On a one-year basis, a $1 investment would be worth $1.16 in RTX, compared with $1.27 in LMT, $1.16 in GD, $0.86 in NOC, $0.82 in LHX, and $0.50 in KTOS. That tells me RTX is not the cheapest name in the group, and the stock’s recent performance already reflects some of the recovery that still needs to prove itself in earnings.
Profitability
| Company | Operating Margin (TTM) | Net Margin (TTM) | Return on Assets (TTM) | Return on Equity (TTM) | Gross Margin (TTM) | EBITDA Margin (TTM) |
|---|---|---|---|---|---|---|
| RTX | 12.7% | 8.3% | 4.2% | 12.3% | 20.3% | 17.0% |
| LMT | 12.0% | 8.2% | 8.6% | 89.2% | 11.8% | 12.6% |
| KTOS | -0.2% | 2.0% | 0.4% | 1.1% | 23.0% | 5.7% |
| NOC | 11.6% | 10.5% | 7.1% | 27.0% | 20.1% | 16.9% |
| GD | 10.4% | 8.2% | 6.1% | 17.8% | 15.4% | 12.1% |
| LHX | 12.6% | 8.2% | 4.4% | 9.3% | 25.5% | 18.1% |
Source: Yahoo Finance
RTX’s 12.7% operating margin is above GD at 10.4% and NOC at 11.6%, roughly in line with LMT at 12.0% and LHX at 12.6%, while its 17.0% EBITDA margin is ahead of GD at 12.1% and LMT at 12.6%. ROE of 12.3% and ROA of 4.2% are solid, though not best in class, especially versus NOC’s 27.0% ROE and 7.1% ROA. I read that as a good but not dominant profitability profile: RTX earns enough to justify a premium, but not enough to demand one on profitability alone.
Leverage
| Company | Total Debt/Equity % (mrq) | Current Ratio (mrq) | Total Debt (mrq, USD Mil) | Operating Cash Flow TTM (USD Mil) | Free Cash Flow TTM (USD Mil) | Net Debt/EBITDA (TTM) | FCF Margin % (TTM) |
|---|---|---|---|---|---|---|---|
| RTX | 57 | 1 | 38,856 | 14,206 | 9,880 | 1.9 | 10.6% |
| LMT | 234.2 | 1.2 | 20,538 | 10,402 | 5,562.6 | 1.7 | 7.2% |
| KTOS | 5.7 | 5.5 | 193.6 | -39.6 | -118.3 | -14.3 | -7.8% |
| NOC | 95.3 | 1.2 | 17,052 | 5,078 | 2,478 | 2 | 5.8% |
| GD | 35.3 | 1.4 | 9,479 | 7,694 | 4,400.1 | 0.8 | 8.0% |
| LHX | 52.8 | 1.2 | 10,999 | 3,292 | 1,609 | 2.3 | 7.0% |
Source: Yahoo Finance
RTX’s 57.02% debt/equity and 1.9x net debt/EBITDA are higher than GD’s 35.3% and 0.8x, but below NOC’s 95.3% and 2.0x, LHX’s 52.8% and 2.3x, and far below LMT’s 234.2% debt/equity. RTX also posts a 10.6% FCF margin, which is better than LMT at 7.2%, NOC at 5.8%, GD at 8.0%, and LHX at 7.0%. That combination matters because it shows RTX is not just carrying leverage; it is generating enough cash to support it, which is why the balance sheet looks manageable rather than fragile.
Conclusion
I would put my rating as a Hold because RTX’s backlog, growth, and cash generation are real, but the valuation already reflects a lot of that strength and leaves limited room for operational slippage. The key tension is whether the company can keep turning a $268B backlog into margin expansion while the powder metal issue and government-program execution risk remain live.
I would raise my rating more towards a Buy if operating margin stays above 12.7% and free cash flow remains near 10.6% of revenue, because that would show the backlog is converting into cash faster than the market is assuming. If quarterly revenue can stay above the recent $24.7B run rate and EBIT can hold above roughly $3.2B, that would tell me the current earnings base is durable enough to support the present multiple and maybe more.
I would move from Hold to Sell if operating margin falls below 12.0% for two straight quarters, because that would suggest the powder metal drag and program friction are starting to overwhelm the business model. I would also turn more cautious if net debt to EBITDA moves back above 2.5x, meaning leverage is rising faster than cash flow and the balance sheet is losing flexibility.
For now, I think the bull case is credible but already partly in the price, while the bear case would not need a dramatic shock to matter. That leaves me cautious rather than constructive, and I would want to see another couple of quarters of stable margins and cash conversion before moving more aggressively positive.
What to Watch Next
- Operating margin above 12.7% — would support a move toward Buy.
- Free cash flow margin near 10.6% — would confirm backlog conversion is intact.
- Quarterly revenue above $24.7B — would show the growth run rate is holding.
- Net debt/EBITDA below 2.5x — would keep balance-sheet risk contained.
- Powder metal costs easing into 2027 — would reduce the main earnings overhang.
What’s your take? I rated RTX (RTX) HOLD above — but the goal here is to get this right, not just to publish an opinion. What would you add to this analysis, or which risk or catalyst do you think I’m under- or over-weighting? Tell me in the comments.
Sources
- SEC 10-K Annual Report — filed 2026-02-06
- SEC 8-K Filing (2026-05-04)
- SEC 8-K Filing (2026-04-21)
- SEC 8-K Filing (2026-03-05)
- SEC 8-K Filing (2026-01-27)
- SEC Form 4 Insider Transaction (2026-05-04)
- SEC Form 4 Insider Transaction (2026-05-04)
- SEC Form 4 Insider Transaction (2026-05-04)
- SEC 10-K Annual Report — FY2026
- SEC 10-K Annual Report — FY2025
- SEC 10-K Annual Report — FY2024
- SEC 10-K Annual Report — FY2023
- SEC 10-K Annual Report — FY2022
Data sourced from Yahoo Finance and SEC EDGAR. Not investment advice.
Leave a Comment