| Company | Sep 25 | Oct 25 | Nov 25 | Dec 25 | Jan 26 | Feb 26 | Mar 26 | Apr 26 | May 26 | Jun 26 | Jul 26 | Aug 26 | 12-Mo |
|---|---|---|---|---|---|---|---|---|---|---|---|---|---|
| ALAB | +7% | -5% | -16% | +6% | -9% | -21% | -8% | +78% | +76% | +41% | -36% | -5% | +63% |
| AVGO | +11% | +12% | +9% | -14% | -4% | -4% | -3% | +35% | +7% | -15% | +3% | -5% | +25% |
| ANET | +7% | +8% | -17% | +0% | +8% | -6% | -8% | +41% | -8% | +7% | +6% | +9% | +43% |
| CRDO | +18% | +29% | -5% | -19% | -13% | -10% | -16% | +85% | +36% | +15% | -24% | +9% | +84% |
| MRVL | +34% | +12% | -5% | -5% | -7% | +4% | +21% | +67% | +24% | +45% | -37% | +13% | +237% |
| NVDA | +7% | +9% | -13% | +5% | +2% | -7% | -2% | +14% | +6% | -5% | +0% | +10% | +27% |
Source: Yahoo Finance monthly adjusted close.
Quick Thesis
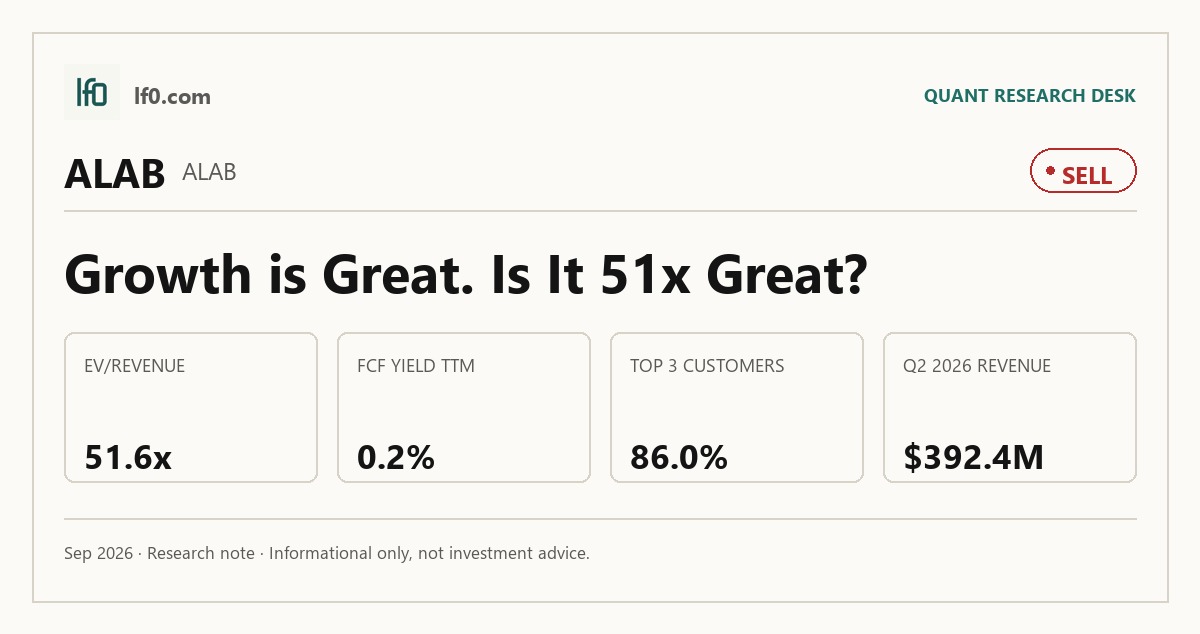
- Rated Sell — valuation already discounts a long AI ramp.
- Strongest point: Q2 2026 revenue reached $392.4M, up 104.5% year over year.
- Biggest risk: one customer was more than 70.0% of 2025 revenue.
- Valuation is rich: 51.6x EV/Revenue and 0.2% FCF yield.
- I would turn more constructive only if revenue stays above $400M and FCF yield moves above 1.0%.
Executive Summary
Rating: SELL | ALAB
We’ll begin tracking this call’s performance since publication once sufficient adjusted-close data is available.
I would put my rating as a Sell because Astera Labs is priced for a long runway of AI infrastructure demand, yet the current numbers do not justify that premium. Revenue reached $392.4M in Q2 2026 and grew 104.5% year over year, but the stock still trades at 51.6x EV/Revenue, 57.0x forward P/E, and only a 0.2% FCF yield TTM, so investors are paying for a much cleaner cash conversion profile than the business has delivered so far.
I would raise my rating more towards a Buy if revenue growth stayed above 70.0% for the next two quarters, meaning the company keeps compounding at a pace that can support the current multiple, and if operating margin moved closer to 30.0%, which would show the model is scaling into real operating leverage rather than just top-line expansion. If the Amazon warrant translates into a larger product ramp and the top customer concentration starts to ease from 86.0% of revenue, the thesis would become more durable.
Company Profile
Astera Labs designs and sells semiconductor-based connectivity products for cloud and AI infrastructure. Its fabless model covers integrated circuits, boards, and modules that move data, memory, and network traffic inside data centers, while its Intelligent Connectivity Platform adds COSMOS software for configuration, monitoring, troubleshooting, and optimization. The company was founded in 2017, went public in 2024, and trades on Nasdaq under ALAB.
It serves hyperscalers, AI accelerator vendors, and system OEMs, with products deployed worldwide through data center systems. As of 2025, it had 756 full-time employees and research and development offices in the United States, Canada, Germany, India, Israel, Singapore, and Vietnam. The company relies on third-party manufacturing partners, including Taiwan Semiconductor Manufacturing Company (TSMC), and it funds the business through public equity rather than a debt-heavy capital structure.
Economic Moat
Business Model
I feel the software-defined connectivity stack is the hardest part for a rival to copy quickly, because Astera Labs combines mixed-signal silicon, embedded software, and interoperability work into one platform already deployed across cloud and AI infrastructure. According to their SEC filings, the Intelligent Connectivity Platform includes ICs, boards, modules, and the COSMOS software suite, which lets customers configure, manage, monitor, optimize, troubleshoot, and customize products in production systems.
That platform is more defensible than a single chip because the value comes from working inside hyperscaler environments, not just from the silicon itself. The company also has a second layer of defense in customer and ecosystem integration: it works directly with hyperscalers, leading AI accelerator vendors, system OEMs, and data center infrastructure suppliers through the Interop Lab, and its top three end customers represented approximately 86.0% of revenue in 2025, which shows both deep design-in exposure and concentration risk.
Business & Operating Risks
The most material risk is customer concentration. In 2025, one end customer represented more than 70.0% of revenue and the top three end customers represented approximately 86.0% of revenue, so a single design change, demand pause, or sourcing shift at one hyperscaler can move the entire revenue base. The filing also says customers can redesign systems to use fewer or none of Astera’s products with limited notice, and the master agreements do not require minimum purchases, which makes the revenue stream fragile even before competition enters the picture.
The second risk is dependence on a single foundry chain led by TSMC, which is the sole manufacturing partner for integrated circuits and has no qualified alternate source. If TSMC cannot supply enough wafers, Astera could have difficulty fulfilling orders and revenue could decline, and the foundry is in Taiwan, where earthquake and geopolitical disruption could delay production or shipment. Product and market transition risk is also real, especially around AI infrastructure and new standards such as Compute Express Link (CXL) and UALink, because the company may not keep up with evolving requirements.
Trade with China is another clear headwind. Adverse changes in political, regulatory, and economic policies tied to China have already reduced demand for Astera’s products and damaged the business, and export controls, tariffs, and license requirements can block sales or force customers to stockpile inventory. The disclosed risks do not directly threaten the software platform moat itself, but they do threaten the customer concentration and supply-chain pillars that make that moat commercially valuable.
Management Discussion & Analysis
Management is signalling that it wants to keep funding growth, not de-risk the balance sheet. Cash, cash equivalents, and marketable securities were $1.2B as of December 31, 2025, and management says that pool should fund operations for at least the next 12 months and beyond, which gives Astera Labs room to keep investing rather than cut back. The same filing says research and development expense rose to $304M in 2025 from $200.8M in 2024, and management expects R&D, sales and marketing, and general and administrative expense to keep rising in absolute dollars, so investors should read the 2025 profitability swing as scale-driven, not as a sign of cost discipline.
The revenue mix also matters. 2025 revenue of $852.5M increased 115.0% because of higher unit shipments of Aries, Scorpio, and Taurus products plus a richer mix of hardware modules and Scorpio products, which supports the AI-connectivity thesis, but gross margin still slipped 70 bps to 75.7% because the mix shifted toward lower-margin hardware modules. Management is leaning on non-GAAP presentation, with non-GAAP operating margin at 39.2% versus GAAP operating margin of 20.3%, so the business is profitable on an adjusted basis but still carries heavy stock-based compensation and public-company overhead.
Management is responding to the concentration and execution risks, but not eliminating them. The cash balance and internally funded capex show discipline, yet the company is still committing cash to scale rather than returning it to shareholders, and the margin mix tells me the next leg of growth has to come with better operating leverage if the thesis is going to hold.
Recent Events
The most significant development I see here is the February 5, 2026 warrant deal with Amazon.com, Inc. and Amazon.com NV Investment Holdings LLC, which gives Amazon the right to acquire up to 3.3 million shares at $142.82 through February 5, 2033 if it buys up to $6.5B of Astera Labs’ smart fabric switch, signal conditioning, and optical engine products. In my view, that strengthens the thesis because it ties a large customer to future product demand and extends commercial visibility, although the warrant also caps some upside through dilution if the performance tranches are met.
The second clear signal is leadership continuity with a finance reset. On February 4, 2026, Michael Tate announced his retirement as Chief Financial Officer effective March 2, 2026, and Desmond Lynch was appointed to replace him, with a $500,000 base salary, a 95% bonus target, and equity awards totaling $9M. I read that as a neutral-to-positive governance move: the transition looks orderly, but the new CFO will need to support execution through a period of customer concentration and rapid scaling.
Astera also held its 2026 Annual Stockholders Meeting on June 4, 2026, and shareholders re-elected all three Class II directors, approved say-on-pay, and backed annual say-on-frequency. That outcome supports board continuity rather than strategic change, and the recent filings overall are modestly positive because the Amazon warrant deepens a key customer relationship while the leadership transition appears controlled.
Financial Analysis
Growth
ALAB — Financial Growth (Quarterly, USD Mil)
| Metric | 2025-06-30 | 2025-09-30 | 2025-12-31 | 2026-03-31 | 2026-06-30 |
|---|---|---|---|---|---|
| REVENUE (USD Mil) | 191.9 | 230.6 | 270.6 | 308.4 | 392.4 |
| EBIT (USD Mil) | 39.8 | 55.4 | 67 | 61.8 | 89.2 |
| EBITDA (USD Mil) | 41.2 | 56.9 | 69.8 | 65.5 | 93.2 |
| NET INCOME (USD Mil) | 51.2 | 91.1 | 45 | 80.3 | 153.1 |
| DILUTED EPS | 0.3 | 0.5 | 0.2 | 0.4 | 0.8 |
Source: Yahoo Finance — Quarterly Financial Statements
Revenue accelerated across the last five quarters: $191.9M in Q2 2025, $230.6M in Q3 2025, $270.6M in Q4 2025, $308.4M in Q1 2026, and $392.4M in Q2 2026. That is 104.5% growth from Q2 2025 to Q2 2026, so the top line is still compounding at a pace that supports a growth lens rather than a value lens.
EBITDA rose to $93.2M in Q2 2026 from $65.5M in Q1 2026, while net income jumped to $153M and diluted EPS to 0.83. The step-up looks like real demand momentum, not a one-quarter anomaly, and it is consistent with the prior-year disclosure that Aries, Scorpio, and Taurus shipments would drive scale.
Profitability
ALAB — Profitability (TTM)
| Metric | TTM |
|---|---|
| Operating Margin (TTM) | 22.7% |
| Net Margin (TTM) | 30.7% |
| Return on Assets (TTM) | 10.7% |
| Return on Equity (TTM) | 25.8% |
| Gross Margin (TTM) | 75.1% |
| EBITDA Margin (TTM) | 23.8% |
Source: Yahoo Finance — Trailing Twelve Months (TTM)
Astera Labs’ TTM operating margin of 22.7%, gross margin of 75.1%, and EBITDA margin of 23.8% show a business with strong product economics. The gap between gross margin and operating margin is 52.4 percentage points, which means operating expenses are still heavy, but the model is already producing meaningful profit at scale.
TTM net margin of 30.7% and TTM ROE of 25.8% are both above TTM ROA of 10.7%, so returns are being amplified by balance-sheet structure as well as underlying profitability. The positive spread between gross margin and EBITDA margin also suggests the company is converting a large share of revenue into cash earnings before non-cash charges, and that supports the moat thesis because the platform is not just growing, it is monetizing.
Valuation
ALAB — Valuation Multiples
| Metric | Value |
|---|---|
| Current Share Price (USD) | 364.6 |
| Market Cap (USD Mil) | 63,256 |
| Enterprise Value (USD Mil) | 62,048 |
| Trailing P/E | 178.7 |
| Forward P/E | 57 |
| Price/Sales (TTM) | 52.6 |
| Price/Book (mrq) | 36.7 |
| EV/Revenue | 51.6 |
| EV/EBITDA | 217.4 |
| Beta (5Y Monthly) | 3.78 |
| FCF Yield % (TTM) | 0.1% |
| Forward EPS (USD) | 6.4 |
| Analyst Target Price – Low (USD) | 190 |
| Analyst Target Price – Mean (USD) | 390 |
| Analyst Target Price – High (USD) | 500 |
| # Analyst Opinions | 23 |
Source: Yahoo Finance
Astera Labs screens as a growth and momentum name, so the market is valuing the stock on revenue and cash generation rather than earnings multiples. At the current share price of $364.6, the stock trades at 51.6x EV/Revenue, 52.6x Price/Sales (TTM), 217.4x EV/EBITDA, 178.7x trailing P/E, and 57.0x forward P/E. Those are demanding levels for a company with a 0.2% FCF yield TTM, which means investors are paying for a long runway of sustained AI infrastructure demand and continued margin expansion, not for near-term cash return.
The balance sheet is not the constraint: total cash per share is 7.2 and book value per share is 10.0, while net debt/EBITDA is -4.2x and the current ratio is 10.1x. That leaves the valuation debate squarely on execution, not solvency. Analyst coverage is broad, with 23 opinions and a consensus target range of $190.0 to $500.0, centered at $390.0. My read is that the market is already pricing in several years of very high growth and strong profitability, so the valuation signal is bearish unless that trajectory keeps compounding.
On my read of the numbers here, fair value sits well below the current quote because the company’s growth is excellent but the cash conversion is still thin. I would put a rough fair-value range at $22-$34 per share on a peer EV/Revenue frame, and that sits far below the $390.0 analyst mean because I weight the 0.2% FCF yield and the 86.0% customer concentration more heavily than the consensus appears to. Forward EPS of 6.39 is solid, but it is not enough to justify a 57.0x forward multiple unless the market believes the earnings base can compound much faster than peers. Relative to AVGO’s $19.4, ANET’s $5.2, CRDO’s $9.7, MRVL’s $6.8, and NVDA’s $15.7 forward EPS, Astera’s earnings power is improving but still not enough to make the current multiple look cheap on a like-for-like basis.
Leverage
ALAB — Leverage & Coverage (Quarterly)
| Metric | Value |
|---|---|
| Total Debt/Equity % (mrq) | 2.6 |
| Current Ratio (mrq) | 10.1 |
| Total Debt (mrq, USD Mil) | 44.4 |
| Operating Cash Flow (TTM, USD Mil) | 335.7 |
| Levered Free Cash Flow (TTM, USD Mil) | 91.9 |
| Net Debt/EBITDA (TTM) | -4.2 |
| FCF Margin % (TTM) | 7.6% |
Source: Yahoo Finance — Quarterly Financial Statements
Astera Labs has very little balance-sheet strain and a strong cash buffer. Total debt to equity is 2.6%, current ratio is 10.1x, and total debt is $44.4M, which means near-term liquidity is ample and refinancing pressure is limited. Operating cash flow is $335.7M, levered free cash flow is $91.9M, net debt/EBITDA is -4.2x, and FCF margin is 7.7%.
EBITDA converts to cash, but not perfectly: the gap between $335.7M of operating cash flow and $91.9M of free cash flow shows capital spending still absorbs a meaningful share of cash. In my opinion, this is low refinancing risk because cash exceeds debt and the current ratio is 10.1x, so the company has room to absorb a downturn before any funding issue becomes near term.
Insider Activity
The insider transaction record I see here is one-sided: 0 open-market purchases versus 377 open-market sales from 2025-02-18 to 2026-06-04. Activity is concentrated in a few insiders, especially Jack R. Lazar and Stefan A. Dyckerhoff, which means the selling signal is broad enough to matter but still led by repeated sales from a small group.
In my view, that is a bear signal because insiders are net sellers with no offsetting open-market buying, which weakens alignment with shareholders. It does not change the operating thesis by itself, but it does matter when the stock already trades at a premium multiple.
Comparable Analysis
Growth
| Company | Revenue TTM (USD Mil) | Revenue Growth YoY % | Diluted EPS TTM |
|---|---|---|---|
| ALAB | 1,201.9 | 104.5% | 2 |
| AVGO | 89,104 | 85.5% | 7.8 |
| ANET | 10,540.8 | 37.7% | 3.1 |
| CRDO | 1,591 | 114.7% | 2.9 |
| MRVL | 9,450.3 | 36.5% | 3 |
| NVDA | 302,970 | 105.9% | 7.9 |
Source: Yahoo Finance
ALAB’s revenue growth of 104.5% TTM sits above AVGO’s 85.5%, ANET’s 37.7%, MRVL’s 36.5%, and is just below NVDA’s 105.9%, while CRDO is the only peer ahead at 114.7%. That puts ALAB in the top tier of the set, so the growth premium is justified, but only if investors believe the earnings ramp can keep translating into revenue rather than fading as the base gets larger.
Valuation
| Company | Current Share Price (USD) | Trailing P/E | Forward P/E | EV/Revenue | EV/EBITDA | Price/Sales (TTM) | Price/Book (mrq) | Market Cap (USD Mil) | Enterprise Value (USD Mil) | Beta (5Y Monthly) | FCF Yield % (TTM) | Forward EPS | Analyst Target Price – Low | Analyst Target Price – Mean | Analyst Target Price – High | # Analyst Opinions |
|---|---|---|---|---|---|---|---|---|---|---|---|---|---|---|---|---|
| ALAB | 364.6 | 178.7 | 57 | 51.6 | 217.4 | 52.6 | 36.7 | 63,256 | 62,048 | 3.78 | 0.1% | 6.4 | 190 | 390 | 500 | 23 |
| AVGO | 352.8 | 45.1 | 18.2 | 19.3 | 32.9 | 18.9 | 16.9 | 1,684,184 | 1,719,628 | 1.46 | 1.8% | 19.4 | 215.9 | 531.8 | 715 | 47 |
| ANET | 206.6 | 65.6 | 39.8 | 23.4 | 53.3 | 24.7 | 17.6 | 260,506 | 247,163 | 1.62 | 1.5% | 5.2 | 190 | 241.9 | 289 | 28 |
| CRDO | 211 | 74 | 21.7 | 24.5 | 71.6 | 24.9 | 14.5 | 39,652 | 38,914 | 3.23 | 0.6% | 9.7 | 185 | 280.1 | 350 | 19 |
| MRVL | 261.9 | 87 | 38.8 | 24.4 | 81.1 | 24.9 | 12.6 | 235,402 | 231,044 | 2.25 | 1.0% | 6.8 | 210 | 289.8 | 400 | 43 |
| NVDA | 225.1 | 28.5 | 14.4 | 17.8 | 26.8 | 17.9 | 23.7 | 5,434,765 | 5,400,578 | 2.22 | 0.8% | 15.7 | 180 | 327.7 | 515 | 59 |
Source: Yahoo Finance
ALAB trades at 51.6x EV/Revenue, 178.7x trailing P/E, 57.0x forward P/E, and a 0.2% FCF yield TTM, versus AVGO at 19.3x, 45.1x, 18.2x, and 1.8%, ANET at 23.4x, 65.6x, 39.8x, and 1.5%, CRDO at 24.5x, 74.0x, 21.7x, and 0.6%, MRVL at 24.4x, 87.0x, 38.8x, and 1.0%, and NVDA at 17.8x, 28.5x, 14.4x, and 0.8%. On those numbers ALAB is the most expensive name in the group by a wide margin, and the implied premium is hard to defend because its forward EPS of 6.39 is only modestly above CRDO’s $9.7 and below AVGO’s $19.4, so the market is paying for a much faster earnings ramp than the peer set is actually showing.
Using the peer EV/Revenue range of 17.8x to 24.5x on ALAB’s $1.2B revenue implies roughly $4.9B to $7B of enterprise value, or about $22 to $34 per share after net cash and shares outstanding, well below the current $364.6 price. That gap says the stock is priced for a very large step-up in scale that is not yet visible in the consensus numbers.
Profitability
| Company | Operating Margin (TTM) | Net Margin (TTM) | Return on Assets (TTM) | Return on Equity (TTM) | Gross Margin (TTM) | EBITDA Margin (TTM) |
|---|---|---|---|---|---|---|
| ALAB | 22.7% | 30.7% | 10.7% | 25.8% | 75.1% | 23.8% |
| AVGO | 54.3% | 42.9% | 15.4% | 44.2% | 75.5% | 58.7% |
| ANET | 45.4% | 38.4% | 14.1% | 31.5% | 63.0% | 44.0% |
| CRDO | 25.2% | 33.8% | 16.1% | 30.7% | 67.1% | 34.1% |
| MRVL | 16.7% | 27.9% | 4.1% | 16.5% | 52.2% | 30.2% |
| NVDA | 66.2% | 63.7% | 53.6% | 117.2% | 74.7% | 66.4% |
Source: Yahoo Finance
ALAB’s gross margin of 75.1% is in line with AVGO’s 75.5% and NVDA’s 74.7%, but its operating margin of 22.7% trails AVGO’s 54.3%, ANET’s 45.4%, CRDO’s 25.2%, and NVDA’s 66.2%, which points to a scale and opex gap rather than a cost-of-revenue problem. Net margin tells the same story: ALAB at 30.7% is respectable, yet still below AVGO’s 42.9% and NVDA’s 63.7%, so the business looks competitive at the gross line but not yet at the operating leverage level that would justify a top-of-group multiple.
Leverage
| Company | Total Debt/Equity % (mrq) | Current Ratio (mrq) | Total Debt (mrq, USD Mil) | Operating Cash Flow TTM (USD Mil) | Free Cash Flow TTM (USD Mil) | Net Debt/EBITDA (TTM) | FCF Margin % (TTM) |
|---|---|---|---|---|---|---|---|
| ALAB | 2.6 | 10.1 | 44.4 | 335.7 | 91.9 | -4.2 | 7.6% |
| AVGO | 59.6 | 2.5 | 59,419 | 40,653 | 30,596.5 | 0.7 | 34.3% |
| ANET | — | 3 | 0 | 5,306.6 | 3,891.5 | -2.9 | 36.9% |
| CRDO | 1 | 7.4 | 26.2 | 500.4 | 248.3 | -1.4 | 15.6% |
| MRVL | 28.5 | 3.2 | 5,286.1 | 2,200.3 | 2,408.1 | 0.5 | 25.5% |
| NVDA | 17 | 4.6 | 38,860 | 134,360 | 41,809.9 | -0.1 | 13.8% |
Source: Yahoo Finance
ALAB’s total debt to equity of 2.6% and net debt to EBITDA of -4.2x are cleaner than AVGO’s 59.6% and 0.7x, ANET’s negative 2.9x, CRDO’s negative 1.4x, MRVL’s 0.5x, and NVDA’s -0.1x, while its FCF margin of 7.7% trails AVGO’s 34.3%, ANET’s 36.9%, CRDO’s 15.6%, MRVL’s 25.5%, and NVDA’s 13.8%. The balance sheet is effectively cash net of debt, which is a structural strength, but the lower FCF margin means the company is not yet converting its revenue base into cash as efficiently as the better-capitalized peers.
Conclusion
The tension in this name is simple: Astera Labs is growing fast enough to deserve attention, but the stock already prices in a far cleaner earnings and cash conversion path than the company has actually shown. Revenue reached $392.4M in Q2 2026 and grew 104.5% over the last year, yet the shares still trade at 51.6x EV/Revenue, 57.0x forward P/E, and only a 0.2% FCF yield TTM, so the burden of proof remains on management to keep compounding without margin leakage.
I would raise my rating more towards a Buy if revenue growth stayed above 70.0% for the next two quarters, meaning the company keeps compounding at a pace that can support the current multiple, and if operating margin moved closer to 30.0%, which would show the model is scaling into real operating leverage rather than just top-line expansion. A second positive trigger would be free cash flow turning meaningfully higher from the current $91.9M TTM, because that would tell me the company is converting its AI design wins into cash rather than just accounting earnings. If the Amazon warrant translates into a larger product ramp and the top customer concentration starts to ease from 86.0% of revenue, the thesis would become more durable.
I would move from Sell to Strong Sell if revenue growth drops below 50.0% for a full quarter, because that would signal the market is no longer getting the hypergrowth it is paying for, or if gross margin slips materially below 75.0%, which would show pricing or mix pressure is starting to erode the platform economics. A sharper warning sign would be a loss of one major hyperscaler socket, since one customer already represented more than 70.0% of revenue in 2025 and the business has limited minimum purchase protection. In that case, the current valuation would look exposed to a much slower earnings path than the market is discounting.
Weighing both sides, I think the bear case is more likely to show up first because the stock already discounts several years of flawless execution, while the company still has to prove that growth can stay this fast without margin leakage or customer concentration risk biting. The balance sheet gives Astera Labs time, but it does not make the shares cheap, and I would need a clear step-up in cash generation before I would get more constructive.
What to Watch Next
- Revenue above $400M next quarter — would support the growth case.
- Operating margin near 30.0% — would show real operating leverage.
- FCF above $91.9M TTM — would strengthen the cash-conversion case.
- Customer concentration easing below 86.0% of revenue — would reduce single-customer risk.
- Gross margin holding above 75.0% — would show mix and pricing are still intact.
What’s your take? I rated Astera Labs (ALAB) SELL above — but the goal here is to get this right, not just to publish an opinion. What would you add to this analysis, or which risk or catalyst do you think I’m under- or over-weighting? Tell me in the comments.
Sources
- SEC 10-K Annual Report — filed 2026-02-20
- SEC 8-K Filing (2026-06-08)
- SEC 8-K Filing (2026-05-05)
- SEC 8-K Filing (2026-02-10)
- SEC 8-K Filing (2026-02-10)
- SEC 8-K Filing (2026-02-10)
- SEC 8-K Filing (2026-01-20)
- SEC Form 4 Insider Transaction (2026-06-08)
- SEC Form 4 Insider Transaction (2026-06-08)
- SEC Form 4 Insider Transaction (2026-06-08)
- SEC 10-K Annual Report — FY2026
- SEC 10-K Annual Report — FY2025
Data sourced from Yahoo Finance and SEC EDGAR. Not investment advice.
Leave a Comment