| Company | Sep 25 | Oct 25 | Nov 25 | Dec 25 | Jan 26 | Feb 26 | Mar 26 | Apr 26 | May 26 | Jun 26 | Jul 26 | Aug 26 | 12-Mo |
|---|---|---|---|---|---|---|---|---|---|---|---|---|---|
| ICHR | +4% | +29% | -26% | +10% | +65% | +57% | -2% | +42% | +8% | +57% | -33% | -29% | +218% |
| TER | +17% | +32% | +0% | +6% | +25% | +33% | -7% | +16% | +9% | +29% | -24% | -5% | +197% |
| AMAT | +27% | +14% | +8% | +2% | +25% | +16% | -8% | +15% | +14% | +61% | -30% | -10% | +187% |
| LRCX | +34% | +18% | -1% | +10% | +36% | +0% | -9% | +21% | +23% | +36% | -32% | +3% | +203% |
| KLAC | +24% | +12% | -3% | +3% | +18% | +7% | -3% | +19% | +10% | +57% | -39% | -4% | +102% |
| UCTT | +13% | +1% | -7% | -0% | +72% | +39% | +2% | +26% | +9% | +67% | -42% | -19% | +182% |
Source: Yahoo Finance monthly adjusted close.
Quick Thesis
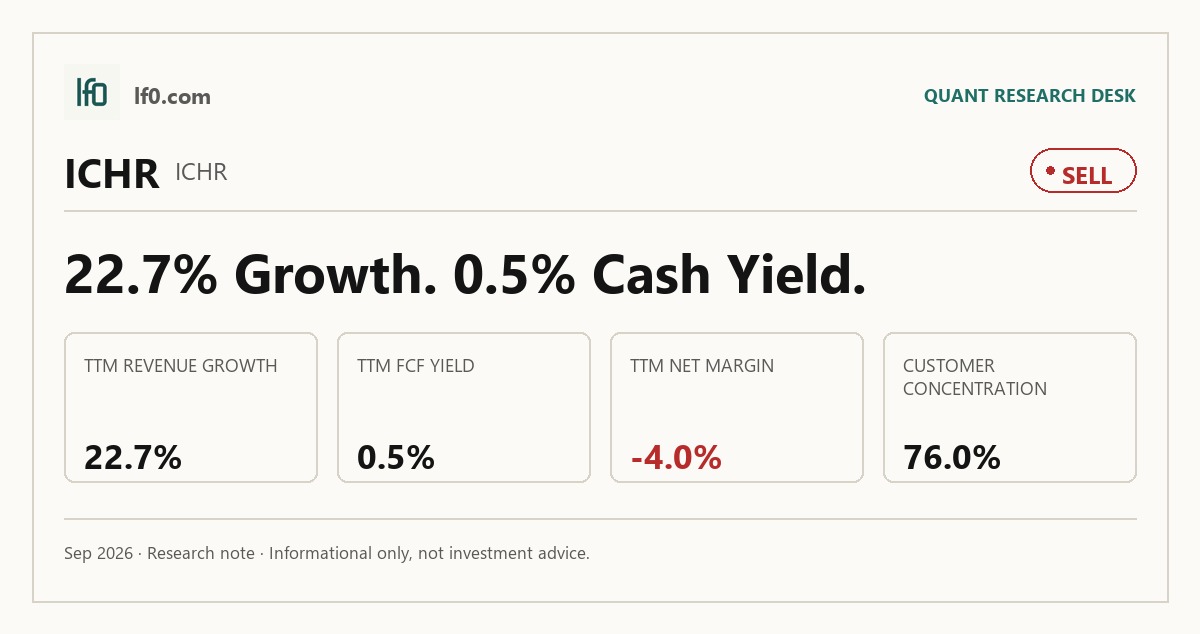
- Rated sell because the recovery is real, but valuation already discounts it.
- Revenue reached $294.8M in Q2 2026, with net income turning positive at $1M.
- Main risk: FCF yield was only 0.5% TTM, so cash conversion is still weak.
- Shares trade at 2.0x EV/revenue and 17.7x forward P/E.
- I would turn more constructive only if operating margin stays positive and FCF yield moves above 2.0%.
Executive Summary
Rating: SELL | ICHR
We’ll begin tracking this call’s performance since publication once sufficient adjusted-close data is available.
I would put my rating as a sell because Ichor’s cyclical rebound is visible in the numbers, but the stock already prices in more cash generation than the business is producing. Revenue rose to $294.8M in Q2 2026 and net income turned positive at $1M, yet TTM operating margin was only 2.8% and FCF yield was 0.5%, so the equity still looks expensive relative to the quality of earnings.
Ichor designs and manufactures fluid-delivery subsystems and precision components for semiconductor capital equipment, with a smaller industrial and aerospace mix. The business matters because it is specified into the tool early, which gives it some design-in stickiness, but that same model leaves it exposed to a concentrated customer base and a volatile capex cycle.
I would move from sell toward hold only if operating margin stays positive for several quarters and FCF yield moves above 2.0%, meaning the rebound is translating into real cash rather than just a better quarter.
Company Profile
Ichor Holdings designs and manufactures critical fluid-delivery subsystems and precision components for semiconductor capital equipment. Its core products include gas delivery systems for etch and deposition tools, chemical delivery systems for CMP, electroplating, and cleaning, plus weldments, valves, flow-control products, and precision-machined parts sold into defense, aerospace, medical, and industrial markets.
The company was incorporated as Celerity in 1999, formed Ichor Holdings in the Cayman Islands in 2012, and listed on Nasdaq in 2016. It operates in the United States, Singapore, Malaysia, and Mexico, with clean rooms in Singapore, Oregon, and Texas and manufacturing sites near major OEM customers. At December 26, 2025, it had 1,891 full-time employees and 557 contingent workers.
Economic Moat
Business Model
Ichor’s moat is built on design-in position, not on a broad product catalog. In my view, the hardest thing for a competitor to copy quickly is the precision of its fluid-delivery subsystems once they are embedded in an OEM’s tool architecture, because Ichor works inside customer drawing standards and can become sole source during the initial production ramp.
That early engagement is reinforced by engineering depth, customer collaboration, and manufacturing sites near customers, which makes switching costly for Lam Research, Applied Materials, and ASML. The company also has 103 granted patents and 105 pending applications, with granted expirations running from 2027 to 2043, plus ISO 9001, AS9100, and ITAR-compliant facilities that raise qualification barriers.
Business & Operating Risks
The biggest disclosed risk is customer concentration. According to the risk factors in their SEC 10-K, Lam Research and Applied Materials accounted for 76.0% of 2025 sales, and there are no long-term contracts with minimum volumes. That means a delay, cancellation, or insourcing decision by either customer can hit revenue quickly.
Pricing pressure is the next issue. Customers often demand price cuts and delivery commitments, while new products usually carry lower gross margins for several quarters after launch. Supply chain disruption is also a real risk because Ichor depends on a limited supplier base and often receives orders shortly before shipment, which raises the chance of inventory build and write-downs if demand slips.
The disclosed risks do threaten the moat, but they do so through customer concentration and pricing power rather than by breaking the design-in advantage itself.
Management Discussion & Analysis
Management is responding to those risks with a lower-cost footprint and tighter capital discipline. The 2025 restructuring moved machining assets into larger facilities, closed sites in Scotland and Korea, and produced $35M of restructuring, exit, severance, and asset-impairment charges, so the company is clearly trying to simplify the cost base.
That said, the margin data shows the reset is not finished. Gross margin fell to 9.3% in 2025 from 12.2% in 2024, and operating margin worsened to -4.1% from -0.9%, so the restructuring has not yet translated into durable earnings power. Management’s message is constructive on demand, but the numbers still show a business that needs more than one good quarter to prove the turnaround.
Recent Events
The most important recent event is the May 18, 2026 at-the-market equity facility for up to $200M. I read that as a balance-sheet backstop: it gives management flexibility to repay debt and fund corporate needs, but it also signals a willingness to dilute shareholders if needed.
The May 14, 2026 annual meeting was routine, with the board re-elected and KPMG ratified as auditor for FY2026. Earlier 8-K earnings releases in January, February, and May 2026 were also standard, so the main strategic change in the period was the new equity facility rather than a shift in operations or governance.
Financial Analysis
Growth
ICHR — Financial Growth (Quarterly, USD Mil)
| Metric | 2025-06-30 | 2025-09-30 | 2025-12-31 | 2026-03-31 | 2026-06-30 |
|---|---|---|---|---|---|
| REVENUE (USD Mil) | 240.3 | 239.3 | 223.6 | 256.1 | 294.8 |
| EBIT (USD Mil) | -5 | -20.5 | -14.1 | 1.8 | 6.9 |
| EBITDA (USD Mil) | 3 | -13.1 | -4.1 | 9.4 | 14.1 |
| NET INCOME (USD Mil) | -9.4 | -22.9 | -16 | -2.5 | 1 |
| DILUTED EPS | -0.3 | -0.7 | -0.5 | -0.1 | 0 |
Source: Yahoo Finance — Quarterly Financial Statements
Revenue improved from $223.6M in Q4 2025 to $294.8M in Q2 2026, and that $22.7% YoY increase in Q2 2026 points to a real cyclical recovery rather than a one-quarter bounce. EBITDA moved from $3M in Q2 2025 to $14.1M in Q2 2026, while net income turned positive at $1M, so the top line is finally feeding through to the bottom line.
The key question is whether that improvement can hold. A rebound in semiconductor capex supports the moat because Ichor’s design-in position gives it operating leverage when tool demand improves, but the business still needs a few more quarters of similar revenue to prove the recovery is durable.
Profitability
ICHR — Profitability (TTM)
| Metric | TTM |
|---|---|
| Operating Margin (TTM) | 2.8% |
| Net Margin (TTM) | -4.0% |
| Return on Assets (TTM) | 0.4% |
| Return on Equity (TTM) | -5.2% |
| Gross Margin (TTM) | 12.7% |
| EBITDA Margin (TTM) | 3.6% |
Source: Yahoo Finance — Trailing Twelve Months (TTM)
TTM gross margin was 12.7%, operating margin was 2.8%, EBITDA margin was 3.6%, and net margin was -4.0%. The spread between gross margin and operating margin shows the core product still covers manufacturing costs, but overhead and R&D are absorbing most of the profit pool.
Return on assets was 0.4% TTM and return on equity was -5.2%, which tells me the company is not yet earning an attractive return on capital. The latest quarter was better than the TTM view, but the margin base is still thin enough that one soft quarter could push the business back below breakeven.
Valuation
ICHR — Valuation Multiples
| Metric | Value |
|---|---|
| Current Share Price (USD) | 57.9 |
| Market Cap (USD Mil) | 2,170 |
| Enterprise Value (USD Mil) | 2,068 |
| Trailing P/E | — |
| Forward P/E | 17.7 |
| Price/Sales (TTM) | 2.1 |
| Price/Book (mrq) | 2.5 |
| EV/Revenue | 2 |
| EV/EBITDA | 56.2 |
| Beta (5Y Monthly) | 1.81 |
| FCF Yield % (TTM) | 0.5% |
| Forward EPS (USD) | 3.3 |
| Analyst Target Price – Low (USD) | 80 |
| Analyst Target Price – Mean (USD) | 95.9 |
| Analyst Target Price – High (USD) | 115 |
| # Analyst Opinions | 7 |
Source: Yahoo Finance
Ichor trades at $57.9 per share, or 2.0x EV/revenue and 2.1x price/sales, with a forward P/E of 17.7x on forward EPS of 3.3. EV/EBITDA is 56.2x, which is not a cheap multiple in a business where EBITDA is still small relative to enterprise value, and FCF yield is only 0.5% TTM.
On my read, fair value sits around $50-$70 per share. That range is below the $80-$$115 analyst target band, which makes sense because I weight the weak cash conversion and thin margins more heavily than the consensus appears to. The consensus is still meaningful here, with 7 analyst opinions, so my range is not a rejection of coverage so much as a more conservative view of how quickly the recovery can turn into cash.
I would also frame the earnings power as roughly $2.50-$3.50 of EPS if the current recovery holds, versus forward EPS of $3.3 and peer forward EPS that is much higher at TER, AMAT, LRCX, and KLAC. On a like-for-like basis, Ichor’s earnings trajectory is still cheaper than the profitable peers on absolute dollars, but it is not cheap enough to offset the weaker margin profile and lower cash yield.
Leverage
ICHR — Leverage & Coverage (Quarterly)
| Metric | Value |
|---|---|
| Total Debt/Equity % (mrq) | 17.8 |
| Current Ratio (mrq) | 3.7 |
| Total Debt (mrq, USD Mil) | 154.1 |
| Operating Cash Flow (TTM, USD Mil) | -0.4 |
| Levered Free Cash Flow (TTM, USD Mil) | 10.1 |
| Net Debt/EBITDA (TTM) | -2.8 |
| FCF Margin % (TTM) | 1.0% |
Source: Yahoo Finance — Quarterly Financial Statements
Total debt was $154.1M mrq, debt/equity was 17.8%, and the current ratio was 3.7x, so liquidity is comfortable. Net debt/EBITDA was -2.8x TTM, which reflects a net cash position rather than leverage pressure, and total cash was $256.5M mrq.
The weak point is cash conversion. Operating cash flow was $-0.4M TTM, while levered free cash flow was $10.1M TTM and FCF margin was 1.0%, so EBITDA is not yet turning into much cash for equity holders. That is why the new equity facility matters: it improves flexibility, but it also shows management is preparing for a business that still needs support if the cycle softens.
Insider Activity
The insider tape is net negative. I see 16 open-market sales and 1 open-market purchase over the period shown, with about $15.0M of sales against $168,600 of buying, and the activity spans the CEO, CFO, and multiple directors.
That does not break the thesis on its own, but it does weaken the governance signal. When insiders are selling into a recovery while the stock is already up sharply, I read that as a sign that management sees the valuation as more complete than the operating turnaround.
Comparable Analysis
Growth
| Company | Revenue TTM (USD Mil) | Revenue Growth YoY % | EBITDA TTM (USD Mil) | Diluted EPS TTM |
|---|---|---|---|---|
| ICHR | 1,013.8 | 22.7% | 36.8 | -1.2 |
| TER | 4,464 | 103.9% | 1,504.9 | 7.3 |
| AMAT | 30,837 | 24.8% | 10,155 | 11.6 |
| LRCX | 23,232.7 | 30.0% | 8,641.3 | 5.8 |
| KLAC | 13,579.5 | 15.2% | 6,054.8 | 3.7 |
| UCTT | 2,195.2 | 24.3% | 139.1 | -0.5 |
Source: Yahoo Finance
ICHR’s revenue growth was 22.7% TTM, which is solid but not enough to stand out against the best semi-capex names. AMAT grew 24.8%, LRCX grew 30.0%, KLAC grew 15.2%, and UCTT grew 24.3%, while TER was much faster at 103.9% on a much larger base.
The more important comparison is earnings. ICHR’s diluted EPS TTM was -$1.2, while TER, AMAT, LRCX, and KLAC were all profitable, so the market is still underwriting a recovery rather than paying for proven earnings power.
Valuation
| Company | Current Share Price (USD) | Trailing P/E | Forward P/E | EV/Revenue | EV/EBITDA | Price/Sales (TTM) | Price/Book (mrq) | Market Cap (USD Mil) | Enterprise Value (USD Mil) | Beta (5Y Monthly) | FCF Yield % (TTM) | Forward EPS | Analyst Target Price – Low | Analyst Target Price – Mean | Analyst Target Price – High | # Analyst Opinions |
|---|---|---|---|---|---|---|---|---|---|---|---|---|---|---|---|---|
| ICHR | 57.9 | — | 17.7 | 2 | 56.2 | 2.1 | 2.5 | 2,170 | 2,068 | 1.81 | 0.5% | 3.3 | 80 | 95.9 | 115 | 7 |
| TER | 398.4 | 54.6 | 34.2 | 13.9 | 41.2 | 14 | 19.8 | 62,283 | 62,064 | 1.78 | 0.7% | 11.7 | 350 | 446.5 | 550 | 15 |
| AMAT | 485 | 41.8 | 26.3 | 12.4 | 37.7 | 12.5 | 15 | 384,895 | 383,008 | 1.60 | 0.8% | 18.5 | 358 | 640.9 | 900 | 35 |
| LRCX | 315.2 | 54.6 | 26.9 | 16.9 | 45.5 | 17 | 31.6 | 394,461 | 392,971 | 1.86 | 0.8% | 11.7 | 290 | 373.8 | 500 | 31 |
| KLAC | 187.9 | 51.3 | 28 | 18.2 | 40.8 | 18.1 | 38.7 | 245,237 | 246,776 | 1.44 | 1.1% | 6.7 | 175 | 233.8 | 325 | 26 |
| UCTT | 77.7 | — | 13.2 | 1.9 | 29.6 | 1.6 | 5.5 | 3,518 | 4,115 | 1.88 | -2.3% | 5.9 | 120 | 137 | 150 | 5 |
Source: Yahoo Finance
ICHR’s EV/revenue of 2.0x and price/sales of 2.1x are not the highest in the group, but they sit alongside a 0.5% FCF yield and a 17.7x forward P/E. TER, AMAT, LRCX, and KLAC all trade at much richer absolute share prices, but they also bring stronger margins and much higher forward EPS, which makes ICHR’s multiple look less attractive on a growth-adjusted basis.
A $1 investment a year ago would be worth $2.35 in ICHR, versus $2.95 in TER, $2.39 in AMAT, $2.47 in LRCX, $1.78 in KLAC, and $2.91 in UCTT. I read that as the market already paying for a recovery that has outrun the cash flow evidence.
Profitability
| Company | Operating Margin (TTM) | Net Margin (TTM) | Return on Assets (TTM) | Return on Equity (TTM) | Gross Margin (TTM) | EBITDA Margin (TTM) |
|---|---|---|---|---|---|---|
| ICHR | 2.8% | -4.0% | 0.4% | -5.2% | 12.7% | 3.6% |
| TER | 33.2% | 25.8% | 19.7% | 36.5% | 59.2% | 33.7% |
| AMAT | 33.7% | 30.1% | 15.5% | 41.1% | 49.4% | 32.9% |
| LRCX | 37.4% | 31.3% | 22.8% | 65.1% | 50.5% | 37.2% |
| KLAC | 42.5% | 35.6% | 20.8% | 87.5% | 61.3% | 44.6% |
| UCTT | 4.6% | -1.1% | 2.1% | -1.6% | 15.8% | 6.3% |
Source: Yahoo Finance
ICHR’s gross margin was 12.7%, EBITDA margin 3.6%, operating margin 2.8%, and net margin -4.0%. That is far below TER, AMAT, LRCX, and KLAC across every major profitability line, and even UCTT, which is the weakest peer, still runs a 4.6% operating margin and a 6.3% EBITDA margin.
The gap matters because it shows ICHR is not just a smaller version of the profitable peers; it is still working through a much lower-return operating model. Until that margin gap narrows, the stock deserves a discount to the group.
Leverage
| Company | Total Debt/Equity % (mrq) | Current Ratio (mrq) | Total Debt (mrq, USD Mil) | Operating Cash Flow TTM (USD Mil) | Free Cash Flow TTM (USD Mil) | Net Debt/EBITDA (TTM) | FCF Margin % (TTM) |
|---|---|---|---|---|---|---|---|
| ICHR | 17.8 | 3.7 | 154.1 | -0.4 | 10.1 | -2.8 | 1.0% |
| TER | 2.9 | 2.1 | 100.1 | 1,065 | 437.4 | -0.2 | 9.8% |
| AMAT | 28.7 | 2.4 | 7,346 | 8,396 | 3,075.4 | -0.2 | 10.0% |
| LRCX | 33 | 2.6 | 4,121.6 | 5,857.7 | 3,090.5 | -0.2 | 13.3% |
| KLAC | 96.9 | 2.9 | 6,151.7 | 4,143.1 | 2,624.6 | 0.2 | 19.3% |
| UCTT | 108.2 | 2.7 | 775.9 | -66.2 | -81.5 | 3.7 | -3.7% |
Source: Yahoo Finance
ICHR’s debt/equity ratio was 17.8%, current ratio was 3.7x, and net debt/EBITDA was -2.8x, so the balance sheet is cleaner than UCTT’s and more flexible than the larger peers in one respect: it is not carrying heavy net leverage. TER, AMAT, LRCX, and KLAC all have stronger cash generation, though, so they can fund growth and buybacks from operating cash rather than from balance-sheet optionality.
That is why I do not see leverage as the main reason to own ICHR. The balance sheet is not the problem; the problem is that the company still needs the operating margin to do the heavy lifting.
Conclusion
I would put my rating as a sell because the recovery is visible, but the market is already paying for a much cleaner earnings profile than Ichor has actually delivered. Revenue reached $294.8M in Q2 2026 and net income turned positive at $1M, yet TTM operating margin was only 2.8% and FCF yield was 0.5%, so the stock is still ahead of the cash flow.
I would move toward hold if operating margin stays positive for several quarters and FCF yield moves above 2.0%, meaning the rebound is turning into cash rather than just a better quarter. I would be more constructive still if gross margin climbs back above 12.7% TTM, because that would show the restructuring is finally improving the economics of the business rather than just stabilizing revenue.
I would stay cautious if quarterly revenue falls back below $240M, roughly the recent low end of the range, because that would suggest the semiconductor capex upturn is not holding. I would also turn more negative if the company keeps leaning on the $200M at-the-market equity facility while operating cash flow remains near breakeven or negative, since dilution would then be funding a business that is not yet generating enough cash on its own.
The recovery case is real, but I think the market is already discounting too much of it. I would rather wait for another quarter or two of sustained positive operating margin and better cash conversion before moving higher.
What to Watch Next
- Operating margin above 2.8% TTM — would show the recovery is becoming durable.
- FCF yield above 2.0% — would support a move toward Hold.
- Quarterly revenue above $290M — would confirm the Q2 2026 run rate.
- Gross margin back above 12.7% — would show restructuring is improving economics.
- Continued ATM usage with weak operating cash flow — would raise dilution risk.
What’s your take? I rated Ichor (ICHR) SELL above — but the goal here is to get this right, not just to publish an opinion. What would you add to this analysis, or which risk or catalyst do you think I’m under- or over-weighting? Tell me in the comments.
Sources
- SEC 10-K Annual Report — filed 2026-02-20
- SEC 8-K Filing (2026-05-18)
- SEC 8-K Filing (2026-05-14)
- SEC 8-K Filing (2026-05-04)
- SEC 8-K Filing (2026-02-09)
- SEC 8-K Filing (2026-01-13)
- SEC Form 4 Insider Transaction (2026-06-05)
- SEC Form 4 Insider Transaction (2026-06-02)
- SEC Form 4 Insider Transaction (2026-06-02)
- SEC 10-K Annual Report — FY2026
- SEC 10-K Annual Report — FY2025
- SEC 10-K Annual Report — FY2024
- SEC 10-K Annual Report — FY2023
- SEC 10-K Annual Report — FY2022
Data sourced from Yahoo Finance and SEC EDGAR. Not investment advice.
Leave a Comment