
| Company | Aug 25 | Sep 25 | Oct 25 | Nov 25 | Dec 25 | Jan 26 | Feb 26 | Mar 26 | Apr 26 | May 26 | Jun 26 | Jul 26 | 12-Mo |
|---|---|---|---|---|---|---|---|---|---|---|---|---|---|
| RELY | +12% | -12% | -2% | -16% | +2% | -4% | +26% | -6% | +40% | -9% | +12% | +2% | +38% |
| DLO | +41% | -1% | +3% | -8% | +5% | -5% | -9% | +6% | +7% | -13% | +10% | +16% | +49% |
| DAVE | -10% | -7% | +20% | -9% | +1% | -26% | +18% | -10% | +56% | +4% | +32% | +0% | +58% |
| PYPL | +2% | -4% | +3% | -9% | -7% | -10% | -12% | -2% | +11% | -11% | -3% | +32% | -16% |
| STNE | +29% | +15% | +1% | -11% | -12% | +9% | +4% | -16% | -6% | +4% | -5% | +5% | +8% |
Source: Yahoo Finance monthly adjusted close.
Quick Thesis
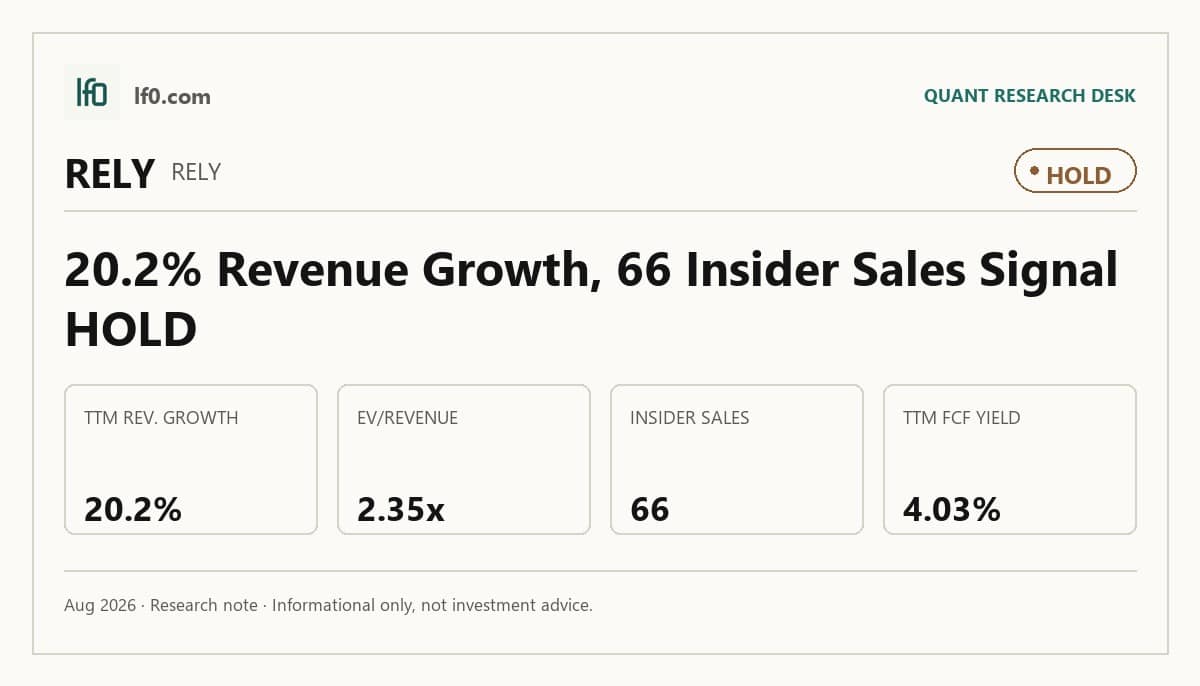
- Rated hold because growth is solid, but valuation already discounts much of it.
- Revenue reached $495.2M in the latest quarter, up 20.2% year over year.
- Key risk: 66 open-market insider sales for $484.7M, with no purchases.
- Valuation is not cheap at 2.35x EV/Revenue and 17.5x trailing P/E.
- I would turn more constructive if operating margin holds above 15.0% for two quarters.
Executive Summary
Rating: HOLD | RELY
Measured from adjusted close on 2026-08-11 to 2026-09-25. Sell ratings are correct when the stock falls; Hold is tracked as a +/-10% range. Daily-close data, not intraday. Calls are tracked for 182 days from publication, then frozen as a final record.
I would put my rating as a Hold because Remitly is still compounding revenue at 20.2% year over year, but the stock already prices in a lot of that progress at 2.35x EV/Revenue and 17.5x trailing P/E. In my view, the balance sheet is a real support, with $676.4M of cash against $38.26M of debt and negative net debt to EBITDA of -3.203x, yet the operating profile is not strong enough to justify a more aggressive call. The key tension is that the business is scaling, but the 11% EBITDA margin and 10.84% FCF margin show that earnings conversion is still only gradual. I would raise my rating toward a Buy if operating margin holds above 15.0% for two straight quarters, because that would show revenue growth is turning into durable earnings power rather than just more volume.
Company Profile
Remitly Global Inc. was founded in 2011 and went public in 2021 on Nasdaq under RELY. It provides cross-border money movement and adjacent financial services, earning most revenue from transaction fees and foreign exchange spreads on consumer and business transfers. As of December 31, 2025, it served more than 9.3 million quarterly active users, operated in more than 175 countries, and supported over 5,300 corridors, with the largest receive markets including India, Mexico, and the Philippines. The company also offers Remitly Flex, a no-interest pay-later product for transfers, plus Remitly Wallet and Card for storing and spending funds. Remitly Global is a holding company with no operations of its own; it relies on operating subsidiaries and a $550M 2025 Revolving Credit Facility, a revolving credit line with JPMorgan Chase Bank, N.A. as administrative agent.
Economic Moat
Business Model
The hardest thing for a well-funded rival to copy within three years is Remitly’s trust built on a global funding and disbursement network that already spans more than 175 countries and more than 5,300 corridors. In my view, that network is difficult to replicate quickly because it lets the company move money without building local operations in each market. Direct integrations with banks, payment processors, cash pickup points, and mobile wallets reinforce that edge, and the 4.9 iOS App Store rating from about 4.0 million reviewers plus the 4.8 Android Google Play rating from more than 13 million reviewers suggest users trust the platform for a non-discretionary service. Scale also matters: 9.3 million quarterly active users in Q4 2025 and $74.9B of send volume in FY2025 support lower unit costs and more reinvestment into product and compliance. I also see a technology edge in the modular platform and AI-based fraud and support tools, but that is supportive rather than the core defense.
The business has shifted from a narrow remittance app into a broader cross-border financial services platform. In FY2022, the company operated in more than 150 countries and more than 2,100 corridors; by FY2025 that had expanded to more than 170 countries and more than 5,100 corridors, while active users reached 7.8 million in Q4 2025 versus 4.2 million in FY2023. The Rewire acquisition in January 2023, a cross-border financial services business, marked the first clear pivot toward adjacent products, and the later launch of Remitly Flex, Remitly Wallet, and Card extended the platform beyond pure money transfer. That matters because the company is no longer just monetizing one remittance use case; it is trying to deepen customer relationships across send, store, and spend, which should raise lifetime value if the new products gain traction. On balance, the business is structurally stronger than five years ago because the network is larger, the product set is broader, and the customer base is more engaged.
Business & Operating Risks
The most material disclosed risk is dependence on third parties across the payment chain, because Remitly relies on payment processors, disbursement partners, cloud hosting, and customer support vendors to move customer funds. According to the risk factors in their SEC 10-K, “a material change of service terms or loss of coverage in our payment processors and disbursement network” could harm the business, and the company also warns that disbursement partners may fail to disburse funds “according to our instructions” or become insolvent. That is not abstract boilerplate: the 2025 transaction loss disclosure of $84.2M, or 0.11% of send volume, shows operational leakage is already real, not hypothetical, and the same filing says losses of “similar or greater magnitude may occur again.” If processor fees rise or coverage narrows, the damage would flow straight into take rates and customer experience.
Fraud, scams, sanctions, and anti-money laundering controls are the next major headwind. The filing specifically names money laundering, terrorist financing, sanctions evasion, bank fraud, account takeover, false account creation, and scams, and it highlights the United States to Colombia and United States to Nigeria corridors as particularly high-risk. The company also discloses that it sometimes releases funds before customer cash is received, which increases repayment risk and makes control failures more expensive. This risk has already shown up in the financial data through the $84.2M of 2025 transaction losses, so the issue is a recurring cost line that can pressure margins and invite regulatory scrutiny if it rises further.
Cybersecurity, privacy, and artificial intelligence exposure is broader than in earlier filings and now includes AI laws and the European Union’s Artificial Intelligence Act. The filing says cyberattacks and outages can be enhanced by AI, and that the company is heavily reliant on a single cloud provider, with west coast infrastructure that would leave the service unavailable for some time if it failed. That is a concrete operational risk, not a generic tech warning, and it is consistent with the company’s seasonality and uptime sensitivity because any outage would hit fourth-quarter send volume when activity peaks. The risk has likely already affected operating costs, since the company has experienced service disruptions in the past and continues to spend heavily on security and remediation.
Regulatory and geographic concentration remain a structural overhang. Cross-border payments to India, Mexico, and the Philippines represented 46.0% of revenue in 2025, so adverse rule changes or currency controls in those corridors would hit a large share of the base at once. The filing also points to the Central Bank of Nigeria’s currency controls as a live example of how local policy can force process changes, which is consistent with the MD&A discussion of corridor mix and foreign exchange sensitivity. In my view, these risks do not break the moat, but they do test it by raising the cost of maintaining trust and coverage across the network.
Management Discussion & Analysis
Management is actively responding to the third-party and compliance risks above by keeping liquidity high and investing in automation, but the partner-loss issue remains a live operating drag. Cash and cash equivalents rose to $542.4M at December 31, 2025, while the 2025 Revolving Credit Facility was expanded to $550M in June 2025, including a $200M letter of credit sub-facility, which tells me the priority is settlement flexibility and corridor expansion rather than balance-sheet repair. That reading is reinforced by $155.0M of borrowings outstanding at December 31, 2025 and the heavy revolver usage during 2025, because management is using the facility as working-capital plumbing, not as permanent funding. The board also approved a $200M share repurchase program in July 2025, and only $23.9M was repurchased in 2025, which signals confidence in cash generation but also shows buybacks are still secondary to growth and regulatory liquidity needs.
On the operating side, management is leaning hard into automation and AI. Customer support and operations expense fell to 6% of revenue in 2025 from 7% in 2024, marketing fell to 21% from 24%, and technology and development fell to 19% from 21%, which supports the view that scale is improving unit economics rather than just buying growth. General and administrative expense still rose to $225.1M in 2025 from $195.9M in 2024, driven in part by a $21.5M increase in provisions related to receivables and processing partners, so the efficiency story is real but not clean enough to call fully self-funding yet. In other words, management is addressing the disclosed risks, but the economics still show the cost of running a global payments network.
Management’s track record is mixed but improving. In 2024, prior filings framed the Rewire acquisition, completed for about “$77.9M” in aggregate consideration, as a way to accelerate complementary products and expand into new geographies, and 2025 revenue of $1.6B plus 9.3 million active customers versus 7.8 million in 2024 show that the broader platform did keep growing. Prior filings also emphasized disciplined customer acquisition and marketing efficiency, and 2025 marketing expense rose only 13% while revenue rose 29%, which confirms management did not overspend to get growth. On tone, the 2025 filing is more credible because it ties that optimism to 19% active-customer growth and 37% send-volume growth.
Recent Events
The most significant development I see is leadership turnover in finance and product. On March 16, 2026, Remitly appointed Tai-Hong Fung as Chief Accounting Officer after Luke Tavis retired from that role effective March 31, 2026, and on June 8, 2026, Chief Product and Technology Officer Ankur Sinha resigned effective June 19, 2026. Both departures were framed as unrelated to accounting disputes, which limits the immediate governance concern, but the product and finance bench is still being reset, so I view this as a modest execution test rather than a thesis break.
The April 6, 2026 board expansion from 10 to 11 directors, with Adam Messinger added to the board and the Talent and Compensation Committee, is a constructive signal. His background at Twitter, Oracle, and Chime Financial suggests added technical and fintech operating depth, which should help if Remitly is still pushing product breadth and international scale.
The February 18 and May 6, 2026 8-Ks were routine results releases and investor materials, with no disclosed strategic transaction, financing change, or regulatory event. Recent disclosures therefore leave the investment case materially unchanged, aside from a slightly higher execution bar after the product leadership change.
Financial Analysis
Growth
RELY — Financial Growth (Quarterly, USD Mil)
| Metric | 2025-06-30 | 2025-09-30 | 2025-12-31 | 2026-03-31 | 2026-06-30 |
|---|---|---|---|---|---|
| REVENUE (USD Mil) | 411.9 | 419.5 | 442.2 | 452.8 | 495.2 |
| EBIT (USD Mil) | 9.8 | 14.5 | 38.7 | 54.5 | 67.8 |
| EBITDA (USD Mil) | 29.5 | 21 | 60 | 68.6 | 79.6 |
| NET INCOME (USD Mil) | 6.5 | 8.8 | 41.2 | 49.1 | 205.9 |
| DILUTED EPS | 0 | 0 | 0.2 | 0.2 | 0.9 |
Source: Yahoo Finance — Quarterly Financial Statements
Revenue rose from $411.9M in the latest comparable quarter to $495.2M in the most recent quarter, and the quarterly path stayed positive at $419.5M, $442.2M, and $452.8M in between. That implies a steady step-up rather than a one-quarter spike, with the latest quarter up 20.2% year over year. EBITDA grew faster than revenue, rising to $79.6M from $29.5M a year earlier, while net income jumped to $205.9M from $6.5M, so earnings are outpacing sales. The growth signal is bullish because the top line is still compounding and profitability is accelerating.
Profitability
RELY — Profitability (TTM)
| Metric | TTM |
|---|---|
| Operating Margin (TTM) | 14.3% |
| Net Margin (TTM) | 16.9% |
| Return on Assets (TTM) | 8.5% |
| Return on Equity (TTM) | 32.2% |
| Gross Margin (TTM) | 61.6% |
| EBITDA Margin (TTM) | 11.0% |
Source: Yahoo Finance — Trailing Twelve Months (TTM)
TTM gross margin was 61.6%, TTM EBITDA margin was 11.0%, TTM operating margin was 14.3%, and TTM net margin was 16.9%. The spread between gross margin and operating margin is wide, which tells me the core transaction engine is healthy but the company is still spending heavily on sales, product, and overhead to scale the platform. EBITDA margin is below operating margin in the table data, which is unusual on its face, so I would treat the reported EBITDA line as a reminder to focus on the broader earnings trend rather than any single margin snapshot.
TTM ROA was 8.54% and TTM ROE was 32.2%. The large ROE versus ROA gap implies returns are being amplified by capital structure, not just by asset productivity, so investors should watch whether that spread stays intact as the balance sheet evolves. The profitability profile is constructive because margins are already positive and the business is moving toward a more scalable model, but the next threshold that matters is a sustained rise in operating margin, since that would show the company is converting gross profit into durable earnings rather than relying on financial leverage.
Valuation
RELY — Valuation Multiples
| Metric | Value |
|---|---|
| Market Cap (USD Mil) | 4,872 |
| Enterprise Value (USD Mil) | 4,260 |
| Trailing P/E | 17.5 |
| Forward P/E | 14.3 |
| Price/Sales (TTM) | 2.7 |
| Price/Book (mrq) | 4.3 |
| EV/Revenue | 2.4 |
| EV/EBITDA | 21.4 |
| Beta (5Y Monthly) | 0.34 |
| FCF Yield % (TTM) | 4.0% |
| Forward EPS (USD) | 1.6 |
| Analyst Target Price – Low (USD) | 29 |
| Analyst Target Price – Mean (USD) | 31.9 |
| Analyst Target Price – High (USD) | 35 |
| # Analyst Opinions | 9 |
Source: Yahoo Finance
RELY trades at 2.35x EV/Revenue and 2.69x Price/Sales on TTM revenue, which is the right anchor here because the 21.4x EV/EBITDA multiple is inflated by a still-early earnings base rather than a mature cash profile. At 17.5x trailing P/E and 14.3x forward P/E, the market is already paying for continued profit conversion, while the 4.03% FCF yield says investors are not getting a deep cash return today. The 4.35x Price/Book multiple is supported by 5.324 of book value per share and 3.195 of cash per share, so the equity is not asset-cheap on a liquidation basis. Beta of 0.343 and a 19.3% 52-week gain point to a lower-volatility re-rating, but the stock still sits above its 52-week low of 12.08 and below its 52-week high of 27.15, which means the market is paying up for durability rather than distress.
On the analysis here, I would put fair value in a range of roughly $24-$32 per share. That sits broadly inside the analyst target range of 29 to 35 with 9 opinions, though my range is a bit more conservative than the consensus mean of 31.9 because I weight the 10.84% FCF margin and 11% EBITDA margin more heavily than the market appears to. The implied earnings path is also modestly below the peer leaders on a like-for-like basis: RELY’s forward EPS of 1.62 is ahead of DLO’s $1.1 but well below PYPL’s $5.8 and DAVE’s $21.6, which is why I do not think the current multiple should be read as cheap. Put differently, the stock is not expensive enough to be a sell, but it is not cheap enough to ignore the margin gap.
Leverage
RELY — Leverage & Coverage (Quarterly)
| Metric | Value |
|---|---|
| Total Debt/Equity % (mrq) | 3.4 |
| Current Ratio (mrq) | 3.2 |
| Total Debt (mrq, USD Mil) | 38.3 |
| Operating Cash Flow (TTM, USD Mil) | 406.1 |
| Levered Free Cash Flow (TTM, USD Mil) | 196.1 |
| Net Debt/EBITDA (TTM) | -3.2 |
| FCF Margin % (TTM) | 10.8% |
Source: Yahoo Finance — Quarterly Financial Statements
RELY has $38.26M of total debt against $676.4M of total cash, so net debt is negative and the balance sheet is cash-rich rather than levered. The current ratio is 3.181x, which gives ample near-term liquidity, and total debt to equity is only 3.396%, a very light capital structure. Operating cash flow was $406.1M and levered free cash flow was $196.1M, so cash generation is strong even after investment needs. Net debt to EBITDA is -3.203x and FCF margin is 10.84%, which means EBITDA is converting into real cash at a healthy rate. In my opinion, this is low refinancing risk because the company has $676.4M of cash, a 3.181x current ratio, and no obvious near-term funding gap; the main watch item would be a sharp deterioration in cash conversion, not a maturity wall.
Insider Activity
The insider transaction record I see here is one-sided: 66 open-market sales for $484.7M and 0 open-market purchases over 2025-01-22 to 2026-06-01, so insiders are net sellers. The activity is broad rather than concentrated, with multiple directors and executives selling across several dates, which suggests weak alignment between insiders and outside shareholders. That does not by itself break the thesis, but it does make me less willing to pay for perfection.
Comparable Analysis
Growth
| Company | Revenue TTM (USD Mil) | Revenue Growth YoY % | EBITDA TTM (USD Mil) | Diluted EPS TTM |
|---|---|---|---|---|
| RELY | 1,809.6 | 20.2% | 199.2 | 1.3 |
| DLO | 1,212.7 | 54.9% | 232.4 | 0.6 |
| DAVE | 643.6 | 29.6% | 232.3 | 15.1 |
| PYPL | 34,128 | 4.8% | 6,456 | 5.3 |
| STNE | 13,535.5 | 4.3% | 7,164.6 | 2.6 |
Source: Yahoo Finance
RELY grew revenue 20.2% TTM, faster than PYPL at 4.8% and STNE at 4.3%, but slower than DLO at 54.9% and DAVE at 29.6%. That puts RELY in the middle of the group on top-line speed, so the growth premium is only partly justified unless the market is paying for better earnings quality rather than faster expansion. DLO’s faster growth comes with a lower forward EPS base, which is why the market is not simply rewarding growth in isolation.
Valuation
| Company | Trailing P/E | Forward P/E | EV/Revenue | EV/EBITDA | Price/Sales (TTM) | Price/Book (mrq) | Market Cap (USD Mil) | Enterprise Value (USD Mil) | Beta (5Y Monthly) | FCF Yield % (TTM) | Forward EPS | Analyst Target Price – Low | Analyst Target Price – Mean | Analyst Target Price – High | # Analyst Opinions |
|---|---|---|---|---|---|---|---|---|---|---|---|---|---|---|---|
| RELY | 17.5 | 14.3 | 2.4 | 21.4 | 2.7 | 4.3 | 4,872 | 4,260 | 0.34 | 4.0% | 1.6 | 29 | 31.9 | 35 | 9 |
| DLO | 22.5 | 12.7 | 2.8 | 14.7 | 3.5 | 7.6 | 4,229 | 3,413 | 0.87 | 9.4% | 1.1 | 14.5 | 18.2 | 21 | 10 |
| DAVE | 20.5 | 14.3 | 6.1 | 17 | 6.1 | 19.3 | 3,939 | 3,954 | 3.86 | 4.2% | 21.6 | 260 | 421.7 | 490 | 11 |
| PYPL | 11.2 | 10.2 | 1.6 | 8.3 | 1.5 | 2.6 | 50,918 | 53,497 | 1.30 | 8.7% | 5.8 | 36 | 58.8 | 147.4 | 33 |
| STNE | 3.9 | 4.3 | 0.6 | 1.2 | 0.2 | 1 | 2,522 | 8,751 | 1.64 | 91.7% | 2.4 | 8.8 | 15.9 | 22.7 | 17 |
Source: Yahoo Finance
RELY trades at 2.35x EV/Revenue, 17.5x trailing P/E, 14.3x forward P/E, and 4.03% FCF yield, versus PYPL at 1.6x, 11.2x, 10.2x, and 8.7%, STNE at 0.6x, 3.9x, 4.3x, and 91.7%, DLO at 2.8x, 22.5x, 12.7x, and 9.4%, and DAVE at 6.1x, 20.5x, 14.3x, and 4.2%. Using the peer EV/Revenue range on RELY’s $1.8B revenue gives an implied enterprise value of about $1.2B to $11.1B, or roughly $5.8 to $50.8 per share after netting RELY’s cash and debt across 210.6M shares; that wide range shows the stock sits above the cheapest fintech names but below the most expensive growth multiple. On a growth-adjusted basis, RELY’s lower leverage and cleaner balance sheet help explain why it can trade above PYPL on EV/Revenue even though PYPL has stronger cash yield.
Profitability
| Company | Operating Margin (TTM) | Net Margin (TTM) | Return on Assets (TTM) | Return on Equity (TTM) | Gross Margin (TTM) | EBITDA Margin (TTM) |
|---|---|---|---|---|---|---|
| RELY | 14.3% | 16.9% | 8.5% | 32.2% | 61.6% | 11.0% |
| DLO | 15.7% | 15.8% | 9.2% | 35.0% | 36.0% | 19.2% |
| DAVE | 32.9% | 34.6% | 31.0% | 104.8% | 71.8% | 36.1% |
| PYPL | 17.0% | 14.4% | 4.6% | 24.5% | 40.5% | 18.9% |
| STNE | 44.3% | 25.9% | 7.1% | 30.7% | 73.6% | 52.9% |
Source: Yahoo Finance
RELY’s 61.6% gross margin and 14.3% operating margin sit above PYPL’s 40.5% and 17.0% on gross margin but below PYPL on operating margin, while DLO’s 36.0% gross margin and 15.7% operating margin and STNE’s 73.6% and 44.3% frame the range more clearly. RELY’s 11.0% EBITDA margin trails PYPL’s 18.9%, DLO’s 19.2%, DAVE’s 36.1%, and STNE’s 52.9%. The pattern looks more like an opex and scale gap than a cost-of-revenue problem, because RELY’s gross margin is solid but its EBITDA conversion is only mid-pack.
Leverage
| Company | Total Debt/Equity % (mrq) | Current Ratio (mrq) | Total Debt (mrq, USD Mil) | Operating Cash Flow TTM (USD Mil) | Free Cash Flow TTM (USD Mil) | Net Debt/EBITDA (TTM) | FCF Margin % (TTM) |
|---|---|---|---|---|---|---|---|
| RELY | 3.4 | 3.2 | 38.3 | 406.1 | 196.1 | -3.2 | 10.8% |
| DLO | 19.8 | 1.3 | 109.7 | 412.8 | 396.4 | -3.5 | 32.7% |
| DAVE | 129.1 | 4.2 | 268.5 | 326.9 | 167.2 | 0.1 | 26.0% |
| PYPL | 71.8 | 1.3 | 14,221 | 7,475 | 4,423.1 | 0.5 | 13.0% |
| STNE | 133.6 | 1.3 | 16,414.6 | 3,395.6 | 2,311.9 | 0.9 | 17.1% |
Source: Yahoo Finance
RELY’s total debt to equity is only 3.396% and net debt to EBITDA is -3.203x, meaning cash exceeds debt by a wide margin, while its 10.84% FCF margin is below DLO’s 32.7%, DAVE’s 26.0%, PYPL’s 13.0%, and STNE’s 17.1%. The balance sheet is a clear advantage versus DLO’s 19.8% debt to equity and DAVE’s 129.1%, and it is one reason RELY can sustain growth without financing risk. DLO’s stronger FCF margin shows that faster growth can coexist with better cash conversion, so RELY’s valuation premium is only partly explained by safety.
Conclusion
The key tension is that Remitly’s balance sheet and user scale are already good enough to support a premium, but the margin profile has not yet caught up enough to justify a more bullish call. I would put my rating as a Hold because the company is still growing revenue at 20.2% and has negative net debt, yet the stock already trades at 2.35x EV/Revenue and 17.5x trailing P/E, so the market is paying for a cleaner earnings profile than the business has fully delivered.
I would raise my rating toward a Buy if operating margin holds above 15.0% for two straight quarters, because that would show the current revenue growth is converting into durable earnings rather than just more volume. On the current $1.8B revenue base, a move from 11.0% to 15.0% operating margin would add roughly $72M of annual operating profit, which would materially improve cash generation and make the current multiple easier to defend. I would also want to see FCF margin move closer to 6.0%, meaning the company is producing more cash for each dollar of market value.
The bear case is that growth slows before margins have time to catch up, while insider selling keeps sentiment cautious. If revenue growth slips below 15.0% and FCF margin stalls near 10.0% instead of expanding, the market could start treating RELY as a mid-tier payments name rather than a premium compounder. In that case, the multiple would have room to compress toward the lower end of the peer range, and the stock would likely give back part of the re-rating it has already earned.
I lean Hold because the bull case and bear case are close enough that neither has won yet. The company has the balance sheet and user scale to keep compounding, but until margins move up more decisively, I think the market is already giving it most of the credit it deserves.
What to Watch Next
- Operating margin above 15.0% for two quarters — would support a move toward Buy.
- FCF margin near 6.0% or better — would show stronger cash conversion.
- Revenue growth below 15.0% — would weaken the premium multiple case.
- Insider selling easing materially — would improve sentiment and alignment.
- Net debt staying negative — would preserve balance-sheet flexibility.
What’s your take? I rated Remitly Global (RELY) HOLD above — but the goal here is to get this right, not just to publish an opinion. What would you add to this analysis, or which risk or catalyst do you think I’m under- or over-weighting? Tell me in the comments.
Sources
- SEC 10-K Annual Report — filed 2026-02-18
- SEC 8-K Filing (2026-06-08)
- SEC 8-K Filing (2026-05-06)
- SEC 8-K Filing (2026-04-10)
- SEC 8-K Filing (2026-03-20)
- SEC 8-K Filing (2026-02-18)
- SEC 8-K Filing (2026-02-18)
- SEC Form 4 Insider Transaction (2026-06-02)
- SEC Form 4 Insider Transaction (2026-05-29)
- SEC Form 4 Insider Transaction (2026-05-29)
- SEC 10-K Annual Report — FY2026
- SEC 10-K Annual Report — FY2025
- SEC 10-K Annual Report — FY2024
- SEC 10-K Annual Report — FY2023
- SEC 10-K Annual Report — FY2022
Data sourced from Yahoo Finance and SEC EDGAR. Not investment advice.
Leave a Comment