
| Company | Jul 25 | Aug 25 | Sep 25 | Oct 25 | Nov 25 | Dec 25 | Jan 26 | Feb 26 | Mar 26 | Apr 26 | May 26 | Jun 26 | 12-Mo |
|---|---|---|---|---|---|---|---|---|---|---|---|---|---|
| NOVT | -5% | -5% | -14% | +27% | -11% | +5% | +13% | -0% | -12% | +10% | +23% | +2% | +26% |
| SYNA | -3% | +11% | -2% | +4% | -3% | +8% | +11% | -1% | -14% | +34% | +47% | -10% | +92% |
| SITM | -5% | +19% | +25% | -4% | +3% | +19% | +3% | +10% | -13% | +63% | +26% | +5% | +250% |
| HIMX | -1% | -8% | +8% | +7% | -20% | +8% | -1% | -10% | +8% | +49% | +75% | -24% | +75% |
| ASMIY | -24% | -1% | +25% | +8% | -15% | +9% | +39% | +1% | -11% | +29% | +8% | +10% | +80% |
| TSM | +7% | -4% | +21% | +8% | -3% | +5% | +9% | +13% | -10% | +17% | +6% | +14% | +113% |
Source: Yahoo Finance monthly adjusted close.
Executive Summary
Rating: HOLD | NOVT
Measured from adjusted close on 2026-07-17 to 2026-10-20. Sell ratings are correct when the stock falls; Hold is tracked as a +/-10% range. Daily-close data, not intraday. Calls are tracked for 182 days from publication, then frozen as a final record.
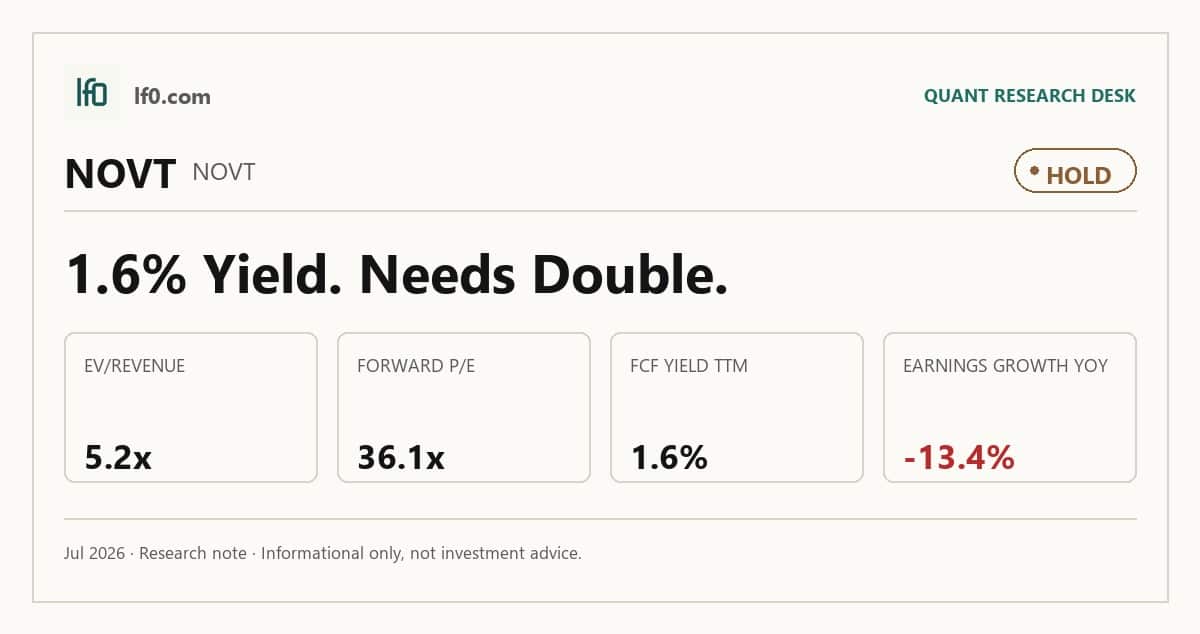
I would put my rating as a Hold because Novanta combines a net cash balance sheet with 8.7% TTM free cash flow margin, yet the stock already trades on a 5.2x EV/revenue multiple and 36.1x forward P/E that assume a cleaner earnings path than the latest quarter proves. Revenue grew 10.4% year over year in Q1 2026 to $257.7M, but quarterly earnings growth was still -13.4%, so I do not see enough operating acceleration to justify a more aggressive call. I would raise my rating toward a Buy if quarterly revenue stays above $260M and operating margin moves toward 13% to 14%, because that would show incremental sales are turning into more profit rather than just preserving the base.
Company Profile
Novanta designs and supplies precision components and subsystems used in medical and advanced industrial equipment. Its revenue base is tied to customers that buy for productivity, capacity, and cost savings, so demand tends to move with capital spending cycles rather than with a steady consumer pattern. That mix gives the company exposure to higher-value applications, but it also means order timing and end-market health matter more than a simple unit-volume story.
Economic Moat
Business Model
The moat case rests on technical integration rather than scale alone. Novanta sells components that sit inside complex systems, which makes qualification, switching, and redesign costs meaningful for customers. I feel that this kind of embedded position is harder to replicate quickly than a commodity component business, especially when the product has to meet medical and industrial performance standards. The company’s 44.2% TTM gross margin supports that view, because it suggests the portfolio still carries pricing power and product differentiation.
Business & Operating Risks
The main disclosed risk is cyclicality in end-market demand. According to the risk factors in Novanta’s SEC 10-K, a large portion of product sales depends on customers’ need for capacity, productivity, and cost savings, and weakness in those markets can hit both revenue and gross margin. The filing also flags oversupply in parts of advanced industrial markets, limited or single-source inputs, and single-site manufacturing, all of which can delay shipments or force customers to defer orders. Pricing pressure is another real risk because cost inflation may not be fully passed through. These risks do not break the moat, but they do test whether the company can keep its embedded position while absorbing a more volatile demand backdrop. The Barrick-style dispute risk does not apply here; the disclosed risks are more about cyclicality and execution than about a direct threat to the structural advantage itself.
Management Discussion & Analysis
Management appears to be responding to those risks with balance-sheet flexibility rather than with a defensive retrenchment. The May 15, 2026 second amendment to the credit agreement added $200M of delayed draw term loan capacity and reset incremental borrowing room, which gives Novanta more optionality if demand softens or if it wants to fund acquisitions. That is a sensible response to cyclical and supply-chain risk, although it does not eliminate the underlying exposure to end-market timing. In my view, the capital structure work is constructive because it gives management time to protect the moat while the operating environment remains uneven.
Recent Events
The recent 8-Ks were mostly routine, and that is itself informative. The May 11, 2026 earnings release and the February 23, 2026 full-year 2025 release suggest the company is executing without a strategic reset, while the May 28, 2026 annual meeting showed governance continuity: all nine directors were elected, executive pay won advisory approval, and Deloitte was reappointed. I read that as stability rather than urgency. The credit amendment is the only event that materially changes the financial flexibility picture, and it strengthens the company’s ability to ride through the cyclicality described above.
Financial Analysis
Growth
NOVT — Financial Growth (Quarterly, USD Mil)
| Metric | 2025-03-31 | 2025-06-30 | 2025-09-30 | 2025-12-31 | 2026-03-31 |
|---|---|---|---|---|---|
| REVENUE (USD Mil) | 233.4 | 241 | 247.8 | 258.3 | 257.7 |
| EBIT (USD Mil) | 30 | 27.5 | 28.5 | 30.7 | 30.1 |
| EBITDA (USD Mil) | 43.5 | 43.1 | 44.2 | 47.8 | 44.3 |
| NET INCOME (USD Mil) | 21.2 | 4.5 | 10.7 | 17.5 | 21.1 |
| DILUTED EPS | 0.6 | 0.1 | 0.3 | 0.5 | 0.5 |
Source: Yahoo Finance — Quarterly Financial Statements
Revenue rose from $233.4M in Q1 2025 to $257.7M in Q1 2026, a 10.4% YoY gain, and the path was orderly rather than explosive. EBITDA increased from $43.5M to $44.3M over the same period, so top-line growth is still outpacing earnings leverage only modestly. That matters because the moat thesis depends on technical differentiation turning into durable compounding, not just a one-quarter rebound. I would call the growth profile steady, but not yet strong enough to justify a premium on momentum alone.
Profitability
NOVT — Profitability (TTM)
| Metric | TTM |
|---|---|
| Operating Margin (TTM) | 11.7% |
| Net Margin (TTM) | 5.3% |
| Return on Assets (TTM) | 4.6% |
| Return on Equity (TTM) | 5.2% |
| Gross Margin (TTM) | 44.2% |
| EBITDA Margin (TTM) | 17.8% |
Source: Yahoo Finance — Trailing Twelve Months (TTM)
TTM gross margin of 44.2% is the cleanest sign that the product set still carries value, while 11.7% operating margin and 17.8% EBITDA margin show that overhead still takes a meaningful cut. Net margin of 5.3% confirms the business is profitable, but the spread between EBITDA and net income tells me the company is not yet converting every dollar of sales into meaningful bottom-line leverage. ROA of 4.6% and ROE of 5.2% are positive, though not exceptional, which fits a business that is solidly profitable but not yet operating at a best-in-class return profile. The key bridge from here to a better thesis is operating margin expansion, because that would show the embedded product advantage is flowing through the P&L more efficiently.
Valuation
NOVT — Valuation Multiples
| Metric | Value |
|---|---|
| Market Cap (USD Mil) | 5,325 |
| Enterprise Value (USD Mil) | 5,233 |
| Trailing P/E | 107.6 |
| Forward P/E | 36.1 |
| Price/Sales (TTM) | 5.3 |
| Price/Book (mrq) | 4.1 |
| EV/Revenue | 5.2 |
| EV/EBITDA | 29.3 |
| Beta (5Y Monthly) | 1.68 |
| FCF Yield % (TTM) | 1.6% |
| Forward EPS (USD) | 4.1 |
| Analyst Target Price – Low (USD) | 170 |
| Analyst Target Price – Mean (USD) | 175 |
| Analyst Target Price – High (USD) | 180 |
| # Analyst Opinions | 2 |
Source: Yahoo Finance
The stock is priced for better execution than the current earnings base. Market cap is $5.3B and enterprise value is $5.2B, which implies the market is recognizing the company’s net cash position, but not paying a large premium for it. Trailing P/E is 107.6x, forward P/E is 36.1x, EV/EBITDA is 29.3x, and FCF yield is 1.6%, so the valuation is rich even after accounting for the balance sheet. On the analysis here, I would put fair value in a range of roughly $150–$185 per share, with the low end tied to a more cautious cash-flow view and the high end tied to better margin conversion. That range sits broadly around the $170–$180 analyst target band from two covering analysts, so I do not see a deep disagreement with consensus; I just think the market is already paying for a cleaner earnings path than the current 11.7% operating margin and 5.3% net margin justify. Forward EPS is $4.1, and that looks reasonable versus peers only if Novanta can keep converting growth into margin, because the company’s earnings power is not yet strong enough to support a premium multiple on its own. I would also frame the implied earnings range as roughly $3.8–$4.4 per share, which is close to the current forward estimate but not rich relative to peers with stronger margins and lower valuation multiples.
Leverage
NOVT — Leverage & Coverage (Quarterly)
| Metric | Value |
|---|---|
| Total Debt/Equity % (mrq) | 22.2 |
| Current Ratio (mrq) | 3.6 |
| Total Debt (mrq, USD Mil) | 291.3 |
| Operating Cash Flow (TTM, USD Mil) | 84 |
| Levered Free Cash Flow (TTM, USD Mil) | 87.3 |
| Net Debt/EBITDA (TTM) | -0.5 |
| FCF Margin % (TTM) | 8.7% |
Source: Yahoo Finance — Quarterly Financial Statements
The balance sheet is a support, not a constraint. Total debt is $291.3M, debt/equity is 22.2%, and the current ratio is 3.6x, so near-term liquidity looks comfortable. Net debt/EBITDA is -0.5x, which means cash exceeds debt, and TTM levered free cash flow of $87.3M with an 8.7% FCF margin shows the company is still generating cash after investment. I view that as an important offset to the valuation premium: the stock is expensive, but it is not expensive because the balance sheet is stretched. That distinction matters because a net cash position gives management room to wait for margin improvement, even if it does not by itself make the shares cheap.
Insider Activity
Insider activity is a caution flag. The record shows 0 open-market purchases and 37 open-market sales for $10.2M over 2025-01-02 to 2026-06-02, led by CEO Matthijs Glastra. I do not read that as proof of a broken thesis, but it does tell me management is not signaling conviction through buying. Combined with the valuation, it leaves the stock looking more fully priced than the operating data alone would suggest.
Comparable Analysis
Growth
| Company | Revenue TTM (USD Mil) | Revenue Growth YoY % | EBITDA TTM (USD Mil) | Diluted EPS TTM |
|---|---|---|---|---|
| NOVT | 1,004.9 | 10.4% | 178.8 | 1.4 |
| SYNA | 1,172 | 10.4% | 88.1 | -1.2 |
| SITM | 379.9 | 88.3% | 3.2 | -0.9 |
| HIMX | 816 | -7.5% | 53.9 | 0.2 |
| ASMIY | 3,196.5 | 2.8% | 1,090.7 | 22.9 |
| TSM | 4,103,904.2 | 35.1% | 2,856,031.1 | 13.4 |
Source: Yahoo Finance
NOVT’s 10.4% revenue growth matches SYNA at 10.4%, but it trails SITM at 88.3% and TSM at 35.1%, while still beating HIMX at -7.5% and ASMIY at 2.8%. That puts Novanta in the middle of the pack on growth, so I would not argue for a hyper-growth multiple. The more important point is that the company is growing steadily enough to support a quality premium, but not fast enough to deserve one on growth alone.
Valuation
| Company | Trailing P/E | Forward P/E | EV/Revenue | EV/EBITDA | Price/Sales (TTM) | Price/Book (mrq) | Market Cap (USD Mil) | Enterprise Value (USD Mil) | Beta (5Y Monthly) | FCF Yield % (TTM) | Forward EPS | Analyst Target Price – Low | Analyst Target Price – Mean | Analyst Target Price – High | # Analyst Opinions |
|---|---|---|---|---|---|---|---|---|---|---|---|---|---|---|---|
| NOVT | 107.6 | 36.1 | 5.2 | 29.3 | 5.3 | 4.1 | 5,325 | 5,233 | 1.68 | 1.6% | 4.1 | 170 | 175 | 180 | 2 |
| SYNA | — | 22.1 | 4.2 | 56.1 | 3.9 | 3.3 | 4,561 | 4,940 | 1.98 | 3.2% | 5.3 | 123 | 145.3 | 170 | 9 |
| SITM | — | 46.2 | 37.2 | 4,471.9 | 44.9 | 13 | 17,044 | 14,118 | 2.91 | 0.1% | 12.3 | 775 | 837.5 | 900 | 8 |
| HIMX | 68.7 | 13 | 3.1 | 47.7 | 2.8 | 2.5 | 2,275 | 2,567 | 2.31 | -0.8% | 1 | 17.4 | 23.7 | 30 | 2 |
| ASMIY | 43.9 | 29.3 | 15.3 | 44.9 | 15.4 | 10 | 49,186 | 48,918 | 1.55 | 0.1% | 34.3 | 1,420 | 1,420 | 1,420 | 1 |
| TSM | 30.1 | 19 | 3.6 | 5.2 | 0.5 | 91.1 | 2,087,867 | 14,753,049 | 1.25 | 34.4% | 21.2 | 354 | 520.4 | 700 | 18 |
Source: Yahoo Finance
NOVT’s 5.2x EV/revenue and 36.1x forward P/E sit above SYNA’s 4.2x and 22.1x, while its 1.6% FCF yield is below SYNA’s 3.2% and far below TSM’s 34.4%. SYNA is the closest peer on growth, since both names are at 10.4% revenue growth, yet SYNA trades cheaper on revenue and richer on cash yield, which makes Novanta’s premium harder to defend unless margins improve. The peer EV/revenue spread is wide, but the market is not paying Novanta for peer-leading growth; it is paying for balance-sheet strength and a cleaner earnings path that still needs to be proven.
Profitability
| Company | Operating Margin (TTM) | Net Margin (TTM) | Return on Assets (TTM) | Return on Equity (TTM) | Gross Margin (TTM) | EBITDA Margin (TTM) |
|---|---|---|---|---|---|---|
| NOVT | 11.7% | 5.3% | 4.6% | 5.2% | 44.2% | 17.8% |
| SYNA | -4.3% | -4.1% | -1.8% | -3.5% | 43.6% | 7.5% |
| SITM | -4.2% | -6.4% | -2.3% | -2.6% | 55.7% | 0.8% |
| HIMX | 5.1% | 3.9% | 1.3% | 3.6% | 30.5% | 6.6% |
| ASMIY | 32.2% | 31.0% | 10.9% | 24.9% | 51.8% | 34.1% |
| TSM | 58.1% | 46.5% | 17.3% | 36.2% | 61.9% | 69.6% |
Source: Yahoo Finance
NOVT’s 44.2% gross margin is slightly above SYNA’s 43.6% and well above HIMX’s 30.5%, but it trails ASMIY at 51.8% and TSM at 61.9%. On operating margin, Novanta’s 11.7% beats SYNA’s -4.3% and HIMX’s 5.1%, yet it remains far behind ASMIY at 32.2% and TSM at 58.1%. That mix tells me the business is profitable, but not yet operating at a level that would normally justify a premium multiple on returns alone.
Leverage
| Company | Total Debt/Equity % (mrq) | Current Ratio (mrq) | Total Debt (mrq, USD Mil) | Operating Cash Flow TTM (USD Mil) | Free Cash Flow TTM (USD Mil) | Net Debt/EBITDA (TTM) | FCF Margin % (TTM) |
|---|---|---|---|---|---|---|---|
| NOVT | 22.2 | 3.6 | 291.3 | 84 | 87.2 | -0.5 | 8.7% |
| SYNA | 64.7 | 3 | 879.4 | 139 | 145.7 | 5.4 | 12.4% |
| SITM | 0.3 | 12.5 | 3 | 103.3 | 7.9 | -248.9 | 2.1% |
| HIMX | 64.5 | 1.6 | 595.2 | 88 | -18.1 | 5.7 | -2.2% |
| ASMIY | 1.7 | 2.2 | 72 | 758.2 | 59.5 | -0.8 | 1.9% |
| TSM | 18.4 | 2.5 | 1,094,369.8 | 2,348,378.2 | 719,158.4 | -0.8 | 17.5% |
Source: Yahoo Finance
NOVT’s 22.2% debt/equity is well below SYNA’s 64.7% and HIMX’s 64.5%, and its -0.5x net debt/EBITDA is cleaner than both of those peers because it shows net cash rather than net borrowing. The current ratio of 3.6x also compares favorably with HIMX at 1.6x and SYNA at 3.0x, so Novanta has more liquidity cushion than the more levered names. That lower leverage helps explain why the stock can trade at a premium to some peers even without best-in-class growth, but it does not fully explain the valuation gap on its own.
Conclusion
I would put my rating as a Hold because the key tension is now clear: Novanta has a net cash balance sheet and positive free cash flow, but the shares already discount a better margin profile than the latest quarter shows. Revenue is growing at 10.4%, yet quarterly earnings growth is still negative, so the market is paying for an operating step-up that has not fully arrived. In my view, that is the right place to be cautious.
I would raise my rating toward a Buy if revenue can stay above $260M per quarter and operating margin moves toward 13% to 14%, because that would show the company is turning its technical differentiation into real earnings leverage. At that point, the current 29.3x EV/EBITDA would look less demanding, and the balance sheet would become a stronger source of upside rather than just a cushion. I would move from Hold to Sell if quarterly revenue falls back below $240M for two straight quarters, because that would tell me the 10.4% growth rate has stalled and the valuation is leaning on a base that is no longer expanding. A second leg down in EBITDA margin toward 15% would make that bear case more serious, since it would show the company is losing operating leverage just as the market is asking for more of it.
Weighing both sides, I still lean to Hold. The balance sheet and cash generation give Novanta time, but I want to see one more quarter of revenue above $260M and margin expansion before I get more constructive. If that does not happen, the valuation will remain the main issue, not the business quality.
What’s your take? I rated Novanta (NOVT) HOLD above — but the goal here is to get this right, not just to publish an opinion. What would you add to this analysis, or which risk or catalyst do you think I’m under- or over-weighting? Tell me in the comments.
Sources
- SEC 10-K Annual Report — filed 2026-02-23
- SEC 8-K Filing (2026-05-29)
- SEC 8-K Filing (2026-05-15)
- SEC 8-K Filing (2026-05-11)
- SEC 8-K Filing (2026-02-23)
- SEC Form 4 Insider Transaction (2026-06-04)
- SEC Form 4 Insider Transaction (2026-05-14)
- SEC Form 4 Insider Transaction (2026-05-07)
- SEC 10-K Annual Report — FY2026
- SEC 10-K Annual Report — FY2025
- SEC 10-K Annual Report — FY2024
- SEC 10-K Annual Report — FY2023
- SEC 10-K Annual Report — FY2022
Data sourced from Yahoo Finance and SEC EDGAR. Not investment advice.
Leave a Comment