
| Company | Aug 25 | Sep 25 | Oct 25 | Nov 25 | Dec 25 | Jan 26 | Feb 26 | Mar 26 | Apr 26 | May 26 | Jun 26 | Jul 26 | 12-Mo |
|---|---|---|---|---|---|---|---|---|---|---|---|---|---|
| STZ | -3% | -17% | -2% | +4% | +1% | +14% | +1% | -5% | +5% | -11% | +0% | -6% | -20% |
| DEO | +14% | -15% | -1% | -1% | -6% | +8% | -4% | -17% | +9% | +2% | -3% | +10% | -7% |
| BUD | +9% | -5% | +2% | +1% | +4% | +12% | +13% | -14% | +9% | +7% | +3% | +5% | +52% |
| HEINY | +3% | -3% | -1% | +5% | +0% | +1% | +12% | -17% | +3% | +0% | +8% | +9% | +18% |
| TAP | +4% | -10% | -3% | +6% | +1% | +3% | +2% | -11% | -1% | -6% | -1% | +7% | -11% |
Source: Yahoo Finance monthly adjusted close.
Quick Thesis
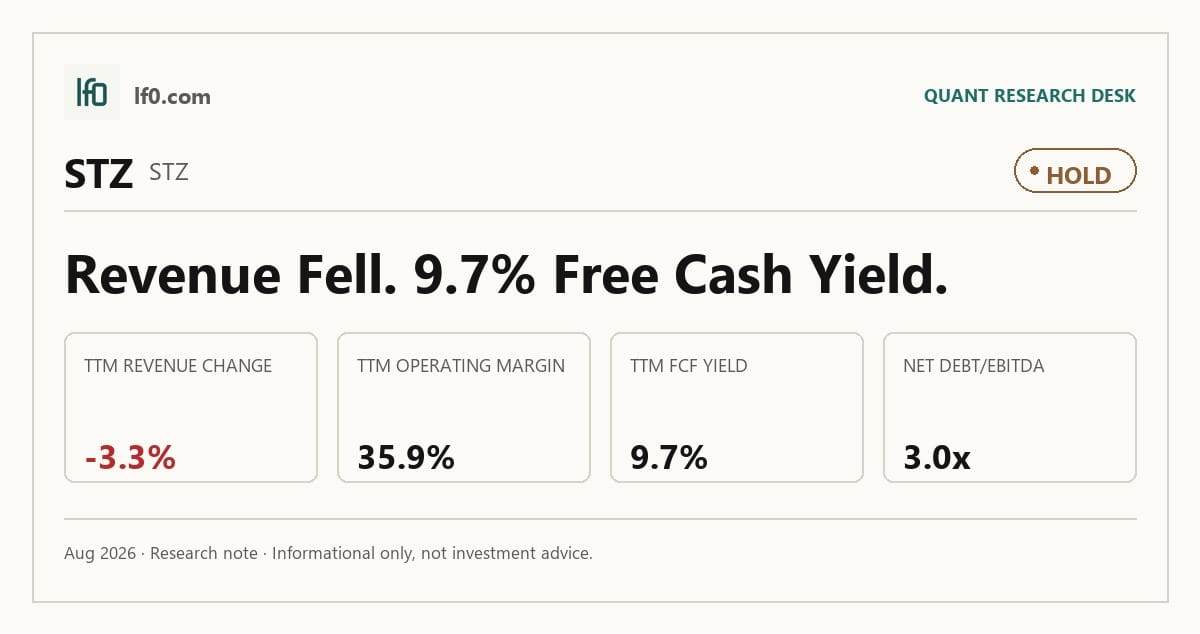
- Rated hold — cash flow is strong, but revenue is still slipping.
- TTM free cash flow yield is 9.7%, supporting the equity.
- Net debt is $10.5B, with net debt/EBITDA at 3.0x.
- STZ trades at 9.7x EV/EBITDA, below premium beer peers but not cheap on sales.
- I would raise the rating if revenue stabilizes above $2.3B and operating margin holds near 35.9%.
Executive Summary
Rating: HOLD | STZ
Measured from adjusted close on 2026-08-11 to 2026-09-25. Sell ratings are correct when the stock falls; Hold is tracked as a +/-10% range. Daily-close data, not intraday. Calls are tracked for 182 days from publication, then frozen as a final record.
I would put my rating as a Hold because Constellation Brands has a strong cash engine, but the market is already paying for that quality while revenue is still shrinking. TTM free cash flow yield is 9.7%, which supports the equity, yet revenue fell from $2.5B in Q1 2026 to $1.9B in Q2 2026 and the stock still trades at 3.7x EV/Revenue and 12.8x trailing P/E, so the valuation is not cheap enough to ignore the growth gap. I would raise my rating more towards a Buy if revenue growth turns positive for two straight quarters and operating margin stays near 35.9%, because that would show the beer focus is translating into real demand rather than just cost control.
Company Profile
Constellation Brands is a beverage alcohol company with U.S. beer as its core profit pool, plus wine and spirits sales in the U.S. and select international markets. The business operates breweries in the U.S. and Mexico, wineries in the U.S., New Zealand, and Italy, and distillery operations in the U.S. The Veracruz Brewery is a modular capacity expansion project in Mexico that is expected to begin initial production around mid-Fiscal 2027. Constellation Brands trades on the New York Stock Exchange under STZ. Its 2025 Credit Agreement is a senior credit facility that restricts certain Canopy-related uses of proceeds until the Conversion Time.
Economic Moat
Business Model
The moat is built on physical control of the beer system, not just brand equity. In my view, the Veracruz Brewery is the hardest element for a well-funded rival to copy within 3 years because it combines production scale, water access, packaging supply, and cross-border logistics, all of which would take years of permitting and construction to recreate. The Glass Plant adds a second layer of supply control by producing a majority of the annual glass bottle supply for the beer brands, which makes the operating model harder to disrupt than a standard branded beverage business.
Business & Operating Risks
The main disclosed risks are governance friction and cyber exposure, not a direct threat to the brewery moat. The Sands Family Stockholders’ board nomination rights and pledged Class A stock can slow transactions that do not suit the family’s interests, and a lender sale of a substantial amount of pledged shares could pressure the stock. Cybersecurity is the clearest operating risk because the company says it has been a target of cyberattackers and other hacking activities, including attacks on third-party service providers. I do not see those risks directly undermining the Veracruz and Glass Plant advantage yet, but they can distract management and create volatility around a moat that depends on execution.
Management Discussion & Analysis
Management appears to be responding to those risks with a tighter capital and operating posture, but it is not yet showing a new growth bridge. The filing repeats the view that future operations should generate enough taxable income to realize deferred tax assets, which is a tax assumption rather than an operating catalyst. I also see no new buyback or acquisition program in the MD&A, so the response to the disclosed risks is mainly defensive discipline rather than an aggressive reset.
Recent Events
The April 8, 2026 dividend declaration kept cash returns intact at $1.03 per Class A share and $0.93 per Class 1 share, which tells me management still wants to return capital even as the operating backdrop softens. The May 4 and May 6, 2026 refinancing sequence was more important: Constellation priced $500M of 4.850% Senior Notes due 2031 and then redeemed $600M of 3.700% Senior Notes due 2026. That extends maturity runway and reduces near-term refinancing pressure, which supports the moat because a capital-intensive brewery system is only as durable as its funding. On May 20, 2026, the board expanded from 11 to 12 directors and elected E. Morgan Flatley, which I read as a constructive governance and brand-building signal rather than a strategic reset.
Financial Analysis
Growth
STZ — Financial Growth (Quarterly, USD Mil)
| Metric | 2025-05-31 | 2025-08-31 | 2025-11-30 | 2026-02-28 | 2026-05-31 |
|---|---|---|---|---|---|
| REVENUE (USD Mil) | 2,515 | 2,481 | 2,222.8 | 1,920.2 | 2,432.7 |
| EBIT (USD Mil) | 712 | 871.9 | 718.9 | 436.6 | 847.7 |
| EBITDA (USD Mil) | 817.2 | 974.6 | 817.9 | 548.4 | 945.3 |
| NET INCOME (USD Mil) | 516.1 | 466 | 502.8 | 201.8 | 653.8 |
| DILUTED EPS | 2.9 | 2.6 | 2.9 | 1.2 | 3.8 |
Source: Yahoo Finance — Quarterly Financial Statements
Revenue fell from $2.5B in Q1 2026 to $1.9B in Q2 2026, and EBITDA dropped from $817M to $548M over the same span. That is a sharp sequential decline, but I would not read it as a clean demand collapse without more context because the business has also been reshaped by the 2025 Wine Divestitures and a heavier beer mix. The more important point is that the top line has not yet stabilized enough to support a higher multiple on growth alone.
Profitability
STZ — Profitability (TTM)
| Metric | TTM |
|---|---|
| Operating Margin (TTM) | 35.9% |
| Net Margin (TTM) | 20.1% |
| Return on Assets (TTM) | 8.6% |
| Return on Equity (TTM) | 23.7% |
| Gross Margin (TTM) | 52.7% |
| EBITDA Margin (TTM) | 38.2% |
Source: Yahoo Finance — Trailing Twelve Months (TTM)
TTM operating margin of 35.9%, gross margin of 52.7%, and EBITDA margin of 38.2% show a business that still keeps more than half of revenue after cost of goods sold, but the 16.8-point gap between gross and operating margin means selling, marketing, and overhead remain heavy. TTM net margin of 20.1% confirms that the business is converting a meaningful share of sales into earnings, while TTM ROA of 8.57% and ROE of 23.7% show solid capital efficiency. The ROE-to-ROA spread tells me leverage is still amplifying returns, so investors should watch whether ROE stays above 20% without relying on more debt.
Valuation
STZ — Valuation Multiples
| Metric | Value |
|---|---|
| Market Cap (USD Mil) | 22,885 |
| Enterprise Value (USD Mil) | 33,508 |
| Trailing P/E | 12.8 |
| Forward P/E | 10.8 |
| Price/Sales (TTM) | 2.5 |
| Price/Book (mrq) | 2.8 |
| EV/Revenue | 3.7 |
| EV/EBITDA | 9.7 |
| Beta (5Y Monthly) | 0.40 |
| FCF Yield % (TTM) | 9.7% |
| Forward EPS (USD) | 12.4 |
| Analyst Target Price – Low (USD) | 115 |
| Analyst Target Price – Mean (USD) | 170.8 |
| Analyst Target Price – High (USD) | 209 |
| # Analyst Opinions | 23 |
Source: Yahoo Finance
Constellation Brands trades at 3.7x EV/Revenue, 9.7x EV/EBITDA, 12.8x trailing P/E, and 10.8x forward P/E, with a 9.7% FCF yield and a 0.4 beta. On the numbers here, I would put fair value in a range of roughly $115-$170 per share, which sits inside the analyst target range of $115-$209 and below the $170.8 mean because I weight the revenue decline and 3.0x net debt/EBITDA more heavily than the consensus appears to. Forward EPS is $12.4, so the stock is not expensive on earnings, but the market is still paying for a franchise that has to prove the beer focus can re-accelerate sales. That is why I see the valuation as fair rather than cheap: the cash yield is strong, yet the multiple already assumes the margin profile holds.
Leverage
STZ — Leverage & Coverage (Quarterly)
| Metric | Value |
|---|---|
| Total Debt/Equity % (mrq) | 123.2 |
| Current Ratio (mrq) | 0.9 |
| Total Debt (mrq, USD Mil) | 10,533.8 |
| Operating Cash Flow (TTM, USD Mil) | 2,693.6 |
| Levered Free Cash Flow (TTM, USD Mil) | 2,210.5 |
| Net Debt/EBITDA (TTM) | 3 |
| FCF Margin % (TTM) | 24.4% |
Source: Yahoo Finance — Quarterly Financial Statements
Total debt is $10.5B, with total debt/equity of 123.2% and a current ratio of 0.9x, so the balance sheet is levered and near-term liquidity is not abundant. Operating cash flow was $2.7B and levered free cash flow was $2.2B, which shows solid cash conversion even after interest and capex. Net debt/EBITDA of 3.0x is manageable for a consumer staples name, but it does not leave much room for a sharp earnings drop before refinancing risk becomes more relevant. FCF margin of 24.4% is the key offset because it means a meaningful share of revenue is turning into cash, which supports debt service and reduces pressure on the capital structure.
Insider Activity
The insider transaction record I see here is clearly net selling: 4 open-market sales versus 1 open-market purchase, with sales value of $1.6M against $186,390 of buying. The activity is also fairly broad, not just one seller, because sales came from both an EVP and a director, while the only purchase was smaller and isolated. In my view, that is a bear signal because open-market selling is outweighing buying and insider alignment looks weaker over this filing window.
Comparable Analysis
Growth
| Company | Revenue TTM (USD Mil) | Revenue Growth YoY % | EBITDA TTM (USD Mil) | Diluted EPS TTM |
|---|---|---|---|---|
| STZ | 9,056.7 | -3.3% | 3,455.8 | 10.5 |
| DEO | 19,643 | — | 6,923 | 3.1 |
| BUD | 62,615 | 11.0% | 19,736 | 4.6 |
| HEINY | 29,414 | 4.7% | 5,533 | 2.4 |
| TAP | 11,083.5 | -3.3% | 2,263.4 | -11.4 |
Source: Yahoo Finance
STZ’s revenue declined 3.3% TTM, while BUD grew 11.0% and HEINY grew 4.7%, so STZ is the only name in the group with a shrinking top line. That discount is partly offset by STZ’s diluted EPS of 10.5 TTM, but the market is not paying a growth premium for a business that is lagging peers on sales.
Valuation
| Company | Trailing P/E | Forward P/E | EV/Revenue | EV/EBITDA | Price/Sales (TTM) | Price/Book (mrq) | Market Cap (USD Mil) | Enterprise Value (USD Mil) | Beta (5Y Monthly) | FCF Yield % (TTM) | Forward EPS | Analyst Target Price – Low | Analyst Target Price – Mean | Analyst Target Price – High | # Analyst Opinions |
|---|---|---|---|---|---|---|---|---|---|---|---|---|---|---|---|
| STZ | 12.8 | 10.8 | 3.7 | 9.7 | 2.5 | 2.8 | 22,885 | 33,508 | 0.40 | 9.7% | 12.4 | 115 | 170.8 | 209 | 23 |
| DEO | 30.4 | 13.7 | 50.7 | 143.8 | 2.7 | 87.5 | 52,766 | 995,720 | 0.32 | 4.7% | 6.9 | 76 | 106.4 | 136 | 7 |
| BUD | 17.4 | 16.2 | 16.8 | 53.4 | 2.5 | 10.2 | 158,827 | 1,053,348 | 0.79 | 6.7% | 5 | 85 | 97 | 111 | 10 |
| HEINY | 18.3 | 12.9 | 8.9 | 47.6 | 1.6 | 10.8 | 48,277 | 263,237 | 0.57 | 6.2% | 3.4 | 46 | 50.5 | 55 | 2 |
| TAP | — | 8.5 | 1.3 | 6.2 | 0.7 | 0.8 | 7,829 | 14,003 | 0.43 | 11.9% | 4.9 | 34 | 45.5 | 61 | 21 |
Source: Yahoo Finance
STZ trades at 3.7x EV/Revenue and 9.7x EV/EBITDA, versus BUD at 16.8x and 53.4x, HEINY at 8.9x and 47.6x, and TAP at 1.3x and 6.2x. On cash generation, STZ sits between TAP and the premium beer names, and the 9.7% FCF yield is the cleanest support for the multiple because it is stronger than BUD’s 6.7% and HEINY’s 6.2%. The peer set is mixed, so I would not lean too hard on the implied range, but it still says the stock is not obviously cheap on revenue alone; the valuation case rests more on cash flow than on sales multiples.
Profitability
| Company | Operating Margin (TTM) | Net Margin (TTM) | Return on Assets (TTM) | Return on Equity (TTM) | Gross Margin (TTM) | EBITDA Margin (TTM) |
|---|---|---|---|---|---|---|
| STZ | 35.9% | 20.1% | 8.6% | 23.7% | 52.7% | 38.2% |
| DEO | 31.4% | 8.8% | 8.0% | 15.0% | 61.0% | 35.2% |
| BUD | 27.3% | 14.9% | 4.9% | 11.4% | 56.5% | 31.5% |
| HEINY | 10.5% | 7.7% | 4.0% | 12.1% | 37.0% | 18.8% |
| TAP | 11.3% | -20.8% | 3.8% | -19.5% | 37.0% | 20.4% |
Source: Yahoo Finance
STZ’s 35.9% operating margin, 20.1% net margin, 52.7% gross margin, and 38.2% EBITDA margin all sit above BUD’s 27.3%, 14.9%, 56.5%, and 31.5%, and far above HEINY’s 10.5%, 7.7%, 37.0%, and 18.8%. The gap looks structural rather than cyclical because STZ’s gross margin is only modestly below BUD’s, yet its operating and EBITDA margins are higher, which points to better overhead control and a more profitable mix rather than just lower cost of goods sold.
Leverage
| Company | Total Debt/Equity % (mrq) | Current Ratio (mrq) | Total Debt (mrq, USD Mil) | Operating Cash Flow TTM (USD Mil) | Free Cash Flow TTM (USD Mil) | Net Debt/EBITDA (TTM) | FCF Margin % (TTM) |
|---|---|---|---|---|---|---|---|
| STZ | 123.2 | 0.9 | 10,533.8 | 2,693.6 | 2,210.5 | 3 | 24.4% |
| DEO | 172.2 | 1.6 | 22,307 | 4,100 | 2,483.9 | 3 | 12.7% |
| BUD | 71.9 | 0.7 | 72,732 | 17,420 | 10,693.6 | 3.3 | 17.1% |
| HEINY | 95.1 | 0.8 | 20,644 | 5,808 | 3,003.6 | 3.2 | 10.2% |
| TAP | 76 | 0.9 | 7,913.7 | 1,977.2 | 935.1 | 2.6 | 8.4% |
Source: Yahoo Finance
STZ’s debt/equity is 123.2%, net debt/EBITDA is 3.0x, and FCF margin is 24.4%, versus BUD at 71.9%, 3.3x, and 17.1%, HEINY at 95.1%, 3.2x, and 10.2%, and TAP at 76.0%, 2.6x, and 8.4%. STZ carries more balance-sheet leverage than BUD and HEINY on a raw debt basis, but the 3.0x net debt/EBITDA is still manageable because its 24.4% FCF margin is the best in the group. That combination matters for the thesis: the market is not paying for balance-sheet safety here, it is paying for cash generation that can keep leverage under control.
Conclusion
I would put my rating as a Hold because the core tension is between strong cash generation and a top line that is still soft. The latest quarter showed revenue at $1.9B and EBITDA at $548.4M, so the business is still converting sales into cash, but not yet at a pace that makes the current 3.7x EV/Revenue multiple look obviously cheap. The balance sheet also matters here: with net debt at $10.5B and net debt/EBITDA at 3.0x, the company has enough flexibility to absorb a weak quarter, but not enough to ignore a sustained slowdown.
I would raise my rating more towards a Buy if revenue growth turns positive for two straight quarters and operating margin stays near 35.9%, because that would show the beer focus is translating into real demand rather than just cost control. If EBITDA held around the current $818M to $945M quarterly range while revenue stabilized above $2.3B, annualized free cash flow would stay comfortably above $2B, which would make the 9.7% FCF yield look more durable and could justify a higher multiple.
I would move from Hold to Sell if the next two quarters show revenue below $2B again and net debt/EBITDA moves above 3.5x, because that would mean the current cash yield is being used to mask a weaker operating base rather than fund a stable franchise. A drop in EBITDA margin from 38.2% TTM toward the low 30s would cut annual EBITDA by roughly $500M on the current revenue base, which would slow deleveraging and make the 123.2% debt/equity load harder to carry.
Weighing both paths, I lean to the bear case arriving first because the latest quarter already showed a $300M-plus sequential revenue drop and the stock has not fully reset for that volatility. The balance sheet and cash flow keep downside from becoming severe, but until I see revenue stabilize above $2.3B and not just one quarter of margin strength, I do not think the stock deserves a Buy.
What to Watch Next
- Quarterly revenue above $2.3B — would support a higher multiple.
- Operating margin near 35.9% — would confirm the beer mix is still efficient.
- Net debt/EBITDA above 3.5x — would raise refinancing risk.
- EBITDA in the $818M-$945M range — would keep free cash flow durable.
- Revenue below $2B again — would strengthen the Sell case.
What’s your take? I rated Constellation Brands (STZ) HOLD above — but the goal here is to get this right, not just to publish an opinion. What would you add to this analysis, or which risk or catalyst do you think I’m under- or over-weighting? Tell me in the comments.
Sources
- SEC 10-K Annual Report — filed 2026-04-22
- SEC 8-K Filing (2026-05-21)
- SEC 8-K Filing (2026-05-06)
- SEC 8-K Filing (2026-05-05)
- SEC 8-K Filing (2026-05-04)
- SEC 8-K Filing (2026-04-08)
- SEC 8-K Filing (2026-02-12)
- SEC Form 4 Insider Transaction (2026-05-21)
- SEC Form 4 Insider Transaction (2026-05-13)
- SEC Form 4 Insider Transaction (2026-05-05)
- SEC 10-K Annual Report — FY2026
- SEC 10-K Annual Report — FY2025
- SEC 10-K Annual Report — FY2024
- SEC 10-K Annual Report — FY2023
- SEC 10-K Annual Report — FY2022
Data sourced from Yahoo Finance and SEC EDGAR. Not investment advice.
Leave a Comment