
Executive Summary
Rating: HOLD | NEM
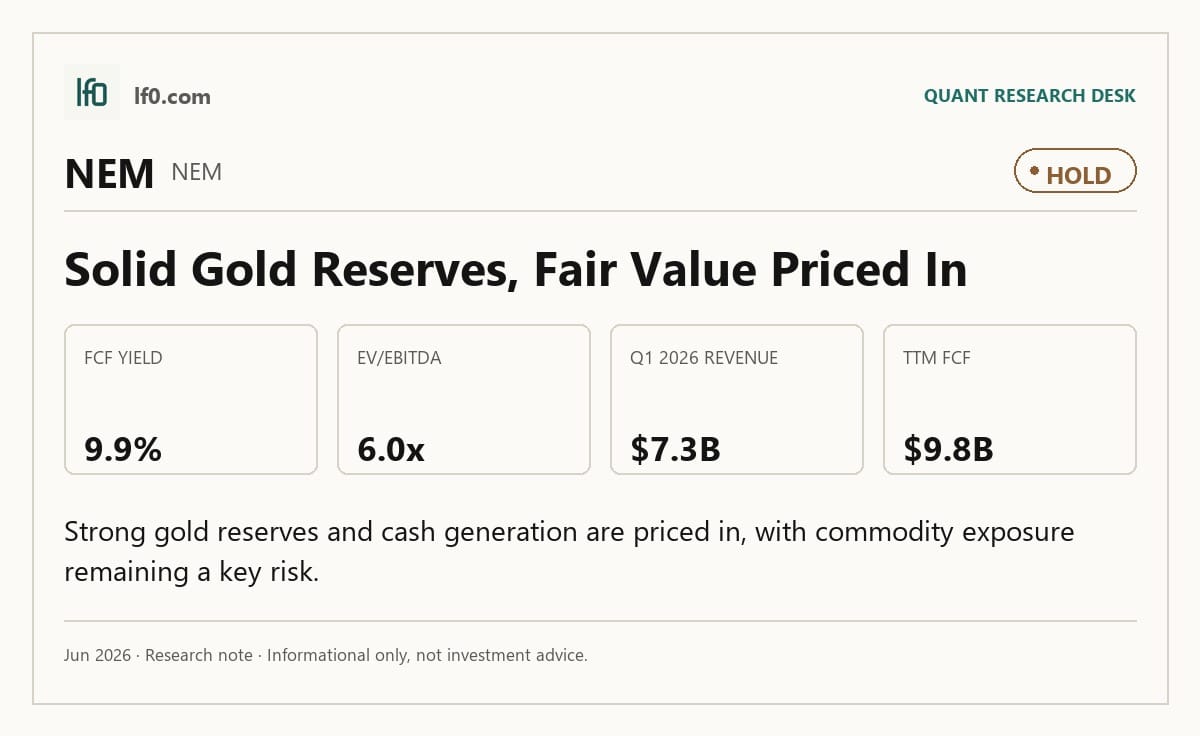
I would put my rating as a Hold because Newmont’s cash generation is strong, but the stock already discounts much of that quality and the upside now depends on metal prices staying firm. TTM levered free cash flow was $9.8B and the company ended the period with net cash, yet insider selling and a 45.8% TTM revenue growth rate tell me the market has already recognized a lot of the good news. I would move more toward a Buy if operating margin stays above 60.0% for the next two quarters, meaning the current earnings power is holding rather than peaking.
Company Profile
Newmont Corporation was incorporated in 1921 and is a gold producer with meaningful copper, silver, lead, and zinc output. It sells refined gold, dor bars, and metal concentrates from 13 reportable segments, including 12 operated mines and a 38.5% interest in Nevada Gold Mines, a joint venture mine complex in Nevada. The company completed the Newcrest Mining Limited acquisition on November 6, 2023, then sold Telfer in Q4 2024, CC&V, Musselwhite, and Éléonore in Q1 2025, Porcupine and Akyem in Q2 2025, and the Coffee project in Q4 2025. Newmont is headquartered in Denver, Colorado, and operates across the U.S., Australia, Ghana, Peru, Mexico, Canada, Papua New Guinea, Suriname, Argentina, Chile, Ecuador, and the Dominican Republic. It is listed on the NYSE under NEM, with CDIs on the ASX and PDIs on the PNGX.
Economic Moat
Business Model
The ore bodies, processing plants, and land package that underpin Newmont’s production base are the hardest elements for a competitor to replicate within three years. According to their SEC filings, at December 31, 2025 Newmont had attributable proven and probable gold reserves of 118.2 million ounces, attributable measured and indicated gold resources of 88.1 million ounces, attributable inferred gold resources of 60.6 million ounces, and an aggregate land position of approximately 19,200 square miles. In my view, that scale of reserve depth and jurisdictional spread is difficult to rebuild quickly because it depends on years of permitting, drilling, and mine development rather than capital alone.
The operating model is also reinforced by a diversified metal mix and a broad asset base. Newmont is not only a gold producer; it also produces copper, silver, lead, and zinc, with 13 reportable segments at December 31, 2025, including 12 mining operations and a 38.5% interest in Nevada Gold Mines, which it does not directly manage. I feel that this mix lowers dependence on any single mine and gives the company more ways to offset weakness in one asset with strength in another. That breadth is consistent with their margin profile because a diversified asset base is one reason Newmont can keep TTM operating margin at 61.4%.
Business & Operating Risks
The most material disclosed risk is commodity price exposure: Newmont says a substantial or extended decline in gold, copper, silver, lead or zinc prices would hurt revenue, net income, cash flow, reserves, and access to capital, and it explicitly notes it does not hedge those metals. That risk is already visible in the financial data because 2025 average gold was $3,432 per ounce and silver was $40.03 per ounce, so the current earnings base is still highly price dependent rather than self-help driven. A second risk is reserve replacement and project execution, since the company says exploration is highly speculative and new projects can take many years before production, which means any miss on reserve conversion would eventually pressure output and amortization.
The filing also flags higher costs and delays from permitting, labor, water, and power, and that is consistent with the MD&A discussion of ongoing Yanacocha closure studies and the June 2026 compliance deadline. In my view, that makes execution risk more than a generic disclosure item: if permitting slips or closure costs rise, the moat is not broken, but the cash conversion that supports it gets weaker. The disclosed risk profile is a material bear signal.
Management Discussion & Analysis
Management is signaling a capital-light cleanup phase, not an aggressive expansion phase. Newmont completed the sale of Telfer in Q4 2024, then CC&V, Musselwhite, and Éléonore in Q1 2025, Akyem and Porcupine in Q2 2025, and Coffee in Q4 2025, which tells me the post-Newcrest portfolio reset is being converted into cash rather than chased for scale. That is reinforced by the $3B share repurchase authorization in July 2025 and the February 2026 dividend of 0.26 per share under a sustainable-through-the-cycle framework, so management is prioritizing shareholder returns and balance-sheet flexibility over reinvesting every dollar into growth.
The same filing shows $3.1B of development capital in 2025, led by Tanami Expansion 2 at $1.3B since approval, Ahafo North at $900M, and Cadia Panel Caves at $516M. That tells me growth is still being funded, but only in projects far enough along to justify the spend. The Ahafo North commercial production declaration in October 2025 is the clearest operating milestone in the MD&A, and it signals that one major growth project has moved from capital use to cash generation.
Management’s track record is mixed but not poor. In 2024, Newcrest integration costs were $72M and the company recorded a $1.1B loss on assets held for sale, while 2025 turned that into a $1.1B gain on completed divestments and lower general and administrative expense of $382M versus $442M in 2024. By contrast, Yanacocha Sulfides was still deferred and removed from the life-of-mine plan, which means earlier optimism about that asset did not translate into execution. I read management’s signal as disciplined, but not flawless.
Recent Events
The most significant recent event is the leadership transition on April 24, 2026: Francois Hardy, Executive Vice President and Chief Technical Officer, retired effective June 30, 2026, and Newmont named Erin Workman as acting Chief Technical Officer in May 2026. That change matters because technical leadership is central to mine planning and reserve conversion, but the company’s emphasis on an internal successor search suggests the operating model is not dependent on one person.
The April 23, 2026 first-quarter earnings release and the February 19, 2026 fourth-quarter and full-year 2025 results keep the focus on operating performance rather than on restructuring or financing. In my view, that supports the thesis that Newmont is still managing the portfolio in a steady, disciplined way rather than reacting to a liquidity problem. The May 12, 2026 annual meeting was routine, with shareholders approving the director slate, executive compensation, and Ernst & Young LLP as auditor on May 13, 2026.
Financial Analysis
Growth
NEM — Financial Growth (Quarterly, USD Mil)
| Metric | 2025-03-31 | 2025-06-30 | 2025-09-30 | 2025-12-31 | 2026-03-31 |
|---|---|---|---|---|---|
| REVENUE (USD Mil) | 5,010 | 5,317 | 5,524 | 6,818 | 7,307 |
| EBIT (USD Mil) | 2,550 | 3,183 | 2,559 | 3,279 | 4,622 |
| EBITDA (USD Mil) | 3,143 | 3,803 | 3,202 | 3,944 | 5,254 |
| NET INCOME (USD Mil) | 1,891 | 2,061 | 1,832 | 1,301 | 3,262 |
| DILUTED EPS | 1.7 | 1.9 | 1.7 | 1.2 | 3 |
Source: Yahoo Finance — Quarterly Financial Statements
Revenue rose from $5B in Q1 2025 to $7.3B in Q1 2026, a 45.9% increase, after moving to $5.3B in Q2 2025 and $5.5B in Q3 2025 before a step-up to $6.8B in Q4 2025. EBITDA grew to $5.3B from $3.1B a year earlier, and net income climbed to $3.3B from $1.9B, so the business is still converting higher metal prices into real earnings power. The Q4 2025 jump looks quarter-specific rather than a smooth run rate, which is why I would not extrapolate the latest quarter too aggressively.
Profitability
NEM — Profitability (TTM)
| Metric | TTM |
|---|---|
| Operating Margin (TTM) | 61.4% |
| Net Margin (TTM) | 33.9% |
| Return on Assets (TTM) | 14.9% |
| Return on Equity (TTM) | 25.8% |
| Gross Margin (TTM) | 67.4% |
| EBITDA Margin (TTM) | 65.5% |
Source: Yahoo Finance — Trailing Twelve Months (TTM)
TTM operating margin was 61.4%, gross margin was 67.4%, and EBITDA margin was 65.5%, so Newmont is already converting more than two thirds of revenue into gross profit and cash operating earnings before depreciation. The 6.0-point gap between gross and operating margin shows overhead and mine-level costs are still meaningful, but not enough to erase the strong operating spread. TTM net margin of 33.9% and ROE of 25.8% versus ROA of 14.9% point to solid profitability with some leverage amplification, not a balance-sheet-driven return profile. That margin strength is consistent with the moat discussion above: a large, diversified reserve base is showing up in unusually high profitability.
Valuation
NEM — Valuation Multiples
| Metric | Value |
|---|---|
| Market Cap (USD Mil) | 99,709 |
| Enterprise Value (USD Mil) | 96,634 |
| Trailing P/E | 12.1 |
| Forward P/E | 8.2 |
| Price/Sales (TTM) | 4 |
| Price/Book (mrq) | 2.9 |
| EV/Revenue | 3.9 |
| EV/EBITDA | 5.9 |
| Beta (5Y Monthly) | 0.46 |
| FCF Yield % (TTM) | 9.8% |
| Forward EPS (USD) | 11.4 |
| Analyst Target Price – Low (USD) | 72 |
| Analyst Target Price – Mean (USD) | 140.2 |
| Analyst Target Price – High (USD) | 175 |
| # Analyst Opinions | 21 |
Source: Yahoo Finance
Newmont screens as a value name first. FCF yield was 9.8% TTM, which means the market is paying about 10.2 years of current levered free cash flow for the equity, a reasonable entry point if that cash generation holds. Trailing P/E is 12.1x and forward P/E is 8.2x, so the market is already discounting a sharp step-up in earnings to $11.4 per share in the forward period; at the current share price implied by market cap and shares outstanding, that is not demanding for a miner with this cash profile.
Price/Sales is 4.0x and EV/Revenue is 3.9x, while EV/EBITDA is 5.9x, all of which point to a stock priced for sustained high-margin production rather than a cyclical trough. Price/Book is 2.9x, so investors are also paying a premium to stated equity, which is acceptable only if asset values and mine life remain intact. Analyst targets cluster at $72 to $175, with a $140 mean across 21 opinions, and my fair-value range sits below that mean because I weight the current cash yield and balance-sheet strength more heavily than the consensus appears to. On the analysis here, I would put fair value in a range of roughly $95-$130 per share, with the lower end reflecting a more cautious view on commodity normalization and the upper end assuming the current margin structure persists.
Leverage
NEM — Leverage & Coverage (Quarterly)
| Metric | Value |
|---|---|
| Total Debt/Equity % (mrq) | 15.8 |
| Current Ratio (mrq) | 2.4 |
| Total Debt (mrq, USD Mil) | 5,532 |
| Operating Cash Flow (TTM, USD Mil) | 12,088 |
| Levered Free Cash Flow (TTM, USD Mil) | 9,804.9 |
| Net Debt/EBITDA (TTM) | -0.2 |
| FCF Margin % (TTM) | 39.3% |
Source: Yahoo Finance — Quarterly Financial Statements
Total debt was $5.5B, with total debt/equity of 15.8% and a current ratio of 2.4x, so the balance sheet has room to absorb a downturn rather than forcing an immediate refinancing. Operating cash flow was $12.1B TTM and levered free cash flow was $9.8B TTM, while FCF margin was 39.3%, which tells me EBITDA is converting into cash very efficiently and leaves Newmont with substantial internal funding capacity. Net debt/EBITDA was -0.2x, meaning cash exceeds debt on a net basis, so refinancing risk is low unless gold prices or operating cash flow weaken materially. Total cash was $8.8B, which adds another liquidity buffer. I would keep this as a bull case only if free cash flow stays near the current level, because the leverage profile and the valuation only work together if cash generation remains this strong.
Insider Activity
The insider transaction record I see here is one-sided: 29 open-market sales for $10.8M and zero open-market purchases over 2025-01-10 to 2026-06-01. The activity is broad rather than concentrated, with the CEO, CFO, and several operating executives all selling, which points to weak insider alignment with shareholders at current prices. I do not treat that as a thesis breaker on its own, but it does make me less willing to pay up for the stock after a strong run.
Comparable Analysis
Growth
| Company | Revenue TTM (USD Mil) | Revenue Growth YoY % | Diluted EPS TTM |
|---|---|---|---|
| NEM | 24,966 | 45.8% | 7.7 |
| GOLD | 23,020.4 | 244.0% | 3.1 |
| BTG | 3,687.8 | 117.7% | 0.4 |
| AEM | 13,539.2 | 66.1% | 10.6 |
| EQX | 2,413.1 | 224.3% | 0.4 |
| AU | 11,166 | 64.9% | 6.8 |
Source: Yahoo Finance
NEM’s revenue grew 45.8% TTM, slower than GOLD at 244.0%, EQX at 224.3%, BTG at 117.7%, AEM at 66.1%, and AU at 64.9%, so the stock is not being priced as the fastest grower in the group. I feel that is justified because NEM’s growth is still strong in absolute terms, but the peer set is rewarding more explosive earnings leverage elsewhere.
Valuation
| Company | Trailing P/E | Forward P/E | EV/Revenue | EV/EBITDA | Price/Sales (TTM) | Price/Book (mrq) | Market Cap (USD Mil) | Enterprise Value (USD Mil) | Beta (5Y Monthly) | FCF Yield % (TTM) | Forward EPS | Analyst Target Price – Low | Analyst Target Price – Mean | Analyst Target Price – High | # Analyst Opinions |
|---|---|---|---|---|---|---|---|---|---|---|---|---|---|---|---|
| NEM | 12.1 | 8.2 | 3.9 | 5.9 | 4 | 2.9 | 99,709 | 96,634 | 0.46 | 9.8% | 11.4 | 72 | 140.2 | 175 | 21 |
| GOLD | 13.6 | 11.5 | 0.1 | 15.9 | 0.1 | 1.4 | 1,207 | 2,755 | 0.60 | -61.6% | 3.6 | 52 | 65.8 | 90 | 5 |
| BTG | 9.8 | 3.1 | 1.4 | 2.5 | 1.4 | 1.4 | 4,983 | 5,064 | 1.30 | 14.4% | 1.2 | 5 | 6.5 | 7.5 | 5 |
| AEM | 14.6 | 10.7 | 5.5 | 7.8 | 5.7 | 3 | 77,571 | 74,767 | 0.57 | 5.5% | 14.4 | 93 | 243.9 | 310 | 14 |
| EQX | 26.3 | 5.9 | 3.3 | 5.7 | 3.2 | 1.3 | 7,671 | 7,958 | 2.33 | 4.7% | 1.6 | 14 | 14 | 14 | 1 |
| AU | 11.9 | 7.6 | 3.8 | 6.4 | 3.7 | 4.8 | 40,900 | 41,874 | 0.64 | 8.7% | 10.6 | 75 | 118.4 | 155 | 8 |
Source: Yahoo Finance
NEM trades at 3.9x EV/Revenue and 12.1x trailing P/E versus AU at 3.8x and 11.9x, AEM at 5.5x and 14.6x, EQX at 3.3x and 26.3x, BTG at 1.4x and 9.8x, and GOLD at 0.1x and 13.6x. That spread says NEM is priced below the higher-quality gold majors but above the more cyclical names, and the 9.8% FCF yield matters because it shows the market is paying for cash conversion, not just for production growth. A $1 investment a year ago would be worth $1.62 in NEM, versus $1.92 in GOLD, $1.87 in AU, $1.69 in EQX, $1.04 in BTG, and $1.32 in AEM, which tells me the market has already rewarded the stronger names and is not leaving much room for a rerating unless cash flow stays exceptional.
Profitability
| Company | Operating Margin (TTM) | Net Margin (TTM) | Return on Assets (TTM) | Return on Equity (TTM) | Gross Margin (TTM) | EBITDA Margin (TTM) |
|---|---|---|---|---|---|---|
| NEM | 61.4% | 33.9% | 14.9% | 25.8% | 67.4% | 65.5% |
| GOLD | 0.9% | 0.3% | 2.8% | 10.8% | 1.8% | 0.8% |
| BTG | 45.0% | 14.8% | 16.9% | 16.5% | 65.5% | 53.9% |
| AEM | 62.8% | 39.5% | 15.5% | 22.3% | 73.9% | 70.5% |
| EQX | 45.3% | 25.2% | 6.9% | 5.2% | 58.9% | 58.1% |
| AU | 56.1% | 31.1% | 22.8% | 43.0% | 53.5% | 58.7% |
Source: Yahoo Finance
NEM’s 61.4% operating margin, 67.4% gross margin, 65.5% EBITDA margin, and 33.9% net margin all sit above AU’s 56.1%, 53.5%, 58.7%, and 31.1%, and well ahead of GOLD’s 0.9%, 1.8%, 0.8%, and 0.3%. That means NEM’s margin profile is structurally stronger than the average peer, even if AEM’s 62.8% operating margin and 39.5% net margin are slightly better on the top line of profitability. The return profile is also solid, with ROE of 25.8% and ROA of 14.9%, which is enough to support the valuation but not enough to justify a premium on its own.
Leverage
| Company | Total Debt/Equity % (mrq) | Current Ratio (mrq) | Total Debt (mrq, USD Mil) | Net Debt/EBITDA (TTM) | FCF Margin % (TTM) |
|---|---|---|---|---|---|
| NEM | 15.8 | 2.4 | 5,532 | -0.2 | 39.3% |
| GOLD | 182.4 | 1.2 | 1,654.2 | 8.7 | -3.2% |
| BTG | 14 | 1.2 | 519.9 | 0 | 19.5% |
| AEM | 1.2 | 3.1 | 319.2 | -0.3 | 31.6% |
| EQX | 12.9 | 1.2 | 787.4 | 0.2 | 14.8% |
| AU | 22 | 2.7 | 2,286 | -0.1 | 31.9% |
Source: Yahoo Finance
NEM’s total debt to equity is 15.8%, current ratio is 2.4x, net debt to EBITDA is -0.2x, and FCF margin is 39.3%, versus GOLD at 182.4%, 1.2x, 8.7x, and -3.2%, BTG at 14.0%, 1.2x, 0.0x, and 19.5%, AEM at 1.2%, 3.1x, -0.3x, and 31.6%, EQX at 12.9%, 1.2x, 0.2x, and 14.8%, and AU at 22.0%, 2.7x, -0.1x, and 31.9%. The negative net debt figure tells me NEM’s balance sheet is effectively cash-backed, which gives it more flexibility than the levered gold names and helps explain why its valuation can sit above the weakest peers without looking stretched.
Conclusion
I would put my rating as a Hold because Newmont’s cash generation is strong, but the stock already reflects much of that quality and the next leg higher depends on commodity prices staying supportive. TTM levered free cash flow was $9.8B and net debt/EBITDA was -0.2x, so the company has real flexibility, yet the market has already rewarded that with a 45.8% TTM revenue growth rate and a valuation that is no longer cheap on sales or book value.
I would move more toward a Buy if operating margin stays above 60.0% for the next two quarters and free cash flow remains near $9.8B TTM, because that would show the current earnings power is durable rather than a peak-quarter effect. If that happens, Newmont should be able to keep funding buybacks and the 0.26 quarterly dividend without leaning on debt markets, which would make the current multiple look too low for the cash being produced.
I would move from Hold to Sell if free cash flow margin falls below 30.0%, meaning the business is no longer converting enough of revenue into cash to support the current capital return profile. A sharper bear case would be a major project slip or reserve replacement miss that cuts annual operating cash flow by roughly $2B-$3B, because that would quickly narrow the cushion behind the current net cash position and force the market to reprice the stock on a much lower earnings base.
Weighing both sides, I lean to Hold rather than Buy because the balance sheet and cash conversion give Newmont more room to absorb a commodity pullback than most miners, but the stock already prices in a lot of that strength. I do not see enough evidence to call it a Strong Buy, and I would want either sustained margin durability or a better entry point before moving more constructive.
What’s your take? I rated Newmont (NEM) HOLD above — but the goal here is to get this right, not just to publish an opinion. What would you add to this analysis, or which risk or catalyst do you think I’m under- or over-weighting? Tell me in the comments.
Sources
Data sourced from Yahoo Finance and SEC EDGAR. Not investment advice.
Leave a Comment