
| Company | Aug 25 | Sep 25 | Oct 25 | Nov 25 | Dec 25 | Jan 26 | Feb 26 | Mar 26 | Apr 26 | May 26 | Jun 26 | Jul 26 | 12-Mo |
|---|---|---|---|---|---|---|---|---|---|---|---|---|---|
| OI | -0% | -0% | -13% | +19% | +9% | +4% | -12% | -22% | -13% | -4% | +10% | -26% | -45% |
| SLGN | +1% | -8% | -10% | +3% | +2% | +7% | +11% | -19% | +5% | -7% | +24% | -14% | -12% |
| GEF | +3% | -8% | -5% | +15% | +4% | +4% | +3% | -7% | -3% | -3% | +19% | +16% | +41% |
| CCK | +0% | -3% | +1% | -0% | +6% | +2% | +9% | -12% | -2% | -3% | +18% | +5% | +20% |
| GPK | -0% | -12% | -18% | +1% | -6% | -3% | -17% | -18% | -4% | +18% | -5% | +2% | -50% |
| BALL | -8% | -4% | -7% | +5% | +7% | +7% | +18% | -12% | +3% | -10% | +15% | +4% | +15% |
Source: Yahoo Finance monthly adjusted close.
Quick Thesis
- Rated sell because leverage is high and earnings remain deeply negative.
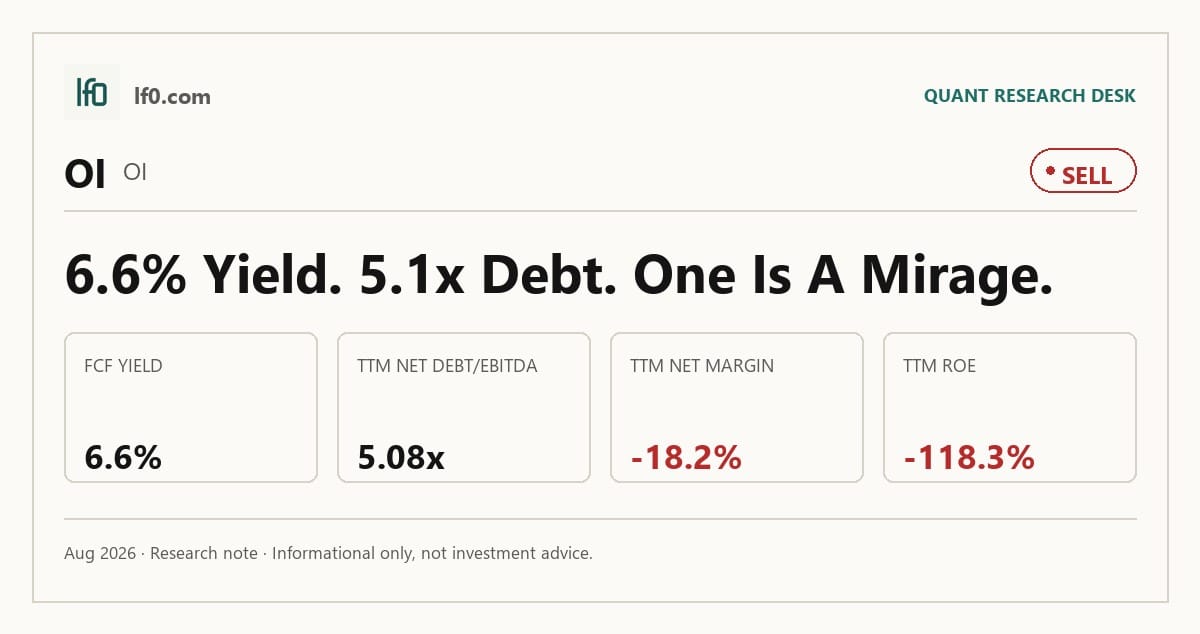
- TTM free cash flow yield is 6.6%, but net debt/EBITDA is 5.1x.
- The main risk is execution on Fit to Win while demand stays soft.
- OI trades at 6.41x EV/EBITDA and 0.92x EV/revenue, below peers.
- I would turn more constructive only if leverage falls below 4.5x, meaning faster deleveraging.
Executive Summary
Rating: SELL | OI
Measured from adjusted close on 2026-08-14 to 2026-09-25. Sell ratings are correct when the stock falls; Hold is tracked as a +/-10% range. Daily-close data, not intraday. Calls are tracked for 182 days from publication, then frozen as a final record.
I would put my rating as a sell because the company’s cash generation is not yet strong enough to offset a 5.1x net debt/EBITDA load and a still-negative net margin. In my view, the key tension is that O-I Glass has a real cost-reset program, but the operating base is still shrinking and the balance sheet is not de-risking fast enough to make the equity case clean.
The best near-term support is the 6.6% FCF yield, which shows the business still throws off cash after capex and interest. What keeps me cautious is that the same quarter that showed a $1.7B revenue base also produced a -$619M EBITDA print, so the margin recovery has not yet proven to me that it is durable.
I would raise my rating more towards a buy if Fit to Win delivers the promised $750M of cumulative benefits through 2027 and operating margin moves back above the current 7.2% TTM level, meaning the cost base is actually resetting. Until then, I think the stock is cheap for a reason.
Company Profile
O-I Glass makes glass containers for food and beverage customers, with revenue driven mainly by long-term supply relationships and a global furnace network that sits close to customers. The company traces its roots to 1903 and operates in North America, Europe, and Latin America, where freight costs make local production important. It also owns a minority stake in the Magma joint venture in Mexico, which adds regional supply capacity.
Economic Moat
Business Model
I think the core advantage here is the company’s dense manufacturing footprint, because glass containers are bulky and expensive to ship. O-I runs 68 plants in 19 countries in the current 10-K, and that scale is hard to replicate quickly because a rival would need years of capital, permits, and customer qualification to match local coverage. In most of the countries where it operates, O-I is also the leading glass container manufacturer, which supports customer retention and local pricing power.
The Fit to Win program is the clearest sign that management is trying to turn that footprint into a lower-cost network rather than just defend volume. That matters for the moat because a smaller but better-positioned plant base can be harder to displace than a broad legacy network with excess capacity.
Business & Operating Risks
The most material disclosed risk is execution on Fit to Win, because the program is expected to run at least through 2026 and has already generated significant pre-tax charges and cash outflows for severance and exit costs. If the planned furnace closures and workforce reductions do not deliver the expected savings, the company takes the charges without the offset, which would weaken the very cost advantage the network is supposed to create. Energy cost exposure is the next major risk: in Europe, natural gas is the primary energy source and can represent 10% to 20% of manufacturing costs, so a supply disruption or price spike would hit EBITDA quickly. Trade policy, customer destocking, and substitute packaging formats add further pressure, but they do not directly break the moat; they mainly test whether O-I can keep its local-scale advantage while absorbing higher input costs.
The Barrick-style dispute risk does not apply here, so the disclosed risks are more about execution and cost inflation than about a structural loss of the company’s local manufacturing edge.
Management Discussion & Analysis
Management is clearly responding to those risks with a heavy restructuring and deleveraging push. The company expects at least $275M of Fit to Win benefits in 2026 and at least $750M through 2027, while also budgeting about $150M of restructuring payments and about $450M of capex in 2026, so cash will stay tight even if margins improve. That is the right response to the risk profile, but it also tells me the equity case depends on execution rather than on a demand rebound.
Sales volumes are expected to be flat to slightly down in 2026, and management’s longer-run growth guide is only 1% to 2% annually after 2027. I read that as a sign that the top line is not the main lever here; the thesis depends on cost takeout, plant rationalization, and lower restructuring drag. The company’s 2025 results already showed about $240M of Fit to Win benefits, which supports management’s credibility on cost actions, even though the broader demand picture remains weak.
Recent Events
The most important recent event is the May 18, 2026 issuance of $500M of 9.5% senior notes due 2033 by Owens-Brockway Glass Container Inc., guaranteed by O-I Glass and key U.S. subsidiaries. That move pushes out refinancing risk and improves near-term liquidity, but the 9.5% coupon shows the market is charging a steep price for the relief. In my view, this is a useful bridge, not a repair of the capital structure.
The company also used the proceeds, revolver borrowings, and cash to redeem about $612M of 6.625% notes due 2027. That removes a nearer maturity wall, which is helpful, but it leaves O-I leaning on more expensive debt. The March 2026 departure of the chief sales and marketing officer is a smaller signal, yet it lands while the company is still trying to stabilize pricing and mix, so I see it as a modest operating headwind rather than a thesis changer.
Financial Analysis
Growth
OI — Financial Growth (Quarterly, USD Mil)
| Metric | 2025-06-30 | 2025-09-30 | 2025-12-31 | 2026-03-31 | 2026-06-30 |
|---|---|---|---|---|---|
| REVENUE (USD Mil) | 1,706 | 1,653 | 1,500 | 1,540 | 1,668 |
| EBIT (USD Mil) | 92 | 149 | -48 | 26 | -741 |
| EBITDA (USD Mil) | 212 | 272 | 70 | 145 | -619 |
| NET INCOME (USD Mil) | -5 | 30 | -138 | -73 | -972 |
| DILUTED EPS | 0 | 0.2 | -0.9 | -0.5 | -6.3 |
Source: Yahoo Finance — Quarterly Financial Statements
Revenue fell from $1.7B in Q2 2025 to $1.5B in Q4 2025, then recovered to $1.7B in Q2 2026, so the top line has stabilized but not yet re-accelerated. The cleanest read is that revenue was essentially flat year over year in Q2 2026, which tells me the business is not compounding and the market should not pay for a growth rerating. EBITDA was more volatile, moving from $272M in Q3 2025 to -$619M in Q2 2026, which shows earnings are still much less stable than sales.
Profitability
OI — Profitability (TTM)
| Metric | TTM |
|---|---|
| Operating Margin (TTM) | 7.2% |
| Net Margin (TTM) | -18.2% |
| Return on Assets (TTM) | 3.6% |
| Return on Equity (TTM) | -118.3% |
| Gross Margin (TTM) | 14.8% |
| EBITDA Margin (TTM) | 14.4% |
Source: Yahoo Finance — Trailing Twelve Months (TTM)
TTM gross margin was 14.8% and EBITDA margin was 14.4%, so the core glass business still clears a modest spread before overhead. The problem is what happens below that line: operating margin is 7.2% and net margin is -18.2%, which means restructuring, interest, and corporate costs are still swallowing most of the operating profit. TTM ROA of 3.6% is positive, but ROE of -118% shows equity returns are still being crushed by losses and leverage. That gap is consistent with the moat discussion above: the network can still earn a spread, but it is not yet producing enough clean profit to justify a premium multiple.
Valuation
OI — Valuation Multiples
| Metric | Value |
|---|---|
| Market Cap (USD Mil) | 1,049 |
| Enterprise Value (USD Mil) | 5,854 |
| Trailing P/E | — |
| Forward P/E | 4.5 |
| Price/Sales (TTM) | 0.2 |
| Price/Book (mrq) | 2.7 |
| EV/Revenue | 0.9 |
| EV/EBITDA | 6.4 |
| Beta (5Y Monthly) | 0.66 |
| FCF Yield % (TTM) | 6.6% |
| Forward EPS (USD) | 1.5 |
| Analyst Target Price – Low (USD) | 8 |
| Analyst Target Price – Mean (USD) | 9.9 |
| Analyst Target Price – High (USD) | 13 |
| # Analyst Opinions | 9 |
Source: Yahoo Finance
OI screens on cash flow and earnings power, not on sales multiples. EV/revenue is 0.92x and price/sales is 0.165x, which tells me the market is pricing in weak conversion and recurring restructuring charges rather than stable mid-cycle profitability. EV/EBITDA is 6.41x and forward P/E is 4.55x, while forward EPS is 1.5, so the stock is cheap on headline earnings but not obviously mispriced once leverage is included.
On the analysis here, I would put fair value in a range of roughly $8–$13 per share. That range sits inside the analyst target range of $8–$13 from 9 estimates, which tells me the Street is broadly aligned with my view rather than pushing for a much higher rerating. I would not call that a strong consensus conviction, but it does support the idea that the stock is already discounting a lot of the repair work.
The peer comparison also matters. OI’s forward EPS of 1.5 is well below SLGN’s $4.1, GEF’s $4.8, CCK’s $9.0, GPK’s $1.1, and BALL’s $4.5, so the stock is not cheap because earnings are strong; it is cheap because earnings are weak and the balance sheet is heavier than peers. That is why I think the current multiple is fair to slightly attractive rather than outright cheap.
Leverage
OI — Leverage & Coverage (Quarterly)
| Metric | Value |
|---|---|
| Total Debt/Equity % (mrq) | 925 |
| Current Ratio (mrq) | 1.3 |
| Total Debt (mrq, USD Mil) | 4,986 |
| Operating Cash Flow (TTM, USD Mil) | 416 |
| Levered Free Cash Flow (TTM, USD Mil) | 69.6 |
| Net Debt/EBITDA (TTM) | 5.1 |
| FCF Margin % (TTM) | 1.1% |
Source: Yahoo Finance — Quarterly Financial Statements
OI’s leverage is stretched but still serviceable. Total debt/equity is 925%, current ratio is 1.261, and total debt is $4986, so the capital structure is debt-heavy and leaves only a modest liquidity cushion. Operating cash flow is $416M and levered free cash flow is $69.62M, which means the business still converts to cash, but not at a rate that quickly repairs the balance sheet. Net debt/EBITDA is 5.084x and FCF margin is 1.09%, so the company can absorb a normal quarter, but not a prolonged downturn without pressure on refinancing terms.
The recent note issuance helps near-term liquidity, yet it does not change the fact that leverage is high relative to peers. That is the key bridge between the capital structure and the valuation case: the stock can look optically cheap on EV/revenue, but the debt load limits how much of that discount should be treated as upside.
Insider Activity
The insider tape is mildly constructive. Over the sample period, I see 5 open-market purchases totaling $279368 and 2 open-market sales totaling $389989, with buying spread across a director and several senior officers. I would not overread the dollar amounts, but the direction is better than silence and it suggests management alignment is improving while the restructuring is underway.
Comparable Analysis
Growth
| Company | Revenue TTM (USD Mil) | Revenue Growth YoY % | Diluted EPS TTM |
|---|---|---|---|
| OI | 6,360 | -2.2% | -7.6 |
| SLGN | 6,681.9 | 6.8% | 2.5 |
| GEF | 4,302.9 | 3.5% | 2.4 |
| CCK | 13,256 | 16.5% | 6.8 |
| GPK | 8,637 | -0.7% | 0.7 |
| BALL | 14,326 | 19.7% | 3.5 |
Source: Yahoo Finance
OI’s revenue fell 2.2% in TTM, while SLGN grew 6.8%, GEF grew 3.5%, CCK grew 16.5%, BALL grew 19.7%, and GPK was only slightly weaker at -0.7%. That puts OI at the back of the group on growth, so any valuation support has to come from cash generation or a later-cycle recovery rather than current top-line momentum.
Valuation
| Company | Trailing P/E | Forward P/E | EV/Revenue | EV/EBITDA | Price/Sales (TTM) | Price/Book (mrq) | Market Cap (USD Mil) | Enterprise Value (USD Mil) | Beta (5Y Monthly) | FCF Yield % (TTM) | Forward EPS | Analyst Target Price – Low | Analyst Target Price – Mean | Analyst Target Price – High | # Analyst Opinions |
|---|---|---|---|---|---|---|---|---|---|---|---|---|---|---|---|
| OI | — | 4.5 | 0.9 | 6.4 | 0.2 | 2.7 | 1,049 | 5,854 | 0.66 | 6.6% | 1.5 | 8 | 9.9 | 13 | 9 |
| SLGN | 16.5 | 10.3 | 1.3 | 9.1 | 0.7 | 1.9 | 4,458 | 8,939 | 0.68 | 7.0% | 4.1 | 47 | 54.8 | 61 | 13 |
| GEF | 36.2 | 18.4 | 1.4 | 10.5 | 1.2 | 1.7 | 4,977 | 6,110 | 0.77 | — | 4.8 | 74 | 87.2 | 100 | 5 |
| CCK | 17.2 | 13.2 | 1.4 | 8.9 | 1 | 4.5 | 12,967 | 18,841 | 0.58 | 6.6% | 9 | 121 | 136.6 | 155 | 14 |
| GPK | 17.7 | 10.3 | 1 | 7.9 | 0.4 | 1 | 3,395 | 9,001 | 0.66 | 7.0% | 1.1 | 10 | 12.6 | 18 | 11 |
| BALL | 17.7 | 13.7 | 1.6 | 11.3 | 1.1 | 2.9 | 16,478 | 23,495 | 0.96 | 2.3% | 4.5 | 63 | 72.6 | 79 | 14 |
Source: Yahoo Finance
OI’s EV/revenue of 0.92x and price/sales of 0.165x are below SLGN at 1.3x and 0.7x, GEF at 1.4x and 1.2x, CCK at 1.4x and 1.0x, GPK at 1.0x and 0.4x, and BALL at 1.6x and 1.1x. The stock’s FCF yield of 6.6% is competitive with SLGN, CCK, and GPK, but OI’s lower growth and heavier leverage explain why the market is not awarding it a richer multiple. On a growth-adjusted basis, the discount looks justified rather than extreme.
Profitability
| Company | Operating Margin (TTM) | Net Margin (TTM) | Return on Assets (TTM) | Return on Equity (TTM) | Gross Margin (TTM) | EBITDA Margin (TTM) |
|---|---|---|---|---|---|---|
| OI | 7.2% | -18.2% | 3.6% | -118.3% | 14.8% | 14.4% |
| SLGN | 10.3% | 4.0% | 4.2% | 11.7% | 17.1% | 14.6% |
| GEF | 10.6% | 24.7% | — | — | 22.5% | 13.5% |
| CCK | 12.6% | 5.9% | 7.1% | 27.4% | 21.0% | 16.0% |
| GPK | 4.5% | 2.2% | 3.1% | 6.0% | 15.5% | 13.2% |
| BALL | 9.2% | 6.6% | 4.6% | 17.2% | 18.6% | 14.5% |
Source: Yahoo Finance
OI’s operating margin of 7.2%, EBITDA margin of 14.4%, and net margin of -18.2% trail the better peers, especially CCK and GEF on operating and net profitability. The gross-margin gap is smaller than the net-margin gap, which tells me the issue is more overhead, interest, and restructuring than basic manufacturing economics. That is a tougher problem to fix than a simple cost-of-goods gap.
Leverage
| Company | Total Debt/Equity % (mrq) | Current Ratio (mrq) | Total Debt (mrq, USD Mil) | Operating Cash Flow TTM (USD Mil) | Free Cash Flow TTM (USD Mil) | Net Debt/EBITDA (TTM) | FCF Margin % (TTM) |
|---|---|---|---|---|---|---|---|
| OI | 925 | 1.3 | 4,986 | 416 | 69.6 | 5.1 | 1.1% |
| SLGN | 203.2 | 1.3 | 4,833.8 | 640.8 | 313.3 | 4.6 | 4.7% |
| GEF | 39.4 | 1.3 | 1,233.6 | -52.2 | — | 1.6 | — |
| CCK | 186.3 | 1 | 6,272 | 1,726 | 853.9 | 2.7 | 6.4% |
| GPK | 176.2 | 1.4 | 5,702 | 793 | 237.9 | 4.8 | 2.8% |
| BALL | 131.5 | 1.1 | 7,582 | 1,426 | 379.9 | 3.4 | 2.6% |
Source: Yahoo Finance
OI’s total debt/equity of 925% is far above SLGN at 203.2%, GEF at 39.4%, CCK at 186.3%, GPK at 176.2%, and BALL at 131.5%. Net debt/EBITDA of 5.084x is also elevated versus GEF at 1.6x, CCK at 2.7x, and BALL at 3.4x, while OI’s current ratio of 1.261 is only average. In other words, the company’s valuation discount is partly a leverage discount, not just a growth discount.
Conclusion
I would put my rating as a sell because the stock still depends on a cost reset that has not yet shown up cleanly in the numbers. The tension is straightforward: O-I Glass has enough cash generation to avoid a distress case, but the combination of 5.1x net debt/EBITDA, -18.2% net margin, and only 1.1% FCF margin leaves too little room for execution error.
The bull case is real if Fit to Win keeps delivering and the company can turn the current 7.2% operating margin into something meaningfully higher. I would move my rating more towards a buy if cumulative Fit to Win benefits reach $750M through 2027 and operating margin moves back above 7.2%, meaning the cost base is actually resetting rather than just being reshaped. On the current revenue base, even a 200 bp margin lift would add roughly $128M of annual operating profit, which would improve the deleveraging path and make the current 5.1x net debt/EBITDA look more manageable.
The bear case is that sales volumes stay flat to slightly down in 2026 and the company cannot offset the roughly $150M of higher European energy cost it flagged for 2026. If that happens, I would move from sell toward a stronger sell because earnings would stay weak while the debt load remains heavy. A second warning sign would be another year of heavy restructuring without a visible drop in leverage, since the current 1.3 current ratio and 5.1x net debt/EBITDA already leave limited flexibility if demand softens again.
Weighing both sides, I think the market is already giving O-I Glass credit for a recovery that still needs to show up in earnings. The stock is cheap enough to avoid a buy, but the operating reset is not yet visible enough for me to argue that the discount is fully earned.
What to Watch Next
- Fit to Win benefits reaching $750M through 2027 — would support a move toward Buy.
- Operating margin moving back above 7.2% — would show the cost base is resetting.
- Net debt/EBITDA falling below 4.5x — would signal faster deleveraging.
- Sales volumes turning above flat in 2026 — would reduce the bear case on demand.
- European energy costs staying near the flagged $150M level — would keep pressure on earnings.
What’s your take? I rated O-I Glass (OI) SELL above — but the goal here is to get this right, not just to publish an opinion. What would you add to this analysis, or which risk or catalyst do you think I’m under- or over-weighting? Tell me in the comments.
Sources
- SEC 10-K Annual Report — filed 2026-02-12
- SEC 8-K Filing (2026-05-18)
- SEC 8-K Filing (2026-05-13)
- SEC 8-K Filing (2026-05-04)
- SEC 8-K Filing (2026-04-28)
- SEC 8-K Filing (2026-03-05)
- SEC 8-K Filing (2026-02-25)
- SEC Form 4 Insider Transaction (2026-05-19)
- SEC Form 4 Insider Transaction (2026-05-15)
- SEC Form 4 Insider Transaction (2026-05-15)
- SEC 10-K Annual Report — FY2026
- SEC 10-K Annual Report — FY2025
- SEC 10-K Annual Report — FY2024
- SEC 10-K Annual Report — FY2023
- SEC 10-K Annual Report — FY2022
Data sourced from Yahoo Finance and SEC EDGAR. Not investment advice.
Leave a Comment