
| Company | Aug 25 | Sep 25 | Oct 25 | Nov 25 | Dec 25 | Jan 26 | Feb 26 | Mar 26 | Apr 26 | May 26 | Jun 26 | Jul 26 | 12-Mo |
|---|---|---|---|---|---|---|---|---|---|---|---|---|---|
| NLST | +29% | +11% | -32% | -2% | +41% | +35% | +0% | +30% | +49% | +32% | +1% | -24% | +256% |
| MU | +9% | +41% | +34% | +6% | +21% | +45% | -1% | -18% | +53% | +88% | +19% | -29% | +655% |
| WDC | +2% | +50% | +25% | +9% | +6% | +45% | +12% | -3% | +61% | +22% | +20% | -15% | +594% |
| STX | +7% | +41% | +8% | +8% | -0% | +48% | +0% | -4% | +72% | +31% | +10% | -11% | +450% |
| SNDK | +22% | +114% | +78% | +12% | +6% | +143% | +10% | -0% | +73% | +55% | +34% | -47% | +2730% |
Source: Yahoo Finance monthly adjusted close.
Quick Thesis
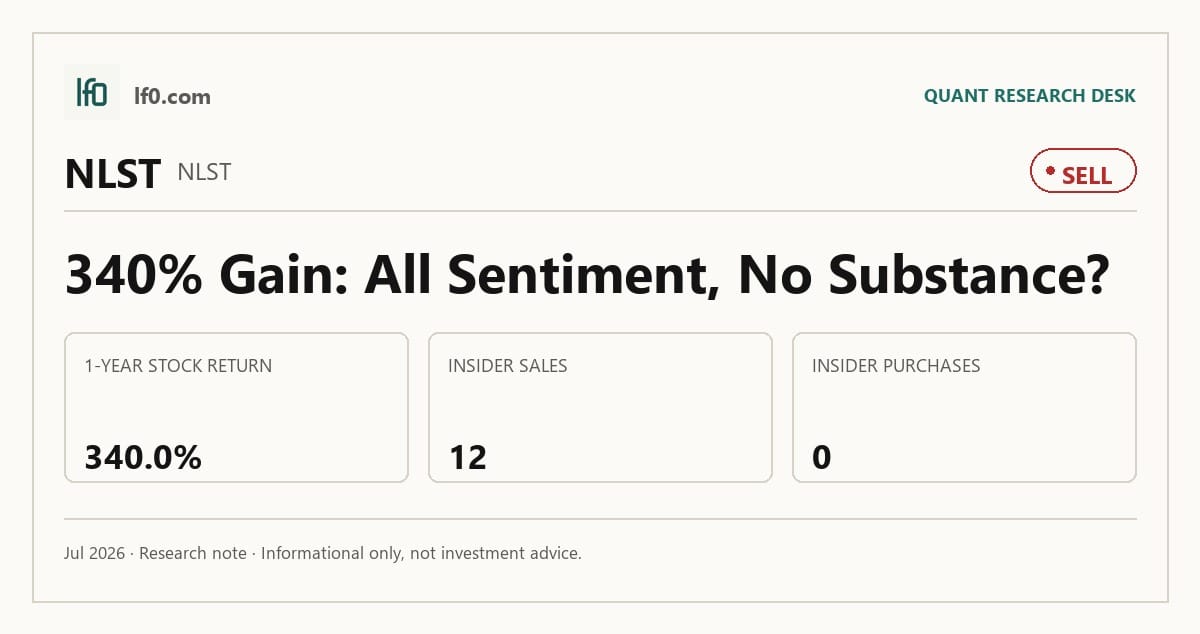
- Rated sell because the stock prices in cleaner cash conversion than Netlist has delivered.
- Strongest point: Q1 2026 revenue reached $104.9M, with EBITDA turning positive at $8.6M.
- Biggest risk: operating cash flow was -$15.5M TTM, so earnings are not yet self-funding.
- Valuation is rich at 5.3x EV/revenue and 48.7x EV/EBITDA.
- I would raise my rating if quarterly revenue stays above $100M and operating cash flow turns positive.
Executive Summary
Rating: SELL | NLST
Measured from adjusted close on 2026-07-27 to 2026-10-23. Sell ratings are correct when the stock falls; Hold is tracked as a +/-10% range. Daily-close data, not intraday. Calls are tracked for 182 days from publication, then frozen as a final record.
I would put my rating as a sell because Netlist has finally shown operating leverage, but the market is already discounting a much cleaner cash-conversion path than the company has proved. Q1 2026 revenue reached $104.9M and EBITDA turned positive at $8.6M, yet TTM operating cash flow was still -$15.5M and FCF yield was only 0.4%, so the equity still depends on execution rather than on self-funding. In my view, the key question is whether the current run rate can hold while cash generation improves; I would move toward a buy if quarterly revenue stays above $100M and operating cash flow turns positive for two straight quarters.
Company Profile
Netlist designs and sells memory and storage subsystems for servers, high-performance computing, communications, data centers, cloud, and industrial customers. Revenue comes from OEM sales of specialty DIMMs, embedded flash, component resales, excess inventory sales, and Netlist-branded modules with one- to five-year warranties. The company operates one reportable segment, had 72 employees as of December 27, 2025, and runs research and development from Irvine, California while using third-party manufacturing in China, Taiwan, and Korea. It has over 200 issued patents and pending applications worldwide, and its product set includes distributed buffer memory modules and Compute Express Link, or CXL, memory expansion technology.
Economic Moat
Business Model
The clearest structural edge here is the patented memory architecture. Netlist’s distributed buffer design, on-module power management, and low-profile DIMM formats are embedded in the module itself, and in my view a competitor would struggle to replicate that design depth quickly. The company also works closely with OEMs early in product definition, which helps it fit custom designs into server and data-center systems. That said, the moat is narrower than the patent count alone suggests because many of the core ideas have already been adopted across the industry, including distributed architecture for DDR4 LRDIMM and on-module power management for DDR5. I think that makes the business more than a simple reseller, but not yet a franchise with wide pricing power.
Business & Operating Risks
The biggest disclosed risk is that litigation may not convert into cash, because Netlist says it may not be able to collect damages already awarded and that collection can be lengthy, costly, and unpredictable. That risk is not abstract: the company has legal wins on paper, but the financial data still shows a business that has only recently turned EBITDA positive and has not yet proven to me that awards will translate into durable cash flow. Netlist also remains exposed to supply concentration, especially products sourced from SK hynix, and the filing says a large portion of net product sales in certain periods came from those resales while the supply agreement expires in April 2026. Customer concentration adds another layer, with two customers representing about 30% and 13% of net product sales for the year ended December 27, 2025. The disclosed risks do not directly break the patent-based moat, but they do threaten the monetization engine that is supposed to turn that moat into equity value.
Management Discussion & Analysis
Management appears to be responding to the supply and concentration risks through a more focused product mix and continued investment in patented memory technologies, but the litigation monetization issue remains unresolved as of the filing date. The shift toward AI-relevant memory, DDR5, and CXL suggests the company is trying to move up the value chain rather than rely only on resales, which is the right strategic response if it wants the moat to matter financially. I also note that the company has tightened its operating footprint to one reportable segment, which reads to me as a sign of focus rather than expansion for its own sake. The key point is that management is trying to reduce dependence on legacy product flows, but the cash outcome has not yet caught up.
Recent Events
The most important recent event is the March 4, 2026 lease amendment, which extends the Irvine headquarters lease to December 31, 2029. That supports operating continuity, but it is housekeeping rather than a thesis-changing move, and it does not alter the core question of whether the company can turn legal and product assets into repeatable cash flow. The March 3, 2026 and May 12, 2026 8-K filings were routine earnings releases, so they confirm the company is still in reporting mode rather than in a phase of strategic restructuring, financing, or M&A. In my view, recent events leave the moat thesis intact but unproven financially.
Financial Analysis
Growth
NLST — Financial Growth (Quarterly, USD Mil)
| Metric | 2025-03-31 | 2025-06-30 | 2025-09-30 | 2025-12-31 | 2026-03-31 | 2026-06-30 |
|---|---|---|---|---|---|---|
| REVENUE (USD Mil) | 29 | 41.7 | 42.2 | 75.7 | 104.9 | — |
| EBITDA (USD Mil) | -9.7 | -6.2 | -7.1 | -2.3 | 8.6 | — |
| DILUTED EPS | — | 0 | 0 | 0 | 0 | 0 |
Source: Yahoo Finance — Quarterly Financial Statements
Revenue rose from $29M in Q1 2025 to $41.7M in Q2 2025, $42.2M in Q3 2025, $75.7M in Q4 2025, and $104.9M in Q1 2026. That is a sharp step-up, and Q1 2026 revenue was 262% higher year over year, which tells me the business has moved from recovery mode into a materially larger run rate. EBITDA improved from -$9.7M in Q1 2025 to $8.6M in Q1 2026, so the growth is now carrying operating leverage as well as top-line momentum. This is consistent with the company’s patent-led memory focus described above, but the next test is whether the higher base can hold without a reversal in cash flow.
Profitability
NLST — Profitability (TTM)
| Metric | TTM |
|---|---|
| Operating Margin (TTM) | 16.5% |
| Net Margin (TTM) | 0.2% |
| Return on Assets (TTM) | 39.1% |
| Return on Equity (TTM) | 9.7% |
| Gross Margin (TTM) | 16.2% |
| EBITDA Margin (TTM) | 10.9% |
Source: Yahoo Finance — Trailing Twelve Months (TTM)
TTM gross margin was 16.2% and EBITDA margin was 10.9%, which shows the company is clearing product cost but still has limited room after operating expenses. Net margin was only 0.2% TTM, so the business is barely above breakeven on a bottom-line basis even after the recent improvement in EBITDA. Return on assets was 39.1% TTM and return on equity was 9.7% TTM, which tells me the return profile is being shaped by a small equity base more than by durable capital efficiency. The key takeaway is that profitability is improving, but it has not yet become strong enough to justify complacency on valuation.
Valuation
NLST — Valuation Multiples
| Metric | Value |
|---|---|
| Market Cap (USD Mil) | 1,786 |
| Enterprise Value (USD Mil) | 1,760 |
| Forward P/E | 8.5 |
| Price/Sales (TTM) | 5.4 |
| EV/Revenue | 5.3 |
| EV/EBITDA | 48.7 |
| Beta (5Y Monthly) | 1.28 |
| FCF Yield % (TTM) | 0.4% |
| Forward EPS (USD) | 0.6 |
| Analyst Target Price – Low (USD) | 15 |
| Analyst Target Price – Mean (USD) | 15 |
| Analyst Target Price – High (USD) | 15 |
| # Analyst Opinions | 1 |
Source: Yahoo Finance
Netlist trades at 5.3x EV/revenue, 5.4x price/sales, 48.7x EV/EBITDA, and 8.5x forward P/E, while FCF yield is only 0.4% TTM. That combination says the market is already paying for a much cleaner earnings path than the current cash flow supports. On the analysis here, I would put fair value in a range of $10–$14 per share, using a peer EV/revenue framework and then discounting for Netlist’s weaker cash conversion and higher execution risk. That range sits just below the single analyst target of $15, which is not a meaningful consensus, so I do not read the target as strong external confirmation. Forward EPS is 0.6, and that looks reasonable only if the company can sustain the current earnings step-up; against peers, the implied earnings power is still less proven even if the share price has already rerated. Put differently, the stock is not cheap simply because the absolute share price is low.
Leverage
NLST — Leverage & Coverage (Quarterly)
| Metric | Value |
|---|---|
| Total Debt/Equity % (mrq) | 17.6 |
| Current Ratio (mrq) | 1.4 |
| Net Debt/EBITDA (TTM) | -0.7 |
| FCF Margin % (TTM) | 1.9% |
Source: Yahoo Finance — Quarterly Financial Statements
Total debt/equity was 17.6% mrq, current ratio was 1.4, and total debt was $4.1M, so the balance sheet itself is not stretched. The issue is cash generation: operating cash flow was -$15.5M TTM, while levered free cash flow was $6.3M and net debt/EBITDA was -0.7x, which reflects net cash rather than net debt. I view that as a useful cushion, but not a substitute for sustained cash conversion. The company has enough liquidity to avoid immediate stress, yet the equity case still depends on EBITDA turning into cash rather than just accounting profit.
Insider Activity
Insiders were net sellers over the most recent sample, with 12 open-market sales and no open-market purchases from March 12, 2026 through May 15, 2026. The selling was broad, involving the CEO, CFO, and two directors, which weakens alignment with outside shareholders. I do not treat insider selling as a thesis breaker on its own, but it does not help when the stock already trades on a demanding cash-flow multiple.
Comparable Analysis
Growth
| Company | Revenue TTM (USD Mil) | Revenue Growth YoY % | EBITDA TTM (USD Mil) | Diluted EPS TTM |
|---|---|---|---|---|
| NLST | 332.7 | 163.4% | 36.1 | 0 |
| MU | 90,274 | 345.7% | 68,222 | 41.7 |
| WDC | 12,919 | 43.8% | 5,002 | 26.9 |
| STX | 12,195 | 48.5% | 4,502 | 0.2 |
| SNDK | 20,248 | 371.6% | 12,617 | 73.8 |
Source: Yahoo Finance
Netlist’s revenue growth of 163.4% TTM is strong, but it trails SNDK’s 371.6% and MU’s 345.7%, while also lagging the scale of WDC and STX in absolute revenue. That matters because the market is not paying a small-company multiple for Netlist; it is paying a growth multiple that assumes the company can keep compounding from here. I think the growth profile is real, but it is not unique enough to justify the valuation on its own.
Valuation
| Company | Trailing P/E | Forward P/E | EV/Revenue | EV/EBITDA | Price/Sales (TTM) | Price/Book (mrq) | Beta (5Y Monthly) | FCF Yield % (TTM) | Forward EPS | Analyst Target Price – Low | Analyst Target Price – Mean | Analyst Target Price – High | # Analyst Opinions |
|---|---|---|---|---|---|---|---|---|---|---|---|---|---|
| NLST | — | 8.5 | 5.3 | 48.7 | 5.4 | 74.1 | 1.28 | 0.4% | 0.6 | 15 | 15 | 15 | 1 |
| MU | 21.8 | 5.9 | 11.2 | 14.8 | — | 10.2 | 2.21 | 0.7% | 155 | 361 | 1,515.1 | 2,200 | 44 |
| WDC | 16.2 | 13.7 | 12.1 | 31.3 | 12.2 | 20.8 | 2.22 | 1.5% | 31.7 | 420 | 664.9 | 1,050 | 24 |
| STX | 3,311 | 14.4 | 14.9 | 40.5 | 14.8 | 162.8 | 2.10 | 1.1% | 55.4 | 700 | 1,125 | 1,600 | 23 |
| SNDK | 20.2 | 5.6 | 10.6 | 17 | 10.8 | 16 | — | 3.5% | 264.7 | 1,000 | 2,126.2 | 3,600 | 23 |
Source: Yahoo Finance
Netlist’s 5.3x EV/revenue and 0.4% FCF yield sit well below the cash-return profile of SNDK at 3.5%, and the stock also trades on a richer EV/EBITDA basis than most peers. The peer set is useful here because the valuation premium is not being matched by a premium in cash generation, which is why I do not think the market is underpricing the business. Netlist’s higher multiple also looks harder to defend when paired with its weaker leverage profile and still-negative operating cash flow.
Profitability
| Company | Operating Margin (TTM) | Net Margin (TTM) | Return on Assets (TTM) | Return on Equity (TTM) | Gross Margin (TTM) | EBITDA Margin (TTM) |
|---|---|---|---|---|---|---|
| NLST | 16.5% | 0.2% | 39.1% | 9.7% | 16.2% | 10.9% |
| MU | 80.4% | 55.9% | 34.9% | 66.6% | 72.6% | 75.6% |
| WDC | 43.6% | 72.9% | 20.8% | 130.9% | 48.9% | 38.7% |
| STX | 43.1% | 26.1% | 29.4% | 371.5% | 45.6% | 36.9% |
| SNDK | 78.5% | 56.5% | 43.9% | 91.6% | 71.5% | 62.3% |
Source: Yahoo Finance
Netlist’s 16.5% operating margin and 10.9% EBITDA margin are far below the peer group, where MU, SNDK, WDC, and STX all post materially stronger margins. Gross margin at 16.2% is also much lower than the peers, which tells me the gap is not just overhead absorption; it is also product economics. On a like-for-like basis, the company is still trying to catch up on profitability while peers are already monetizing scale more efficiently.
Leverage
| Company | Total Debt/Equity % (mrq) | Current Ratio (mrq) | Free Cash Flow TTM (USD Mil) | Net Debt/EBITDA (TTM) | FCF Margin % (TTM) |
|---|---|---|---|---|---|
| NLST | 17.6 | 1.4 | 6.3 | -0.7 | 1.9% |
| MU | 6.3 | 3.4 | 7,639.5 | -0.3 | 8.5% |
| WDC | 13.4 | 1.3 | 2,268.8 | -0.1 | 17.6% |
| STX | 179.9 | 1.7 | 1,943.8 | 0.5 | 15.9% |
| SNDK | 1.3 | 2.3 | 7,720.9 | -0.4 | 38.1% |
Source: Yahoo Finance
Netlist’s 17.6% debt/equity and 1.4 current ratio are manageable, and its -0.7x net debt/EBITDA shows net cash rather than net leverage. That is better than the balance-sheet stress profile you see in more levered names, but the comparison is less flattering once you look at cash flow: operating cash flow is negative, while peers such as MU and SNDK generate far more cash. In other words, Netlist’s balance sheet is not the problem, but it also is not the reason to own the stock.
Conclusion
I would put my rating as a sell because the central tension is no longer whether Netlist can grow revenue; it is whether that growth can turn into cash before the market loses patience. Q1 2026 showed the right direction, with revenue above $100M and EBITDA positive, but the company still posted -$15.5M of operating cash flow TTM and only 0.4% FCF yield, so the improvement has not yet shown up where it matters most. That is why I think the current valuation is ahead of the business.
I would raise my rating more toward a buy if Netlist can keep quarterly revenue above $100M, hold EBITDA in positive territory, and turn operating cash flow positive for two straight quarters. That would tell me the Q1 2026 step-up was not a one-quarter spike and that the business is finally converting scale into cash. I would also become more constructive if the SK hynix supply agreement is renewed on acceptable terms, because that would reduce the risk that resales interrupt the current run rate.
I would move from sell to strong sell if revenue falls back below $75M a quarter, roughly the Q4 2025 level, or if operating cash flow stays negative while the supply renewal fails to land. In that case, the current valuation would be asking investors to pay for growth that is not translating into self-funding economics.
Weighing both sides, I lean to the bear case because the stock already reflects a recovery that still needs proof in cash generation, not just in revenue. The next meaningful move, in my view, is more likely to come from disappointment than from rerating unless management can show that the Q1 2026 margin improvement is durable.
What to Watch Next
- Quarterly revenue above $100M — would support a move toward Buy.
- Two straight quarters of positive operating cash flow — would confirm cash conversion is improving.
- EBITDA staying positive — would show the Q1 2026 margin step-up is durable.
- SK hynix supply renewal on acceptable terms — would reduce resales risk.
- Operating cash flow staying negative — would keep the sell case intact.
What’s your take? I rated Netlist (NLST) SELL above — but the goal here is to get this right, not just to publish an opinion. What would you add to this analysis, or which risk or catalyst do you think I’m under- or over-weighting? Tell me in the comments.
Sources
- SEC 10-K Annual Report — filed 2026-03-19
- SEC 8-K Filing (2026-05-12)
- SEC 8-K Filing (2026-03-09)
- SEC 8-K Filing (2026-03-03)
- SEC Form 4 Insider Transaction (2026-05-19)
- SEC Form 4 Insider Transaction (2026-05-13)
- SEC Form 4 Insider Transaction (2026-04-24)
- SEC 10-K Annual Report — FY2026
- SEC 10-K Annual Report — FY2025
- SEC 10-K Annual Report — FY2024
- SEC 10-K Annual Report — FY2023
- SEC 10-K Annual Report — FY2022
Data sourced from Yahoo Finance and SEC EDGAR. Not investment advice.
Leave a Comment