
| Company | Jul 25 | Aug 25 | Sep 25 | Oct 25 | Nov 25 | Dec 25 | Jan 26 | Feb 26 | Mar 26 | Apr 26 | May 26 | Jun 26 | 12-Mo |
|---|---|---|---|---|---|---|---|---|---|---|---|---|---|
| TEVA | -8% | +19% | +10% | +1% | +31% | +16% | +9% | -1% | -11% | +16% | +1% | -4% | +102% |
| TAK | -11% | +9% | -2% | -8% | +7% | +8% | +11% | +9% | -1% | -10% | -4% | +0% | +4% |
| PFE | -2% | +6% | +3% | -3% | +6% | -3% | +8% | +5% | +2% | -5% | -0% | -8% | +6% |
| RHHBY | -5% | +5% | +3% | -3% | +18% | +8% | +10% | +5% | -14% | +2% | +3% | -2% | +30% |
| VTRS | -2% | +22% | -6% | +5% | +4% | +16% | +5% | +14% | -9% | +11% | +10% | -2% | +85% |
| SDZNY | +4% | +10% | -5% | +12% | +7% | +3% | +9% | +11% | -11% | +4% | +5% | +8% | +68% |
Source: Yahoo Finance monthly adjusted close.
Executive Summary
Rating: HOLD | TEVA
Measured from adjusted close on 2026-07-23 to 2026-10-22. Sell ratings are correct when the stock falls; Hold is tracked as a +/-10% range. Daily-close data, not intraday. Calls are tracked for 182 days from publication, then frozen as a final record.
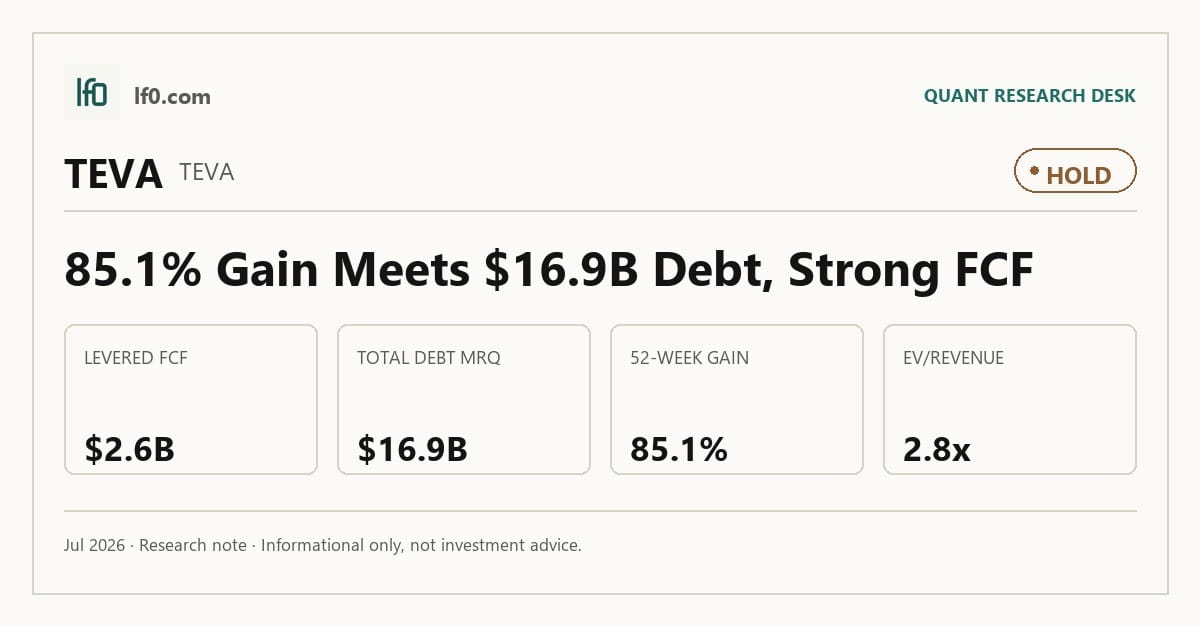
I would put my rating as a Hold because Teva has already rerated on a real earnings recovery, but the first quarter of 2026 still showed revenue slipping to $4B from $4.7B in Q4 2025, so the market is paying ahead of the next leg of execution. The company is not a broken story: TTM EBITDA margin is 28.8% and TTM free cash flow margin is 15.1%, which tells me the core cash engine is intact even as generic pricing pressure and the 2027 AUSTEDO pricing reset keep the bar high. I would raise my rating more towards a Buy if Teva can hold quarterly revenue above $4.5B, roughly the Q3 2025 run rate, while operating margin moves into the low 20s and branded growth keeps offsetting generic erosion.
Company Profile
Teva Pharmaceutical Industries Ltd. is a biopharmaceutical company with a large generics franchise and a growing portfolio of innovative medicines, biosimilars, OTC products, active pharmaceutical ingredient sales, and contract manufacturing. Founded in Israel in 1944, it operates in 57 markets with about 34,000 employees and reports through three segments: United States, Europe, and International Markets. In the U.S., it markets more than 350 generic products in over 1,100 dosage forms and sells branded medicines such as AUSTEDO, AJOVY, UZEDY, and COPAXONE. Across Europe and International Markets, the mix combines generics, biosimilars, and innovative drugs across more than 35 countries.
Economic Moat
Business Model
Teva’s broadest structural advantage is its integrated global operating system, which links 33 finished dosage and packaging plants in 21 countries, 13 API production facilities, and distribution across 57 markets. In my view, that footprint is harder to replicate quickly than any single product because it sits inside approvals, quality systems, and supply relationships, not just capital spending. The company also has a secondary edge in complex generics and biosimilars, where it has more than 900 generic products in its pre-approved global pipeline and 14 Orange Book patents for AUSTEDO plus 11 for AUSTEDO XR. That gives Teva more room to keep launching differentiated products than a plain commodity generic shop, and the patient-support programs around innovative medicines add another layer that is difficult to copy at global scale.
Business & Operating Risks
Sales of generic medicines still dominate the risk profile because they were 55% of 2025 revenue, or $9.4B, and Teva remains exposed to the price erosion that comes with a concentrated buyer base. According to the risk factors in their SEC 10-K, relatively few U.S. retail drug chains, wholesalers, managed care purchasing organizations, mail order distributors, and hospitals have meaningful bargaining power, which keeps pricing under strain. The filing also flags delays in launching new generic products, including delays tied to regulatory approvals, operational readiness, and patent litigation, and that matters because Teva needs timely launches to offset erosion on existing products. Regulatory and litigation risk is concrete as well: the company received two untitled FDA letters on AUSTEDO ads on September 9, 2025, and AUSTEDO plus AUSTEDO XR enter Medicare price setting on January 1, 2027. The disclosed risks do not threaten the global manufacturing moat itself, but they do pressure the mix and the monetization of that moat.
Management Discussion & Analysis
Management is clearly trying to respond to those pressures by leaning harder into innovative medicines and capital discipline. Teva entered its Accelerate Growth phase in 2025, and management says it will focus on the innovative portfolio, align capital allocation to higher-value activities, and modernize operations for efficiency and cost savings. The numbers show that the strategy is working at the product level: AUSTEDO revenue rose to $2.2B in 2025, AJOVY to $295M, and UZEDY to $191M, while U.S. segment profit increased to $3.4B. At the same time, Europe revenue fell to $5B and International Markets revenue fell to $2.2B, so management is still shrinking lower-return assets rather than expanding them. Debt fell to $16.8B at December 31, 2025 from $17.8B a year earlier, and the company repurchased $2.3B of notes in 2025, which tells me the balance-sheet repair is real even if it is still incomplete.
Recent Events
The most significant development I see here is Teva’s definitive agreement on 2026-04-29 to acquire Emalex Biosciences, which adds a pipeline asset and signals management is still willing to use M&A to supplement internal growth. For me, that strengthens the growth case if the deal is disciplined, because it suggests Teva is trying to widen its innovation base rather than rely only on mature products.
The other material item is the 2026-05-28 annual meeting, where shareholders elected Dr. Sol J. Barer to the board and approved named executive compensation and Kesselman & Kesselman as auditor. I read that as governance continuity rather than a strategic reset, so it does not change the thesis on its own. The 2026-01-11 and 2026-01-28 8-Ks were earnings-related and the 2026-04-29 filing also included first-quarter results, so those updates mainly confirm execution cadence rather than a new corporate event.
In my view, the recent 8-Ks modestly strengthen the investment case because the Emalex acquisition points to pipeline expansion, while the shareholder vote and audit approval leave the capital structure and oversight framework unchanged.
Financial Analysis
Growth
TEVA — Financial Growth (Quarterly, USD Mil)
| Metric | 2025-03-31 | 2025-06-30 | 2025-09-30 | 2025-12-31 | 2026-03-31 |
|---|---|---|---|---|---|
| REVENUE (USD Mil) | 3,891 | 4,176 | 4,480 | 4,711 | 3,981 |
| EBIT (USD Mil) | 506 | 406 | 855 | 372 | 638 |
| EBITDA (USD Mil) | 750 | 657 | 1,104 | 632 | 877 |
| NET INCOME (USD Mil) | 214 | 282 | 433 | 480 | 369 |
| DILUTED EPS | 0.2 | 0.2 | 0.4 | 0.4 | 0.3 |
Source: Yahoo Finance — Quarterly Financial Statements
| Metric | 2025-03-31 | 2025-06-30 | 2025-09-30 | 2025-12-31 | 2026-03-31 |
|---|---|---|---|---|---|
| Revenue USD Mil | 3,891 | 4,176 | 4,480 | 4,711 | 3,981 |
| EBIT USD Mil | 506 | 406 | 855 | 372 | 638 |
| EBITDA USD Mil | 750 | 657 | 1,104 | 632 | 877 |
| Net Income USD Mil | 214 | 282 | 433 | 480 | 369 |
| Diluted EPS | 0.2 | 0.2 | 0.4 | 0.4 | 0.3 |
Revenue built steadily through 2025, then reset to $4B in Q1 2026, which is still above the $3.9B base in Q1 2025 but below the late-2025 run rate. EBITDA moved faster than revenue in Q1 2026, rising to $877M from $750M a year earlier, and that is the more important read-through: the mix is still improving even when the top line softens. I view that as consistent with the moat described above, because the branded and complex-generic portfolio is doing more of the earnings work than the legacy generic base.
Profitability
TEVA — Profitability (TTM)
| Metric | TTM |
|---|---|
| Operating Margin (TTM) | 19.2% |
| Net Margin (TTM) | 9.0% |
| Return on Assets (TTM) | 6.4% |
| Return on Equity (TTM) | 21.6% |
| Gross Margin (TTM) | 52.1% |
| EBITDA Margin (TTM) | 28.8% |
Source: Yahoo Finance — Trailing Twelve Months (TTM)
| Metric | TTM |
|---|---|
| Operating Margin (TTM) | 19.2% |
| Net Margin (TTM) | 9.0% |
| Return on Assets (TTM) | 6.4% |
| Return on Equity (TTM) | 21.6% |
| Gross Margin (TTM) | 52.1% |
| EBITDA Margin (TTM) | 28.8% |
TTM gross margin of 52.1% and EBITDA margin of 28.8% show that Teva has a solid product-level margin base, but the 19.2% operating margin still leaves a meaningful gap for overhead, R&D, and other operating costs. Net margin of 9.0% means the company is converting only part of that operating profit into bottom-line earnings, while ROE of 21.6% versus ROA of 6.4% shows leverage is amplifying returns. The key question for me is whether operating margin can move into the low 20s; if it does, the earnings quality would look much cleaner and the current growth mix would be easier to trust.
Valuation
TEVA — Valuation Multiples
| Metric | Value |
|---|---|
| Market Cap (USD Mil) | 35,259 |
| Enterprise Value (USD Mil) | 48,295 |
| Trailing P/E | 22.6 |
| Forward P/E | 9.8 |
| Price/Sales (TTM) | 2 |
| Price/Book (mrq) | 4.3 |
| EV/Revenue | 2.8 |
| EV/EBITDA | 9.7 |
| Beta (5Y Monthly) | 0.86 |
| FCF Yield % (TTM) | 7.4% |
| Forward EPS (USD) | 3.1 |
| Analyst Target Price – Low (USD) | 33 |
| Analyst Target Price – Mean (USD) | 40.9 |
| Analyst Target Price – High (USD) | 50 |
| # Analyst Opinions | 10 |
Source: Yahoo Finance
| Metric | Value |
|---|---|
| Market Cap USD Mil | 35,259 |
| Enterprise Value USD Mil | 48,295 |
| Trailing P/E | 22.60 |
| Forward P/E | 9.79 |
| Price/Sales (TTM) | 2.03 |
| Price/Book (mrq) | 4.29 |
| EV/Revenue | 2.78 |
| EV/EBITDA | 9.65 |
| Beta (5Y Monthly) | 0.86 |
| FCF Yield % (TTM) | 7.4% |
| Forward EPS USD | 3.09 |
| Analyst Target Price – Low USD | 33.00 |
| Analyst Target Price – Mean USD | 40.90 |
| Analyst Target Price – High USD | 50.00 |
| # Analyst Opinions | 10 |
Teva trades at 2.8x EV/Revenue and 9.7x EV/EBITDA, which is not cheap for a company whose revenue growth is only 2.3% TTM, but it is also not priced like a premium growth compounder. The 9.8x forward P/E on 3.09 of forward EPS and the 7.4% FCF yield tell me the market is paying for a recovery in earnings quality, not just for a low multiple. On my read, fair value sits around $33–$41 per share, which is broadly in line with the analyst target range of $33–$50 across 10 opinions; that gives me some comfort that the market is not wildly off, but it also means upside depends on execution rather than multiple expansion alone. I would frame the implied EPS path at roughly 3.1–3.5, with the higher end requiring margin improvement rather than just revenue stability. Against peers, that looks reasonable but not obviously cheap, especially because the balance sheet still carries $16.9B of debt and the growth rate is modest.
Leverage
TEVA — Leverage & Coverage (Quarterly)
| Metric | Value |
|---|---|
| Total Debt/Equity % (mrq) | 205.6 |
| Current Ratio (mrq) | 1 |
| Total Debt (mrq, USD Mil) | 16,925 |
| Operating Cash Flow (TTM, USD Mil) | 1,714 |
| Levered Free Cash Flow (TTM, USD Mil) | 2,611.4 |
| Net Debt/EBITDA (TTM) | 2.6 |
| FCF Margin % (TTM) | 15.0% |
Source: Yahoo Finance — Quarterly Financial Statements
| Metric | Value |
|---|---|
| Total Debt/Equity % (mrq) | 205.6% |
| Current Ratio (mrq) | 1 |
| Total Debt (mrq, USD Mil) | 16,925 |
| Operating Cash Flow (TTM, USD Mil) | 1,714 |
| Levered Free Cash Flow (TTM, USD Mil) | 2,611.4 |
| Net Debt/EBITDA (TTM) | 2.6 |
| FCF Margin % (TTM) | 15.0% |
Leverage is elevated, but the cash flow profile keeps it serviceable. Total debt of $16.9B and a 205.6% debt-to-equity ratio leave little room for error, while the current ratio of 1 means liquidity is only just adequate. What matters more is that operating cash flow reached $1.7B and levered free cash flow was $2.6B TTM, with net debt/EBITDA at 2.6x and FCF margin at 15.0%. That combination tells me the balance sheet is a constraint, not a thesis breaker: Teva can service debt, but it cannot afford a prolonged earnings setback.
Insider Activity
| Date | Insider | Role | Type | Shares | Price |
|---|---|---|---|---|---|
| 2026-06-05 | Francis Richard D | President and CEO | S | 6,153 | $34.35 |
| 2026-06-03 | Shields Matthew | EVP, Global Operations | S | 16,195 | $32.87 |
| 2026-05-14 | Kalif Eliyahu Sharon | EVP, Chief Financial O | S | 153,251 | $35.61 |
| 2026-05-14 | Lippman Evan | EVP, Business Developm | S | 5,746 | $35.58 |
| 2026-05-14 | Lippman Evan | EVP, Business Developm | S | 35,912 | $35.58 |
| 2026-05-06 | Weiss Amir | Chief Accounting Offic | S | 10,679 | $36.00 |
| 2026-05-05 | Daniell Richard | EVP, Europe Commercial | S | 30,000 | $35.40 |
| 2026-05-01 | Sabag Mark | See "Remarks" | S | 144,180 | $34.99 |
The insider record shown here is one-sided, with sales across finance, operations, and commercial roles and no open-market purchases in the period displayed. I read that as a mild negative because it does not show management leaning in at current prices, even though it is not enough on its own to change the thesis.
Comparable Analysis
Growth
| Company | Revenue TTM (USD Mil) | Revenue Growth YoY % | EBITDA TTM (USD Mil) | Diluted EPS TTM |
|---|---|---|---|---|
| TEVA | 17,349 | 2.3% | 5,003 | 1.3 |
| TAK | 4,505,720.1 | 3.9% | 1,236,274 | -0.3 |
| PFE | 63,315 | 5.4% | 25,460 | 1.3 |
| RHHBY | 63,356 | -0.4% | 24,044 | 2.5 |
| VTRS | 14,562.6 | 8.1% | 4,125.2 | -0.3 |
| SDZNY | 11,157 | 10.7% | 1,892 | 2.1 |
Source: Yahoo Finance
| Company | Revenue TTM (USD Mil) | Revenue Growth YoY % | EBITDA TTM (USD Mil) | Diluted EPS TTM |
|---|---|---|---|---|
| TEVA | 17,349 | 2.3% | 5,003 | 1.3 |
| TAK | 4,505,720.1 | 3.9% | 1,236,274 | -0.3 |
| PFE | 63,315 | 5.4% | 25,460 | 1.3 |
| RHHBY | 63,356 | -0.4% | 24,044 | 2.5 |
| VTRS | 14,562.6 | 8.1% | 4,125.2 | -0.3 |
| SDZNY | 11,157 | 10.7% | 1,892 | 2.1 |
Teva is not the fastest grower in the group, but it is one of the few peers pairing positive EPS with positive growth. PFE and SDZNY grow faster on revenue, while RHHBY has the strongest EPS base, so Teva sits in the middle rather than at the top. That middle position matters because the market is not paying a growth premium for Teva the way it is for the highest-quality branded names.
Valuation
| Company | Trailing P/E | Forward P/E | EV/Revenue | EV/EBITDA | Price/Sales (TTM) | Price/Book (mrq) | Market Cap (USD Mil) | Enterprise Value (USD Mil) | Beta (5Y Monthly) | FCF Yield % (TTM) | Forward EPS | Analyst Target Price – Low | Analyst Target Price – Mean | Analyst Target Price – High | # Analyst Opinions |
|---|---|---|---|---|---|---|---|---|---|---|---|---|---|---|---|
| TEVA | 22.6 | 9.8 | 2.8 | 9.7 | 2 | 4.3 | 35,259 | 48,295 | 0.86 | 7.4% | 3.1 | 33 | 40.9 | 50 | 10 |
| TAK | — | 31.5 | 1.1 | 4 | 0 | 1.2 | 53,379 | 4,935,816 | 0.09 | 1,260.4% | 0.5 | 19 | 20.8 | 22.8 | 3 |
| PFE | 19 | 8.8 | 3.1 | 7.6 | 2.2 | 1.6 | 142,030 | 193,413 | 0.31 | 8.7% | 2.8 | 24 | 28.7 | 35.5 | 26 |
| RHHBY | 21.3 | 16.5 | 5.5 | 14.6 | 5.4 | 8.1 | 340,916 | 350,856 | 0.34 | 3.2% | 3.2 | 46 | 56.7 | 67 | 7 |
| VTRS | — | 6.4 | 2.2 | 7.8 | 1.3 | 1.3 | 19,617 | 32,019 | 0.90 | 11.4% | 2.6 | 12 | 17.9 | 23 | 8 |
| SDZNY | 37.6 | 16.9 | 3.4 | 20 | 3.1 | 3.6 | 34,067 | 37,932 | 0.50 | 2.7% | 4.7 | 85 | 90.9 | 96.8 | 2 |
Source: Yahoo Finance
| Company | Trailing P/E | Forward P/E | EV/Revenue | EV/EBITDA | Price/Sales (TTM) | Price/Book (mrq) | Market Cap (USD Mil) | Enterprise Value (USD Mil) | Beta (5Y Monthly) | FCF Yield % (TTM) | Forward EPS | Analyst Target Price – Low | Analyst Target Price – Mean | Analyst Target Price – High | # Analyst Opinions |
|---|---|---|---|---|---|---|---|---|---|---|---|---|---|---|---|
| TEVA | 22.6 | 9.8 | 2.8 | 9.7 | 2 | 4.3 | 35,259 | 48,295 | 0.86 | 7.4% | 3.1 | 33 | 40.9 | 50 | 10 |
| TAK | — | 31.5 | 1.1 | 4 | 0 | 1.2 | 53,379 | 4,935,816 | 0.09 | 1,260.4% | 0.5 | 19 | 20.8 | 22.8 | 3 |
| PFE | 19 | 8.8 | 3.1 | 7.6 | 2.2 | 1.6 | 142,030 | 193,413 | 0.31 | 8.7% | 2.8 | 24 | 28.7 | 35.5 | 26 |
| RHHBY | 21.3 | 16.5 | 5.5 | 14.6 | 5.4 | 8.1 | 340,916 | 350,856 | 0.34 | 3.2% | 3.2 | 46 | 56.7 | 67 | 7 |
| VTRS | — | 6.4 | 2.2 | 7.8 | 1.3 | 1.3 | 19,617 | 32,019 | 0.90 | 11.4% | 2.6 | 12 | 17.9 | 23 | 8 |
| SDZNY | 37.6 | 16.9 | 3.4 | 20 | 3.1 | 3.6 | 34,067 | 37,932 | 0.50 | 2.7% | 4.7 | 85 | 90.9 | 96.8 | 2 |
Teva’s 2.8x EV/Revenue sits below PFE, RHHBY, and SDZNY, while its 9.7x EV/EBITDA is above PFE and VTRS but below RHHBY and SDZNY. That combination says the market is not assigning Teva a premium for growth, but it is also not pricing it like a distressed generic name. On a peer-multiple basis, I would put fair value in a $29–$69 range, and the current price sits inside that band, which is why I do not see a clear valuation gap. The analyst target range of $33–$50 across 10 opinions is tighter than the peer-implied band, and Teva’s current price is already close to the consensus mean of $40.9, so the stock looks fairly valued rather than obviously mispriced. Teva’s 85.1% one-year return also matters here: the market has already rewarded the earnings recovery, so valuation now depends on whether the next leg of margin improvement actually arrives.
Profitability
| Company | Operating Margin (TTM) | Net Margin (TTM) | Return on Assets (TTM) | Return on Equity (TTM) | Gross Margin (TTM) | EBITDA Margin (TTM) |
|---|---|---|---|---|---|---|
| TEVA | 19.2% | 9.0% | 6.4% | 21.6% | 52.1% | 28.8% |
| TAK | 11.1% | -3.4% | 2.6% | -2.1% | 64.1% | 27.4% |
| PFE | 31.6% | 11.8% | 5.7% | 8.3% | 74.8% | 40.2% |
| RHHBY | 30.0% | 20.3% | 12.9% | 37.3% | 74.5% | 38.0% |
| VTRS | 6.8% | -2.0% | 2.3% | -2.0% | 39.8% | 28.3% |
| SDZNY | 14.3% | 8.2% | 4.3% | 10.4% | 47.5% | 17.0% |
Source: Yahoo Finance
| Company | Operating Margin (TTM) | Net Margin (TTM) | Return on Assets (TTM) | Return on Equity (TTM) | Gross Margin (TTM) | EBITDA Margin (TTM) |
|---|---|---|---|---|---|---|
| TEVA | 19.2% | 9.0% | 6.4% | 21.6% | 52.1% | 28.8% |
| TAK | 11.1% | -3.4% | 2.6% | -2.1% | 64.1% | 27.4% |
| PFE | 31.6% | 11.8% | 5.7% | 8.3% | 74.8% | 40.2% |
| RHHBY | 30.0% | 20.3% | 12.9% | 37.3% | 74.5% | 38.0% |
| VTRS | 6.8% | -2.0% | 2.3% | -2.0% | 39.8% | 28.3% |
| SDZNY | 14.3% | 8.2% | 4.3% | 10.4% | 47.5% | 17.0% |
Teva’s profitability profile is better than the lower-quality generics peers, especially on operating margin and net margin. It still trails PFE and RHHBY on gross margin and operating margin, which tells me the company has improved but does not yet have the pricing power of the best branded franchises. The 21.6% ROE versus 6.4% ROA spread also shows leverage is helping returns, so the next step for the thesis is cleaner operating leverage rather than more financial leverage.
Leverage
| Company | Total Debt/Equity % (mrq) | Current Ratio (mrq) | Total Debt (mrq, USD Mil) | Operating Cash Flow TTM (USD Mil) | Free Cash Flow TTM (USD Mil) | Net Debt/EBITDA (TTM) | FCF Margin % (TTM) |
|---|---|---|---|---|---|---|---|
| TEVA | 205.6 | 1 | 16,925 | 1,714 | 2,611.4 | 2.6 | 15.0% |
| TAK | 73.7 | 1.1 | 5,476,358 | 1,041,431 | 672,782.8 | 3.9 | 14.9% |
| PFE | 71.6 | 1.2 | 64,731 | 11,984 | 12,376.6 | 2 | 19.6% |
| RHHBY | 87.6 | 1.4 | 33,197 | 18,852 | 11,027.9 | 0.7 | 17.4% |
| VTRS | 99.7 | 1.6 | 14,610 | 2,168.7 | 2,238.3 | 3 | 15.4% |
| SDZNY | 60.7 | 1.2 | 5,699 | 1,594 | 924.6 | 2.1 | 8.3% |
Source: Yahoo Finance
| Company | Total Debt/Equity % (mrq) | Current Ratio (mrq) | Total Debt (mrq, USD Mil) | Operating Cash Flow TTM (USD Mil) | Free Cash Flow TTM (USD Mil) | Net Debt/EBITDA (TTM) | FCF Margin % (TTM) |
|---|---|---|---|---|---|---|---|
| TEVA | 205.6 | 1 | 16,925 | 1,714 | 2,611.4 | 2.6 | 15.0% |
| TAK | 73.7 | 1.1 | 5,476,358 | 1,041,431 | 672,782.8 | 3.9 | 14.9% |
| PFE | 71.6 | 1.2 | 64,731 | 11,984 | 12,376.6 | 2 | 19.6% |
| RHHBY | 87.6 | 1.4 | 33,197 | 18,852 | 11,027.9 | 0.7 | 17.4% |
| VTRS | 99.7 | 1.6 | 14,610 | 2,168.7 | 2,238.3 | 3 | 15.4% |
| SDZNY | 60.7 | 1.2 | 5,699 | 1,594 | 924.6 | 2.1 | 8.3% |
Teva’s debt-to-equity ratio is much higher than most peers, but net debt/EBITDA at 2.6x is closer to VTRS and PFE, which is the more useful measure for repayment capacity. That is why I do not read the balance sheet as a crisis, even though it is clearly a constraint. The company’s 15.0% FCF margin is solid, but not so strong that leverage can be ignored if earnings weaken.
Conclusion
I would put my rating as a Hold because TEVA has already rerated on the back of a real earnings improvement, but the latest quarter still showed a 15.5% year over year revenue decline in Q1 2026 and the stock now trades at 2.8x EV/Revenue with a 7.4% FCF yield, which leaves less room for disappointment. The business is still producing 28.8% EBITDA margin in TTM and 15.1% FCF margin in TTM, so this is not a broken company, but the market is already paying for a cleaner earnings path than the one the first quarter of 2026 actually delivered.
I would raise my rating more towards a Buy if TEVA can keep revenue above $4.5B in a quarter, roughly the Q3 2025 run rate, while operating margin moves into the low 20s and AUSTEDO, AJOVY, and UZEDY continue to offset generic price pressure. If that happens, the current $3.09 forward EPS would likely prove conservative, and even a modest step up to about $3.50 of forward EPS would make the current 9.8x forward P/E look more like a cash flow recovery multiple than a full valuation. That would also support a higher free cash flow base, which matters because every extra point of FCF margin on roughly $17B of annual revenue is about $170M of additional cash generation.
The bear case is that Q1 2026 turns out to be the start of a slower 2026, not a one off, with revenue staying near $4.0B and generic pricing pressure continuing to offset branded growth while the 2027 Medicare pricing reset on AUSTEDO and AUSTEDO XR starts to weigh on the mix. If operating margin slips back toward the high teens and net debt stays around 2.6x EBITDA without faster deleveraging, the market will stop paying for the rerating and the shares could drift back toward a lower multiple even if earnings stay positive. The insider record, with 62 sales and 0 purchases over 2025-02-12 to 2026-06-05, also leaves me cautious because it does not show management leaning in at current prices.
Weighing both sides, I think the bull case is real but not yet dominant enough to justify a Buy. The stock has already captured a good part of the improvement in AUSTEDO, AJOVY, and UZEDY, so I would rather wait for another quarter or two of revenue stability before paying for a cleaner earnings bridge that is still only partly visible.
What’s your take? I rated Teva Pharmaceutical (TEVA) HOLD above — but the goal here is to get this right, not just to publish an opinion. What would you add to this analysis, or which risk or catalyst do you think I’m under- or over-weighting? Tell me in the comments.
Sources
- SEC 10-K Annual Report — filed 2026-02-03
- SEC 8-K Filing (2026-05-28)
- SEC 8-K Filing (2026-04-29)
- SEC 8-K Filing (2026-01-28)
- SEC 8-K Filing (2026-01-12)
- SEC Form 4 Insider Transaction (2026-06-08)
- SEC Form 4 Insider Transaction (2026-06-08)
- SEC Form 4 Insider Transaction (2026-06-08)
- SEC 10-K Annual Report — FY2026
- SEC 10-K Annual Report — FY2025
- SEC 10-K Annual Report — FY2024
- SEC 10-K Annual Report — FY2023
- SEC 10-K Annual Report — FY2022
Data sourced from Yahoo Finance and SEC EDGAR. Not investment advice.
Leave a Comment