Expected price range
Each range is set from the stock’s recent price history and our Hold rating, using its own 1-year realised volatility (18% annualised) as the width of a ~68% statistical band, and checked against that rating so the range leans the same way as our view. Starting price $94.19 (close 2026-10-27). The stock traded between $94.19 and $112 over the last 6 months and between $94.19 and $120 over the last year. This is an illustration of where our view and normal volatility point, not a forecast, price target or investment advice; the stock can move outside it.
| Company | Oct 25 | Nov 25 | Dec 25 | Jan 26 | Feb 26 | Mar 26 | Apr 26 | May 26 | Jun 26 | Jul 26 | Aug 26 | Sep 26 | 12-Mo |
|---|---|---|---|---|---|---|---|---|---|---|---|---|---|
| INGR | -5% | -7% | +3% | +8% | -1% | -4% | -0% | -9% | -7% | +6% | +4% | -7% | -19% |
| ADM | +1% | +1% | -5% | +17% | +3% | +5% | +3% | +8% | -4% | +4% | +3% | -2% | +37% |
| BG | +16% | +2% | -7% | +28% | +7% | +5% | -0% | -2% | -13% | -0% | +10% | -8% | +35% |
| TSN | -5% | +13% | +2% | +11% | +0% | -1% | +0% | -5% | -5% | +1% | -5% | -8% | -4% |
| GIS | -6% | +2% | -2% | +1% | -2% | -18% | -4% | -4% | +3% | +5% | +15% | -22% | -32% |
| ANDE | +17% | +11% | +3% | +17% | +5% | +10% | +10% | -10% | -3% | +4% | -8% | +1% | +67% |
Source: Yahoo Finance monthly adjusted close.
Quick Thesis
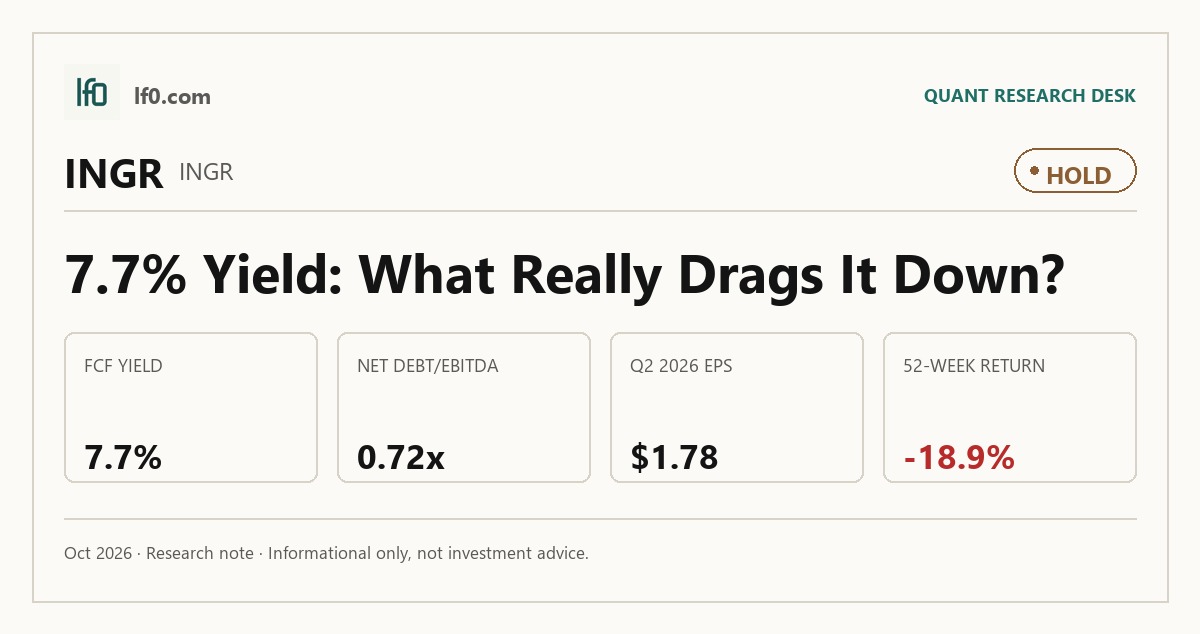
- Rated hold — solid cash generation, but growth is too modest to justify a rerating.
- Strongest support: 0.72x net debt/EBITDA and $457M of levered free cash flow TTM.
- Main risk: earnings are slipping, with Q2 2026 diluted EPS at 1.78.
- Valuation is fair to slightly rich versus peers at 5.9x EV/EBITDA and 0.8x sales.
- I would move more constructive if operating margin stays above 12.6% and EPS stops falling.
Executive Summary
Rating: HOLD | INGR
Measured from adjusted close on 2026-10-27 to 2026-10-28. Sell ratings are correct when the stock falls; Hold is tracked as a +/-10% range. Daily-close data, not intraday. Calls are tracked for 182 days from publication, then frozen as a final record.
I would put my rating as a Hold because Ingredion’s balance sheet and cash conversion are solid, but the stock already reflects that stability while revenue growth remains only 0.9% TTM. In my view, the key question is not whether the business is profitable — it is — but whether management can turn portfolio simplification and innovation spending into faster earnings growth.
The most important strength is leverage: net debt/EBITDA is 0.72x, current ratio is 2.8x, and levered free cash flow is $457.2M TTM, so the company has room to fund capex, dividends, and restructuring without financial strain. The main weakness is that earnings are not compounding cleanly; Q2 2026 diluted EPS was 1.78, down from 2.22 in Q1 2026, even as revenue only edged up to $1.9B.
I would become more constructive if operating margin can hold above 12.6% while EPS stabilizes, because that would show the company is converting its restructuring and innovation spend into cleaner earnings rather than just defending the current base.
Company Profile
Ingredion Incorporated makes starches, sweeteners, animal feed products, edible corn oil, and protein ingredients for food, beverage, brewing, animal nutrition, and industrial customers. In 2025, starches were 50% of net sales and sweeteners were 34%, so the business still depends on large-volume corn processing even as it pushes further into specialty ingredients.
The company operates 41 active manufacturing facilities and joint ventures across the U.S., Canada, Latin America, Asia-Pacific, and Europe. It also has more than 11,200 employees worldwide and is building a Global Innovation headquarters in Bridgewater, New Jersey, expected to open in the first half of 2028, which underscores how central product development is to the model.
Economic Moat
Business Model
The moat case rests on Ingredion’s ability to turn corn and other plant-based inputs into application-specific ingredients that customers buy for function, not just bulk or sweetness. I feel that this is hard to replicate quickly because the company has more than 1,800 patents and patent applications, over 500 scientists and engineers, and 30 Ingredion Idea Labs® that support customer co-development across food and non-food uses.
Scale matters too. Ingredion’s 41 active manufacturing facilities and joint ventures give it the local reach to serve customers in more than 60 industries, while many multi-year contracts are fee-based and shift raw-material risk toward customers. That combination supports pricing discipline, but it is not a protected franchise; ADM, Cargill, Tate & Lyle, Roquette, and Primient all compete in the same broad space, so the edge comes from formulation depth and customer integration rather than from a structural monopoly.
Business & Operating Risks
The most material disclosed risk is execution on plant closures and asset recoverability. Ingredion booked $21M of restructuring and impairment charges in 2025, plus another $3M of incremental fixed-asset impairment charges tied to the Goole, Vanscoy, and Alcantara closures, so the risk is already showing up in reported results.
Commodity and energy volatility is the second pressure point. The company sells a significant portion of finished products at firm prices that typically last up to one year, while hedging only part of the input base; at December 31, 2025, it had hedges on about 84 million bushels of corn and 26 million mmbtus of natural gas. That means margins can still move when input costs shift faster than contract resets.
Foreign exposure is also meaningful. Ingredion had $1.7 billion of net assets in foreign subsidiaries and $899M of cumulative translation loss in accumulated other comprehensive loss, and the Pakistan divestiture still depends on regulatory approvals and repatriation steps. The disclosed risks do not threaten the moat itself, but they do test whether the company can keep its formulation advantage while simplifying the portfolio.
Management Discussion & Analysis
Management is responding to those risks, but not by de-risking the business in a simple way. The company lifted capital expenditures and mechanical stores purchases to $433M in 2025, with 2026 commitments expected at $400M-$440M, which tells me the priority is plant modernization and capacity upkeep rather than balance-sheet repair.
The new $1B unsecured revolving credit facility, signed on August 27, 2025 and maturing on August 27, 2030, improves liquidity flexibility, but it does not change the fact that total debt was $1.8B at year-end 2025. Management is also backing a new Global Innovation headquarters in Bridgewater, New Jersey, estimated at about $145M, which is a long-dated signal that product development remains central to the strategy.
The operating record is mixed. U.S./Canada operating income fell 16% in 2025 because of lower volumes and production challenges at one large manufacturing facility, so the innovation and modernization spend has not yet translated into cleaner near-term earnings. The company still had $3.9B of total available liquidity at December 31, 2025, which gives management room to keep investing, but the cash flow trend shows that working capital and capex are already absorbing some of that flexibility.
Recent Events
The most important recent event is the May 14, 2026 non-binding all-cash offer for Tate & Lyle PLC. If completed, it would expand Ingredion’s specialty ingredients footprint and strengthen the higher-value part of the portfolio, but the non-binding structure means execution risk remains high.
On May 1, 2026, Ingredion committed to cease operations at its Cabo, Brazil manufacturing facility by June 30, 2026. The company expects about $43M of pre-tax charges, including $36M of impairment and inventory write-downs and $7M of cash severance and termination costs, which should improve manufacturing efficiency over time but will pressure near-term earnings.
The March 18, 2026 appointment of Jason Payant as interim chief financial officer, effective April 1, 2026, adds another layer of transition. Taken together, the recent events point to an active portfolio reset rather than a steady operating period, which supports the moat thesis only if management can execute without letting the restructuring burden overwhelm the earnings base.
Financial Analysis
Growth
INGR — Financial Growth (Quarterly, USD Mil)
| Metric | 2025-06-30 | 2025-09-30 | 2025-12-31 | 2026-03-31 | 2026-06-30 |
|---|---|---|---|---|---|
| REVENUE (USD Mil) | 1,833 | 1,816 | 1,757 | 1,792 | 1,850 |
| EBIT (USD Mil) | 271 | 248 | 216 | 203 | 230 |
| EBITDA (USD Mil) | 324 | 305 | 273 | 258 | 285 |
| NET INCOME (USD Mil) | 196 | 171 | 165 | 142 | 114 |
| DILUTED EPS | 3 | 2.6 | 2.6 | 2.2 | 1.8 |
Source: Yahoo Finance — Quarterly Financial Statements
Revenue has been broadly flat over the last two quarters, moving from $1.8B in Q1 2026 to $1.9B in Q2 2026 after $1.8B in Q4 2025 and $1.8B in Q1 2026. EBITDA improved from $258M to $285M over that same span, but net income fell from $142M to $114M and diluted EPS dropped from 2.22 to 1.78, so the top line is stable while per-share earnings are not.
That split matters because it tells me the business is not in a demand collapse, but it also is not generating enough operating leverage to offset the cost and restructuring load. The growth profile is therefore neutral at best: stable enough to support the thesis, but not strong enough to justify a premium multiple on its own.
Profitability
INGR — Profitability (TTM)
| Metric | TTM |
|---|---|
| Operating Margin (TTM) | 12.6% |
| Net Margin (TTM) | 8.2% |
| Return on Assets (TTM) | 7.3% |
| Return on Equity (TTM) | 13.7% |
| Gross Margin (TTM) | 23.7% |
| EBITDA Margin (TTM) | 16.0% |
Source: Yahoo Finance — Trailing Twelve Months (TTM)
TTM operating margin was 12.6%, net margin was 8.2%, gross margin was 23.7%, EBITDA margin was 16.0%, ROA was 7.3%, and ROE was 13.7%. Those figures are comfortably positive, but they also show a mature processor rather than a high-growth compounder.
The 11.1-point gap between gross margin and operating margin tells me Ingredion still carries a meaningful operating cost base after gross profit is earned. ROE sits 6.4 points above ROA, so leverage helps returns, but the company is not relying on aggressive balance-sheet risk to produce acceptable profitability. The key cross-check is that the moat described above is showing up in margins: Ingredion’s operating margin is strong enough to support the formulation and customer-integration story, even if it is not yet translating into faster revenue growth.
Valuation
INGR — Valuation Multiples
| Metric | Value |
|---|---|
| Current Share Price (USD) | 94.2 |
| Market Cap (USD Mil) | 5,942 |
| Enterprise Value (USD Mil) | 6,849 |
| Trailing P/E | 10.3 |
| Forward P/E | 8.4 |
| Price/Sales (TTM) | 0.8 |
| Price/Book (mrq) | 1.3 |
| EV/Revenue | 0.9 |
| EV/EBITDA | 5.9 |
| Beta (5Y Monthly) | 0.64 |
| FCF Yield % (TTM) | 7.7% |
| Forward EPS (USD) | 11.2 |
| Analyst Target Price – Low (USD) | 104 |
| Analyst Target Price – Mean (USD) | 119.5 |
| Analyst Target Price – High (USD) | 150 |
| # Analyst Opinions | 6 |
Source: Yahoo Finance
Ingredion trades at 5.9x EV/EBITDA, 0.9x EV/revenue, 10.3x trailing P/E, and 8.4x forward P/E, with a current share price of $94.2 and FCF yield of 7.7% TTM. On those numbers, I think the stock is fairly valued rather than cheap: the market is paying for a profitable, cash-generative business, but not for a growth reacceleration that has not yet shown up.
My fair-value range on the analysis here is roughly $90-$120 per share. That sits inside the analyst target range of $104-$150 and close to the $119.5 mean, which tells me the Street is already broadly aligned with the idea that Ingredion deserves a quality premium, even if the upside is not dramatic. I would not push the range higher unless the company proves that the margin gains can persist while revenue growth improves; otherwise, the current multiple already captures most of the balance-sheet and cash-flow strength.
Forward EPS is 11.2, which is close to BG’s $11.2 and well above TSN’s $3.9, so Ingredion is not being priced as a low-earnings business. Relative to peers, that makes the stock look reasonable on earnings power, but not obviously cheap enough to force a stronger call.
Leverage
INGR — Leverage & Coverage (Quarterly)
| Metric | Value |
|---|---|
| Total Debt/Equity % (mrq) | 39.4 |
| Current Ratio (mrq) | 2.8 |
| Total Debt (mrq, USD Mil) | 1,783 |
| Operating Cash Flow (TTM, USD Mil) | 805 |
| Levered Free Cash Flow (TTM, USD Mil) | 457.2 |
| Net Debt/EBITDA (TTM) | 0.7 |
| FCF Margin % (TTM) | 6.3% |
Source: Yahoo Finance — Quarterly Financial Statements
Ingredion’s leverage is moderate, not stretched. Total debt/equity was 39.4%, current ratio was 2.8x, and total debt was $1.8B, while total cash was $952M and net debt/EBITDA was only 0.72x.
Cash generation is solid as well: operating cash flow was $805M TTM and levered free cash flow was $457.2M TTM, with an FCF margin of 6.3%. That means the company is converting earnings into cash well enough to fund capex, dividends, and portfolio moves without leaning on the revolver. The balance sheet is a support, not a constraint, which is why the stock can absorb the current restructuring cycle without immediate financing pressure.
Insider Activity
The insider record is one-sided: 13 open-market sales and 0 open-market purchases from 2025-01-15 to 2026-05-20. The sample in the table is small, but the direction is still worth noting because it shows insiders have been net sellers rather than buyers.
I do not read that as a strong bearish signal on its own. The activity is not broad enough to imply a coordinated negative view, but it also does not give me the kind of insider confidence that would support a more aggressive rating.
Comparable Analysis
LF0 has published standalone analyses of these peers: Archer-Daniels-Midland (ADM) (rated Hold); Bunge Global (BG) (rated Hold); Tyson Foods (TSN) (rated Hold); General Mills (GIS) (rated Hold).
Growth
| Company | Revenue TTM (USD Mil) | Revenue Growth YoY % | EBITDA TTM (USD Mil) | Diluted EPS TTM |
|---|---|---|---|---|
| INGR | 7,215 | 0.9% | 1,154 | 9.2 |
| ADM | 82,099 | 7.2% | 2,995 | 3.6 |
| BG | 91,819 | 88.3% | 3,126 | 5 |
| TSN | 55,694 | -0.1% | 2,772 | 1.6 |
| GIS | 18,296.6 | -2.8% | 3,415 | -1.6 |
| ANDE | 10,938.9 | -1.2% | 302.5 | 5.2 |
Source: Yahoo Finance
INGR’s revenue growth of 0.9% TTM is far below ADM’s 7.2% and BG’s 88.3%, and only slightly ahead of TSN’s -0.1%, GIS’s -2.8%, and ANDE’s -1.2%. That tells me the market is not paying for top-line acceleration here, so any valuation support has to come from earnings quality and cash conversion instead.
Valuation
| Company | Current Share Price (USD) | Trailing P/E | Forward P/E | EV/Revenue | EV/EBITDA | Price/Sales (TTM) | Price/Book (mrq) | Market Cap (USD Mil) | Enterprise Value (USD Mil) | Beta (5Y Monthly) | FCF Yield % (TTM) | Forward EPS | Analyst Target Price – Low | Analyst Target Price – Mean | Analyst Target Price – High | # Analyst Opinions |
|---|---|---|---|---|---|---|---|---|---|---|---|---|---|---|---|---|
| INGR | 94.2 | 10.3 | 8.4 | 0.9 | 5.9 | 0.8 | 1.3 | 5,942 | 6,849 | 0.64 | 7.7% | 11.2 | 104 | 119.5 | 150 | 6 |
| ADM | 78.3 | 21.5 | 13.8 | 0.6 | 15.6 | 0.5 | 1.6 | 37,735 | 46,628 | 0.63 | 3.1% | 5.7 | 60 | 80.3 | 95 | 10 |
| BG | 101.5 | 20.2 | 9.1 | 0.4 | 12 | 0.2 | 1.2 | 19,506 | 37,368 | 0.72 | -33.2% | 11.2 | 116 | 140.6 | 155 | 9 |
| TSN | 55.6 | 34.3 | 14.3 | 0.5 | 9.8 | 0.4 | 1.1 | 19,564 | 27,214 | 0.40 | 6.1% | 3.9 | 56 | 63 | 75 | 12 |
| GIS | 33.2 | — | 10.5 | 1.7 | 9.1 | 1 | 2.4 | 17,770 | 31,215 | 0.02 | 7.3% | 3.2 | 30 | 37 | 45 | 18 |
| ANDE | 64.1 | 12.4 | 10 | 0.3 | 10.1 | 0.2 | 1.6 | 2,181 | 3,047 | 0.66 | -5.0% | 6.4 | 80 | 86.7 | 90 | 3 |
Source: Yahoo Finance
INGR trades at 5.9x EV/EBITDA and 0.9x EV/revenue, versus ADM at 15.6x and 0.6x, BG at 12.0x and 0.4x, TSN at 9.8x and 0.5x, GIS at 9.1x and 1.7x, and ANDE at 10.1x and 0.3x. On a cash basis, INGR’s 7.7% FCF yield is stronger than ADM’s 3.1% and TSN’s 6.1%, while its lower leverage helps explain why I think the market can justify a moderate premium to the weaker growers without paying for a full rerating.
Profitability
| Company | Operating Margin (TTM) | Net Margin (TTM) | Return on Assets (TTM) | Return on Equity (TTM) | Gross Margin (TTM) | EBITDA Margin (TTM) |
|---|---|---|---|---|---|---|
| INGR | 12.6% | 8.2% | 7.3% | 13.7% | 23.7% | 16.0% |
| ADM | 4.0% | 2.2% | 2.3% | 7.6% | 6.9% | 3.6% |
| BG | 4.6% | 1.1% | 3.5% | 7.2% | 4.9% | 3.4% |
| TSN | 2.7% | 1.0% | 2.6% | 3.3% | 6.6% | 5.0% |
| GIS | 15.2% | -4.9% | 5.6% | -10.5% | 33.7% | 18.7% |
| ANDE | 1.6% | 1.6% | 3.0% | 12.2% | 7.2% | 2.8% |
Source: Yahoo Finance
INGR’s 12.6% operating margin, 8.2% net margin, 16.0% EBITDA margin, and 23.7% gross margin all sit well above ADM’s 4.0%, 2.2%, 3.6%, and 6.9%, and above TSN’s 2.7%, 1.0%, 5.0%, and 6.6%. GIS has a higher 33.7% gross margin, but its 15.2% operating margin is only slightly above INGR’s, which tells me Ingredion’s edge is more about disciplined operating expense control than raw input economics.
Leverage
| Company | Total Debt/Equity % (mrq) | Current Ratio (mrq) | Total Debt (mrq, USD Mil) | Operating Cash Flow TTM (USD Mil) | Free Cash Flow TTM (USD Mil) | Net Debt/EBITDA (TTM) | FCF Margin % (TTM) |
|---|---|---|---|---|---|---|---|
| INGR | 39.4 | 2.8 | 1,783 | 805 | 457.2 | 0.7 | 6.3% |
| ADM | 39.1 | 1.4 | 9,342 | 2,795 | 1,164.6 | 2.8 | 1.4% |
| BG | 98 | 1.6 | 17,061 | 1,075 | -6,475.4 | 5.2 | -7.0% |
| TSN | 44 | 1.4 | 8,006 | 2,004 | 1,191.2 | 2.6 | 2.1% |
| GIS | 182.4 | 0.7 | 13,615.6 | 2,067 | 1,302.6 | 3.9 | 7.1% |
| ANDE | 66.3 | 1.5 | 900.8 | 321.9 | -109.1 | 2.8 | -1.0% |
Source: Yahoo Finance
INGR’s 39.4% debt/equity and 0.72x net debt/EBITDA are far lighter than ADM’s 39.1% and 2.8x, BG’s 98.0% and 5.2x, TSN’s 44.0% and 2.6x, GIS’s 182.4% and 3.9x, and ANDE’s 66.3% and 2.8x. That lower net leverage matters because it gives Ingredion more room to absorb the restructuring cycle, and it helps explain why the stock can trade at a steadier multiple than some peers even without faster growth.
Conclusion
I would put my rating as a Hold because Ingredion’s cash generation and leverage are strong enough to support the current valuation, but the earnings trend is not yet strong enough to justify a more bullish call. The tension I am watching is simple: the company is executing a portfolio reset, yet revenue growth is still only 0.9% TTM and Q2 2026 EPS fell to 1.78, so the market is waiting for proof that the restructuring is improving the earnings base rather than just adding one more layer of cost.
The bull case is that the portfolio changes start to compound. If operating margin stays above 12.6% and free cash flow remains near the current $457.2M TTM level, Ingredion can keep funding capex, dividends, and selective portfolio moves without stretching leverage. A move toward 14.0% operating margin would be meaningful because it would show the company is turning innovation and restructuring spend into cleaner earnings on a $7.2B revenue base, not just preserving the status quo.
The bear case is that restructuring keeps outrunning operating improvement. If the closure program produces another year of impairment and severance charges while revenue stays near $7.2B and operating margin slips toward 11%, the market will start treating the stock as a low-growth processor with recurring execution costs rather than a higher-value ingredients platform. I would also watch operating cash flow; a drop below $805M would weaken the dividend and capex cushion and make the current valuation harder to defend.
My base case is still that the balance sheet gives management enough time to execute, but I do not want to pay for a rerating until the next two quarters show that margin gains are sticking. If that happens, I would move from Hold toward Buy; if it does not, the current multiple will start to look less like fair value and more like a ceiling.
What to Watch Next
- Operating margin above 12.6% — would support a move from Hold toward Buy.
- Levered free cash flow near $457.2M — would confirm the cash cushion is intact.
- Operating cash flow below $805M — would weaken the dividend and capex buffer.
- Q3 and Q4 EPS stabilization — would show the earnings trend is no longer slipping.
- Cabo closure and Tate & Lyle execution — would test whether the portfolio reset is improving mix or adding execution risk.
What’s your take? I rated Ingredion (INGR) HOLD above — but the goal here is to get this right, not just to publish an opinion. What would you add to this analysis, or which risk or catalyst do you think I’m under- or over-weighting? Tell me in the comments.
Our track record: every directional call is tracked publicly on The Scorecard, and Stocks Covered lists every company we have rated and when.
Sources
- SEC 10-K Annual Report — filed 2026-02-17
- SEC 8-K Filing (2026-05-21)
- SEC 8-K Filing (2026-05-14)
- SEC 8-K Filing (2026-05-05)
- SEC 8-K Filing (2026-05-05)
- SEC 8-K Filing (2026-03-25)
- SEC 8-K Filing (2026-03-23)
- SEC Form 4 Insider Transaction (2026-06-02)
- SEC Form 4 Insider Transaction (2026-06-02)
- SEC Form 4 Insider Transaction (2026-05-22)
- SEC 10-K Annual Report — FY2026
- SEC 10-K Annual Report — FY2025
- SEC 10-K Annual Report — FY2024
- SEC 10-K Annual Report — FY2023
- SEC 10-K Annual Report — FY2022
Data sourced from Yahoo Finance and SEC EDGAR. Not investment advice.
Leave a Comment