
Expected price range
Each range is set from the stock’s recent price history and our Hold rating, using its own 1-year realised volatility (29% annualised) as the width of a ~68% statistical band, and checked against that rating so the range leans the same way as our view. Starting price $101 (close 2026-10-27). The stock traded between $101 and $131 over the last 6 months and between $88.55 and $131 over the last year. This is an illustration of where our view and normal volatility point, not a forecast, price target or investment advice; the stock can move outside it.
| Company | Oct 25 | Nov 25 | Dec 25 | Jan 26 | Feb 26 | Mar 26 | Apr 26 | May 26 | Jun 26 | Jul 26 | Aug 26 | Sep 26 | 12-Mo |
|---|---|---|---|---|---|---|---|---|---|---|---|---|---|
| BG | +16% | +2% | -7% | +28% | +7% | +5% | -0% | -2% | -13% | -0% | +10% | -8% | +35% |
| ADM | +1% | +1% | -5% | +17% | +3% | +5% | +3% | +8% | -4% | +4% | +3% | -2% | +37% |
| TSN | -5% | +13% | +2% | +11% | +0% | -1% | +0% | -5% | -5% | +1% | -5% | -8% | -4% |
| GIS | -6% | +2% | -2% | +1% | -2% | -18% | -4% | -4% | +3% | +5% | +15% | -22% | -32% |
| INGR | -5% | -7% | +3% | +8% | -1% | -4% | -0% | -9% | -7% | +6% | +4% | -7% | -19% |
| ANDE | +17% | +11% | +3% | +17% | +5% | +10% | +10% | -10% | -3% | +4% | -8% | +1% | +67% |
Source: Yahoo Finance monthly adjusted close.
Quick Thesis
- Rated hold — growth is real, but cash conversion is still weak.
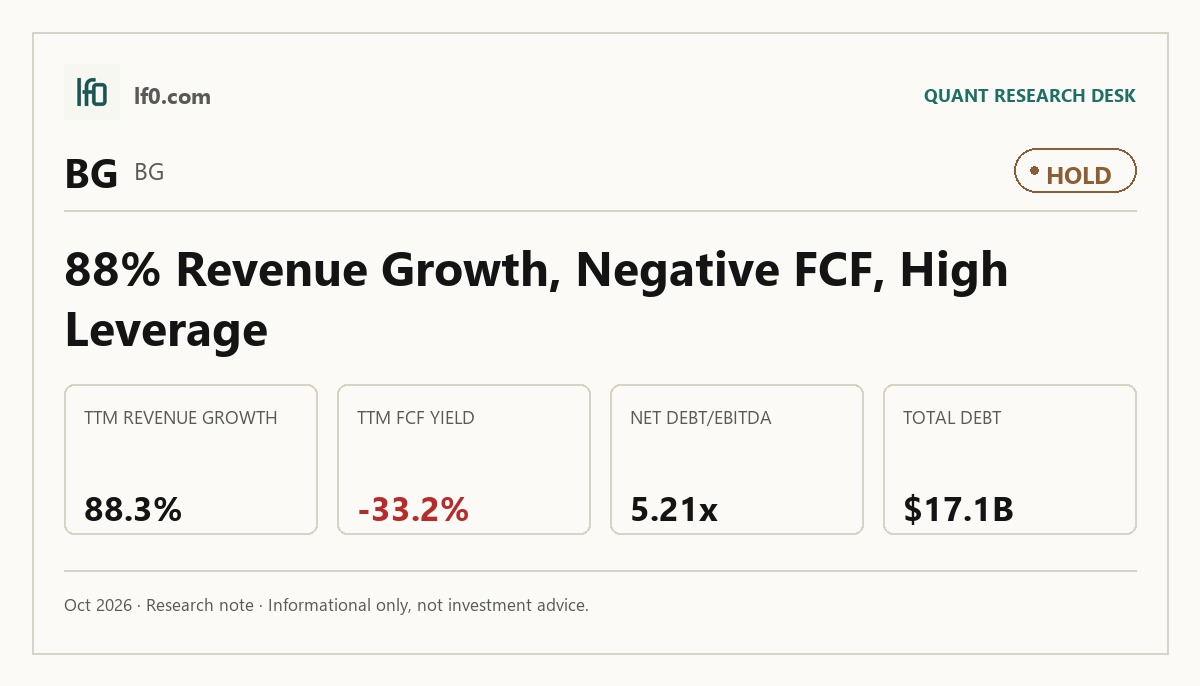
- Strongest point: Q2 2026 revenue reached $24B, up 88.2% year over year.
- Biggest risk: net debt/EBITDA was 5.2x, with levered free cash flow at -$6.5B TTM.
- Valuation is mixed: 12.0x EV/EBITDA and 9.1x forward P/E, but -33.2% FCF yield.
- I would turn more constructive if free cash flow turns positive and leverage falls below 4.5x.
Executive Summary
Rating: HOLD | BG
Measured from adjusted close on 2026-10-27 to 2026-10-28. Sell ratings are correct when the stock falls; Hold is tracked as a +/-10% range. Daily-close data, not intraday. Calls are tracked for 182 days from publication, then frozen as a final record.
I would put my rating as a Hold because Bunge Global’s scale has expanded sharply after Viterra, but the cash conversion gap is still too wide for me to call it a Buy. Revenue reached $24B in Q2 2026, up 88.2% year over year, and that is the clearest sign that the combined network is already producing a much larger operating base. The problem is that net debt/EBITDA was 5.2x and levered free cash flow was -$6.5B TTM, so the earnings lift has not yet translated into balance-sheet repair. I would raise my rating more towards a Buy if free cash flow turns positive and net debt/EBITDA falls below 4.5x, because that would show the Viterra scale-up is funding itself rather than just enlarging the platform.
Company Profile
Bunge Global SA is a global agribusiness company that buys, stores, transports, processes, sells, and distributes agricultural commodities and related products, while also providing financing, risk management, and logistics services. It operates through four segments: soybean processing and refining, softseed processing and refining, other oilseeds processing and refining, and grain merchandising and milling. Founded in 1818 in Amsterdam, the company completed the acquisition of Viterra on July 2, 2025, which materially expanded its oilseeds and grain merchandising footprint. Bunge is incorporated under Swiss law, domiciled in Geneva, and listed on the New York Stock Exchange under BG. It operates in more than 50 countries and employs about 34,000 people.
Economic Moat
Business Model
Bunge’s moat is the integrated origination, processing, logistics, and risk-management network that links farmers, storage, transport, crushing, refining, merchandising, and financing across more than 50 countries. In my view, that system is hard to replicate quickly because it is not a single plant or a single crop bet; it is a connected platform that can shift volume across regions and products as conditions change. I also see a secondary moat in farmer financing, especially in Brazil, because that support helps secure supply and deepens origination relationships that smaller traders cannot easily match.
Business & Operating Risks
The most material disclosed risk is the Viterra integration and leverage burden, because the acquisition brought significant integration-related costs and a larger debt load that will absorb more cash flow from operations. Ukraine remains a real operating risk, but the direct balance-sheet exposure is limited: total assets and liabilities tied to the Ukrainian subsidiaries were each less than 2% of consolidated totals at December 31, 2025. Commodity, freight, and energy price volatility is the other major risk, and it can move margins quickly in a business with global commodity exposure. Taken together, these risks do not break the moat itself, but they do test whether the integrated network can convert scale into cash fast enough to justify the heavier capital structure.
Management Discussion & Analysis
Management is clearly prioritizing scale and integration over near-term deleveraging, and that is the right read on the filing. The Viterra acquisition closed on July 2, 2025, and the financing mix shows that management was willing to add debt to fund the platform buildout rather than preserve balance-sheet flexibility. The 2026 capital plan of $1.5B to $1.7B, aimed at maintenance, safety, compliance, and growth and productivity projects, reinforces that the next dollar of spend is still being directed into the operating base. I read that as a constructive signal for the moat, but it also means cash will stay tied up until the integration starts producing cleaner earnings conversion.
Recent Events
The March 17, 2026 senior notes issuance was the most important recent event, with Bunge’s finance subsidiary selling $500M of 4.8% notes due 2033 and $700M of 5.2% notes due 2036. In my view, that improves liquidity and gives management more room to refinance shorter-dated debt, fund capex, or repurchase stock without leaning entirely on operating cash flow. The March 31, 2026 expansion of the trade receivables securitization program to 2B also widens working-capital funding capacity, while the March 26, 2026 Executive Integration Incentive Program ties compensation to cumulative run-rate cost synergies over 2026 to 2028. Those moves support the moat thesis because they keep the integration agenda funded and disciplined, but they do not yet prove that the cash conversion problem has been solved.
Financial Analysis
Growth
BG — Financial Growth (Quarterly, USD Mil)
| Metric | 2025-06-30 | 2025-09-30 | 2025-12-31 | 2026-03-31 | 2026-06-30 |
|---|---|---|---|---|---|
| REVENUE (USD Mil) | 12,769 | 22,155 | 23,762 | 21,861 | 24,041 |
| EBIT (USD Mil) | 600 | 472 | 302 | 242 | 1,140 |
| EBITDA (USD Mil) | 716 | 713 | 528 | 480 | 1,396 |
| NET INCOME (USD Mil) | 354 | 166 | 95 | 68 | 678 |
| DILUTED EPS | 2.6 | 0.8 | 0.5 | 0.3 | 3.5 |
Source: Yahoo Finance — Quarterly Financial Statements
Revenue rose to $24B in Q2 2026 from $12.8B a year earlier, and EBITDA increased to $1.4B from $716M over the same period. That is not just top-line scale; it shows the combined network is already producing operating leverage, which is consistent with the broader origination footprint described above. The Q1 2026 dip to $21.9B of revenue and $480M of EBITDA looks like a temporary swing rather than a broken trend, especially with the Viterra acquisition now embedded in the base.
Profitability
BG — Profitability (TTM)
| Metric | TTM |
|---|---|
| Operating Margin (TTM) | 4.6% |
| Net Margin (TTM) | 1.1% |
| Return on Assets (TTM) | 3.5% |
| Return on Equity (TTM) | 7.2% |
| Gross Margin (TTM) | 4.9% |
| EBITDA Margin (TTM) | 3.4% |
Source: Yahoo Finance — Trailing Twelve Months (TTM)
TTM operating margin was 4.6%, gross margin was 4.9%, EBITDA margin was 3.4%, net margin was 1.1%, return on assets was 3.5%, and return on equity was 7.2%. The narrow spread between gross and operating margin tells me the main issue is not pricing power at the gross-profit line; it is the low-margin, high-volume nature of agribusiness and the cost of running a global network. The gap between ROE and ROA also suggests leverage is amplifying returns, so I would want to see net margin move closer to operating margin before I call the earnings base durable. Profitability is acceptable, but it is still more a scale story than a margin-quality story.
Valuation
BG — Valuation Multiples
| Metric | Value |
|---|---|
| Current Share Price (USD) | 101.7 |
| Market Cap (USD Mil) | 19,533 |
| Enterprise Value (USD Mil) | 37,368 |
| Trailing P/E | 20.3 |
| Forward P/E | 9.1 |
| Price/Sales (TTM) | 0.2 |
| Price/Book (mrq) | 1.2 |
| EV/Revenue | 0.4 |
| EV/EBITDA | 12 |
| Beta (5Y Monthly) | 0.72 |
| FCF Yield % (TTM) | -33.1% |
| Forward EPS (USD) | 11.2 |
| Analyst Target Price – Low (USD) | 116 |
| Analyst Target Price – Mean (USD) | 140.6 |
| Analyst Target Price – High (USD) | 155 |
| # Analyst Opinions | 9 |
Source: Yahoo Finance
Bunge trades at 12.0x EV/EBITDA, 9.1x forward P/E, 0.4x EV/revenue, and 0.2x price/sales, with a current share price of $101.7 and a market cap of $19.5B. The forward multiple is much lower than the trailing P/E of 20.3x because TTM earnings were depressed by the integration period, so the market is clearly looking through a weak trailing base. I would put fair value in a broad range of about $95-$145 per share, which sits inside the analyst target range of $116-$$155 and below the $140.6 mean because I weight the -33.2% FCF yield and 5.2x net debt/EBITDA more heavily than the consensus appears to. On the earnings side, forward EPS of 11.2 implies a much cleaner run-rate than the trailing base, but that still looks more like a recovery valuation than a cash-rich compounder. The valuation is not cheap enough to ignore leverage, yet it is not rich enough to require perfect execution.
Leverage
BG — Leverage & Coverage (Quarterly)
| Metric | Value |
|---|---|
| Total Debt/Equity % (mrq) | 98 |
| Current Ratio (mrq) | 1.6 |
| Total Debt (mrq, USD Mil) | 17,061 |
| Operating Cash Flow (TTM, USD Mil) | 1,075 |
| Levered Free Cash Flow (TTM, USD Mil) | -6,475.4 |
| Net Debt/EBITDA (TTM) | 5.2 |
| FCF Margin % (TTM) | -7.0% |
Source: Yahoo Finance — Quarterly Financial Statements
Bunge’s leverage is elevated but still serviceable. Total debt/equity was 98.0%, current ratio was 1.6x, and total debt was $17.1B, so the balance sheet is meaningfully geared but not in immediate liquidity distress. Operating cash flow was $1.1B TTM, while levered free cash flow was -$6.5B and FCF margin was -7.1%, which tells me working capital, capex, and financing costs are still absorbing cash faster than earnings are converting into it. Net debt/EBITDA of 5.2x is the key threshold here: below 4.5x would show real deleveraging progress, while staying above 5.0x would keep refinancing risk front and center. The leverage profile is the main reason I stay at Hold.
Insider Activity
The insider transaction record shows one open-market sale and no open-market purchases across 112 Form 4 filings from 2025-03-04 to 2026-06-01. The only named trade in the data is Christopher Mahoney’s sale of 553 shares at $122.68 on 2026-05-15. I do not read that as a strong bearish signal on its own because it is a single transaction, but it does not add conviction on the upside either.
Comparable Analysis
LF0 has published standalone analyses of these peers: Archer-Daniels-Midland (ADM) (rated Hold).
Growth
| Company | Revenue TTM (USD Mil) | Revenue Growth YoY % | EBITDA TTM (USD Mil) | Diluted EPS TTM |
|---|---|---|---|---|
| BG | 91,819 | 88.3% | 3,126 | 5 |
| ADM | 82,099 | 7.2% | 2,995 | 3.6 |
| TSN | 55,694 | -0.1% | 2,772 | 1.6 |
| GIS | 18,296.6 | -2.8% | 3,415 | -1.6 |
| INGR | 7,215 | 0.9% | 1,154 | 9.2 |
| ANDE | 10,938.9 | -1.2% | 302.5 | 5.2 |
Source: Yahoo Finance
Bunge’s revenue growth stands out sharply versus peers: 88.3% TTM, compared with 7.2% for ADM, -0.1% for TSN, -2.8% for GIS, 0.9% for INGR, and -1.2% for ANDE. EBITDA of $3.1B also sits above TSN’s $2.8B and ANDE’s $302.5M, which tells me the scale-up is not just a revenue effect. The market is not paying for growth alone, though, because the leverage profile still makes the earnings base more fragile than the top-line number suggests.
Valuation
| Company | Current Share Price (USD) | Trailing P/E | Forward P/E | EV/Revenue | EV/EBITDA | Price/Sales (TTM) | Price/Book (mrq) | Market Cap (USD Mil) | Enterprise Value (USD Mil) | Beta (5Y Monthly) | FCF Yield % (TTM) | Forward EPS | Analyst Target Price – Low | Analyst Target Price – Mean | Analyst Target Price – High | # Analyst Opinions |
|---|---|---|---|---|---|---|---|---|---|---|---|---|---|---|---|---|
| BG | 101.7 | 20.3 | 9.1 | 0.4 | 12 | 0.2 | 1.2 | 19,533 | 37,368 | 0.72 | -33.1% | 11.2 | 116 | 140.6 | 155 | 9 |
| ADM | 78.5 | 21.5 | 13.8 | 0.6 | 15.6 | 0.5 | 1.6 | 37,824 | 46,628 | 0.63 | 3.1% | 5.7 | 60 | 80.3 | 95 | 10 |
| TSN | 55.7 | 34.4 | 14.3 | 0.5 | 9.8 | 0.4 | 1.1 | 19,581 | 27,214 | 0.40 | 6.1% | 3.9 | 56 | 63 | 75 | 12 |
| GIS | 33.3 | — | 10.6 | 1.7 | 9.1 | 1 | 2.4 | 17,794 | 31,215 | 0.02 | 7.3% | 3.2 | 30 | 37 | 45 | 18 |
| INGR | 94.3 | 10.3 | 8.4 | 0.9 | 5.9 | 0.8 | 1.3 | 5,948 | 6,849 | 0.64 | 7.7% | 11.2 | 104 | 119.5 | 150 | 6 |
| ANDE | 64.1 | 12.4 | 10 | 0.3 | 10.1 | 0.2 | 1.6 | 2,184 | 3,047 | 0.66 | -5.0% | 6.4 | 80 | 86.7 | 90 | 3 |
Source: Yahoo Finance
BG trades at 12.0x EV/EBITDA and 9.1x forward P/E, versus ADM at 15.6x and 13.8x, TSN at 9.8x and 14.3x, GIS at 9.1x and 10.6x, INGR at 5.9x and 8.4x, and ANDE at 10.1x and 10.0x. BG’s -33.2% FCF yield is the key outlier, while ADM, TSN, GIS, and INGR all post positive yields. On a peer-multiple basis, BG’s growth is stronger than most of the group, but the cash conversion gap keeps the stock from looking cheap on a growth-adjusted basis.
Profitability
| Company | Operating Margin (TTM) | Net Margin (TTM) | Return on Assets (TTM) | Return on Equity (TTM) | Gross Margin (TTM) | EBITDA Margin (TTM) |
|---|---|---|---|---|---|---|
| BG | 4.6% | 1.1% | 3.5% | 7.2% | 4.9% | 3.4% |
| ADM | 4.0% | 2.2% | 2.3% | 7.6% | 6.9% | 3.6% |
| TSN | 2.7% | 1.0% | 2.6% | 3.3% | 6.6% | 5.0% |
| GIS | 15.2% | -4.9% | 5.6% | -10.5% | 33.7% | 18.7% |
| INGR | 12.6% | 8.2% | 7.3% | 13.7% | 23.7% | 16.0% |
| ANDE | 1.6% | 1.6% | 3.0% | 12.2% | 7.2% | 2.8% |
Source: Yahoo Finance
BG’s operating margin of 4.6% and EBITDA margin of 3.4% are ahead of ADM’s 4.0% and 3.6%, TSN’s 2.7% and 5.0%, and ANDE’s 1.6% and 2.8%, but below INGR’s 12.6% and 16.0% and GIS’s 15.2% and 18.7%. Gross margin at 4.9% is also below ADM, TSN, GIS, INGR, and ANDE, which tells me BG is still running a lower-margin processing model even after the scale increase. Returns are solid rather than exceptional, with ROE of 7.2% and ROA of 3.5%, so the company is profitable but not yet a clear margin leader.
Leverage
| Company | Total Debt/Equity % (mrq) | Current Ratio (mrq) | Total Debt (mrq, USD Mil) | Operating Cash Flow TTM (USD Mil) | Free Cash Flow TTM (USD Mil) | Net Debt/EBITDA (TTM) | FCF Margin % (TTM) |
|---|---|---|---|---|---|---|---|
| BG | 98 | 1.6 | 17,061 | 1,075 | -6,475.4 | 5.2 | -7.0% |
| ADM | 39.1 | 1.4 | 9,342 | 2,795 | 1,164.6 | 2.8 | 1.4% |
| TSN | 44 | 1.4 | 8,006 | 2,004 | 1,191.2 | 2.6 | 2.1% |
| GIS | 182.4 | 0.7 | 13,615.6 | 2,067 | 1,302.6 | 3.9 | 7.1% |
| INGR | 39.4 | 2.8 | 1,783 | 805 | 457.2 | 0.7 | 6.3% |
| ANDE | 66.3 | 1.5 | 900.8 | 321.9 | -109.1 | 2.8 | -1.0% |
Source: Yahoo Finance
BG’s debt/equity of 98.0% is well above ADM’s 39.1%, TSN’s 44.0%, INGR’s 39.4%, and ANDE’s 66.3%, while net debt/EBITDA of 5.2x is also above ADM’s 2.8x, TSN’s 2.6x, INGR’s 0.7x, and ANDE’s 2.8x. The current ratio of 1.6x is better than GIS’s 0.7x and slightly ahead of ADM and TSN at 1.4x, so liquidity is not the issue; cash conversion is. That is why BG’s valuation premium to some peers is hard to justify unless leverage comes down and free cash flow turns positive.
Conclusion
I would put my rating as a Hold because the Viterra combination has clearly enlarged the platform, but the cash conversion gap is still too wide for me to call the stock a Buy. The bull case is straightforward: if Bunge can keep EBITDA moving higher while turning levered free cash flow positive and bringing net debt/EBITDA below 4.5x, the market should start to value the company as a scaled global network rather than as a leveraged commodity processor. On the current revenue base, even a modest lift in EBITDA margin would matter because it would improve deleveraging and make the 9.1x forward P/E easier to defend. The bear case is just as clear: if leverage stays above 5.0x and free cash flow remains negative for another two quarters, then the integration burden is still absorbing the earnings lift and the stock will likely keep trading as a low-margin business with a heavy debt load.
What tips the balance for me is timing. The earnings base is already improving, and the enlarged origination network should keep supporting volume, but I want to see the cash flow bridge before I move higher. For now, Hold is the right call.
What to Watch Next
- Levered free cash flow turning positive — would support a move toward Buy.
- Net debt/EBITDA below 4.5x — would show real deleveraging progress.
- EBITDA margin above 5.0% — would make the current forward multiple easier to defend.
- Net debt/EBITDA staying above 5.0x for two more quarters — would keep refinancing risk elevated.
- Quarterly revenue holding near $24B while cash flow improves — would confirm the scale-up is funding itself.
What’s your take? I rated Bunge Global (BG) HOLD above — but the goal here is to get this right, not just to publish an opinion. What would you add to this analysis, or which risk or catalyst do you think I’m under- or over-weighting? Tell me in the comments.
Our track record: every directional call is tracked publicly on The Scorecard, and Stocks Covered lists every company we have rated and when.
Sources
- SEC 10-K Annual Report — filed 2026-02-19
- SEC 8-K Filing (2026-05-22)
- SEC 8-K Filing (2026-04-29)
- SEC 8-K Filing (2026-04-02)
- SEC 8-K Filing (2026-04-01)
- SEC 8-K Filing (2026-03-19)
- SEC 8-K Filing (2026-03-17)
- SEC Form 4 Insider Transaction (2026-06-03)
- SEC Form 4 Insider Transaction (2026-06-03)
- SEC Form 4 Insider Transaction (2026-06-03)
- SEC 10-K Annual Report — FY2026
- SEC 10-K Annual Report — FY2025
- SEC 10-K Annual Report — FY2024
Data sourced from Yahoo Finance and SEC EDGAR. Not investment advice.
Leave a Comment