Expected price range
Each range is set from the stock’s recent price history and our Hold rating, using its own 1-year realised volatility (109% annualised) as the width of a ~68% statistical band, and checked against that rating so the range leans the same way as our view. Starting price $48.15 (close 2026-10-28). The stock traded between $25.44 and $75.91 over the last 6 months and between $25.44 and $98.77 over the last year. This is an illustration of where our view and normal volatility point, not a forecast, price target or investment advice; the stock can move outside it.
| Company | Oct 25 | Nov 25 | Dec 25 | Jan 26 | Feb 26 | Mar 26 | Apr 26 | May 26 | Jun 26 | Jul 26 | Aug 26 | Sep 26 | 12-Mo |
|---|---|---|---|---|---|---|---|---|---|---|---|---|---|
| PSIX | -13% | -37% | +6% | +25% | +17% | -27% | +20% | -43% | -7% | -29% | +32% | +27% | -53% |
| POWL | +26% | -16% | -1% | +39% | +18% | +3% | +54% | +3% | +1% | -27% | -14% | +3% | +82% |
| FIX | +17% | +1% | -4% | +22% | +25% | -3% | +33% | -1% | +8% | -13% | -11% | +7% | +101% |
| PPSI | +6% | -17% | +24% | -10% | -14% | -12% | +19% | +40% | -27% | -26% | +1% | +15% | -22% |
| GNRC | +0% | -10% | -10% | +23% | +34% | -13% | +33% | +7% | +5% | -33% | -6% | +12% | +24% |
| STRL | +11% | -9% | -11% | +17% | +20% | -5% | +27% | +67% | -2% | -29% | -21% | +5% | +45% |
Source: Yahoo Finance monthly adjusted close.
Quick Thesis
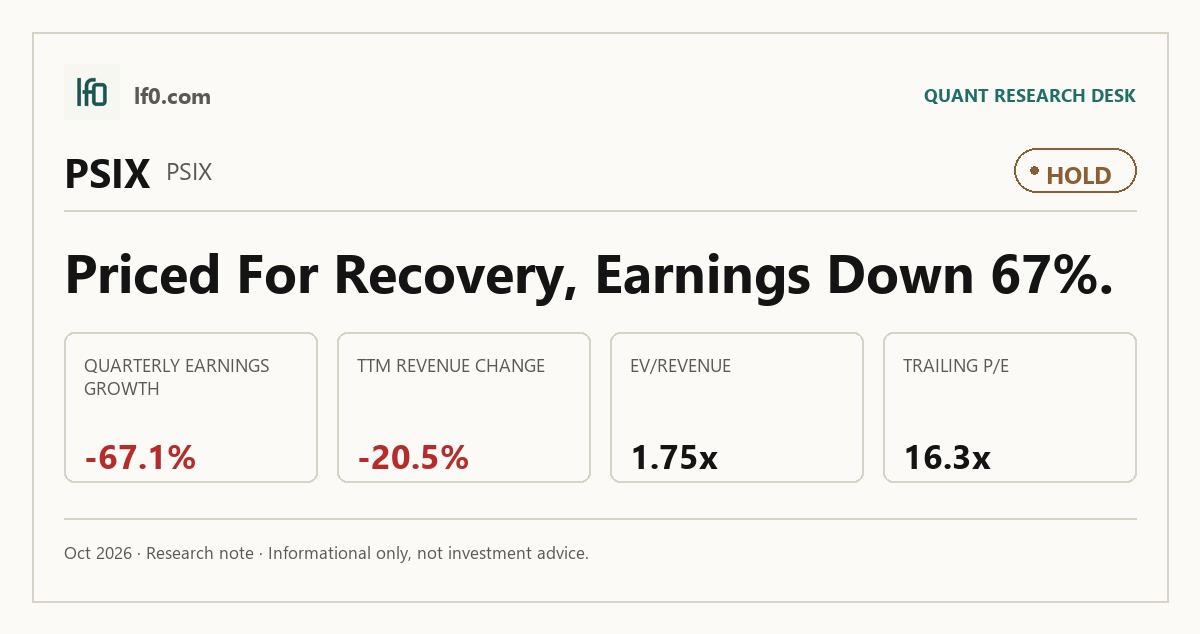
- Rated Hold — recovery is real, but growth is still uneven.
- Strongest support: $42.1M of levered free cash flow TTM.
- Main risk: 20.5% TTM revenue decline.
- Valuation is fair, not cheap: 12.6x EV/EBITDA and 16.3x trailing P/E.
- I would raise my rating if revenue holds above $152.5M and operating margin stays above 15.7%.
Executive Summary
Rating: HOLD | PSIX
Measured from adjusted close on 2026-10-28 to 2026-10-28. Sell ratings are correct when the stock falls; Hold is tracked as a +/-10% range. Daily-close data, not intraday. Calls are tracked for 182 days from publication, then frozen as a final record.
I would put my rating as a Hold because Power Solutions International is profitable and lightly levered, yet the market is already paying for a recovery that has not fully shown up in the top line. Revenue was $152.5M in Q2 2026 after $128.6M in Q1 2026, so the business is improving, but the 20.5% TTM revenue decline and 14.7x forward P/E leave limited room for disappointment.
The strongest support is cash generation: levered free cash flow was $42.1M TTM, equal to a 3.8% free cash flow yield, which gives the business room to fund growth and service debt. The main risk is execution rather than solvency, because the company still depends on tariff-sensitive imported inputs and oil and gas customers.
I would become more constructive if quarterly revenue can hold above $152.5M and operating margin stays above 15.7%, because that would show the mix shift is finally flowing through to earnings. If that does not happen, I would stay at Hold rather than pay up for a cleaner growth profile that is not yet visible in the numbers.
Company Profile
Power Solutions International, Inc. designs, engineers, manufactures, markets, and sells emission-certified engines and integrated power systems for power systems, industrial, and transportation end markets. Its products run on natural gas, propane, biofuels, gasoline, and diesel, and they are sold mainly to original equipment manufacturers and end users for standby and prime power generation, microgrids, combined heat and power, forklifts, agricultural equipment, construction, pumps, compressors, utility vehicles, trucks, and buses. The company also runs aftermarket service-parts programs worldwide.
PSI manufactures at facilities in suburban Chicago, Illinois, and in Darien and Beloit, Wisconsin. It has expanded from diesel toward alternative-fuel and heavy-duty engines, including EPA-certified 32L, 40L, and 53L platforms, and it continues to add battery-pack and electrification offerings. Weichai owns 46.0% of the common stock, and the company had about 1,000 full-time employees at December 31, 2025.
Economic Moat
Business Model
The clearest advantage is PSI’s ability to deliver emission-certified, application-specific power systems that are engineered to meet EPA, CARB, MEE, and EU requirements, then tested and validated as complete packages rather than loose engine parts. In my view, a competitor would struggle to replicate that certification depth, integration know-how, and application engineering within 3 years because PSI combines in-house design, prototyping, testing, validation, and aftermarket support.
The Weichai relationship adds another layer of support through R&D, manufacturing, procurement, distribution, and China channels, while the Baudouin distribution agreement extends reach into Europe, the Middle East, and Africa. That said, the moat is not a pricing moat; PSI still faces engine makers, power-generation equipment companies, and OEM in-house operations, so the edge is about certification and customization rather than category control.
Business & Operating Risks
The most material disclosed risk is tariff exposure across the supply chain and export base, because the company sources products including engines, components, and materials internationally, including from China. According to the risk factors in its SEC 10-K, the U.S. Supreme Court struck down IEEPA tariffs on February 20, 2026, but replacement tariffs under Section 122 of the Trade Act of 1974 were imposed immediately and are temporary, with a 150-day maximum duration. PSI says tariff costs may not be pass-throughable without hurting demand, so the pressure would likely show up first in gross margin and only later in revenue.
Supply-chain fragility is the second risk, and it is already more than theoretical. The filing says the company depends on key third-party suppliers and that some components cannot be quickly or inexpensively re-sourced, while also noting that in July 2023 it began experiencing delays tied to the Uyghur Forced Labor Prevention Act and that the importing of certain forklift products was suspended through the third quarter of 2024. That history matters because it shows how a supplier issue can interrupt shipments and raise working capital needs.
Customer concentration is the third risk, especially in oil and gas end markets, which accounted for approximately $193.9M of 2025 net sales versus $105.5M in 2024. The company warns that prolonged low crude prices and low rig counts could severely affect sales, so this is a real cyclical exposure even if the current numbers do not show a collapse in demand.
Taken together, these risks do not break the certification-and-customization moat, but they do threaten the margin discipline that moat is supposed to protect.
Management Discussion & Analysis
Management is clearly steering the business toward power systems, and the 2025 mix shift shows that the pivot is real. Power systems net sales rose to $586.3M from $325.7M in 2024 and now represent 81.0% of revenue, while industrial fell to $114.8M from $123.3M and transportation to $21.3M from $27M. That mix shift matters because it moves PSI toward higher-specification applications where the moat is stronger, but the 25.6% gross margin in 2025 versus 29.5% in 2024 also shows the ramp is still carrying inefficiency costs.
The company is expanding capacity for data center demand and says it is prioritizing higher-growth, higher-margin products, which fits the 52.0% increase in revenue to $722.4M in 2025. At the same time, selling, general and administrative expenses rose 49.0% to $55.8M, so the growth is still being bought with higher operating spend. The July 30, 2025 amendment to the Revolving Credit Agreement raised borrowing capacity to $135M and pushed maturity to July 30, 2027, which improves runway but does not change the fact that management is still funding growth with a balance sheet that carries debt.
Prior filings show a mixed but mostly credible track record. In 2024, management emphasized growth in power systems and a broader geographic push, and 2025 results confirmed that direction with U.S. sales rising to $675.2M from $419.7M and power systems becoming the dominant end market. Interest expense also fell to $6.7M from $11.4M, but operating cash flow dropped to $24.1M from $62.4M because working capital absorbed cash, so the balance-sheet improvement has not yet translated into stronger cash generation.
Management’s current MD&A is constructive, but the margin and cash-flow data show that the moat is still being tested by execution.
Recent Events
The most significant development was the May 12, 2026 leadership reset, when Constantine Xykis resigned as chief executive officer and the board installed Xun Li, the chief financial officer, as interim chief executive officer. In my view, that weakens the near-term thesis because the company is now in a transition period while it searches for a permanent chief executive officer, even if Li’s finance background should help with discipline.
A second signal was the March 6, 2026 approval of the 2026 Phantom Unit Plan, which creates cash-settled awards tied to the share price and vests over three years. I read that as a retention tool rather than a growth catalyst, so it supports continuity but also adds another cash obligation while the company is navigating a leadership handoff.
The March 11 and May 11, 2026 8-Ks were routine investor-call and earnings-release filings, and they do not add a new strategic event beyond the company’s ongoing disclosure cadence. Recent events therefore weaken the investment case modestly because the CEO change introduces uncertainty at the same time the operating thesis is still proving itself.
Financial Analysis
Growth
PSIX — Financial Growth (Quarterly, USD Mil)
| Metric | 2025-06-30 | 2025-09-30 | 2025-12-31 | 2026-03-31 | 2026-06-30 |
|---|---|---|---|---|---|
| REVENUE (USD Mil) | 191.9 | 203.8 | 191.2 | 128.6 | 152.5 |
| EBIT (USD Mil) | 32.8 | 28.4 | 24.3 | 11.5 | 24 |
| EBITDA (USD Mil) | 34.1 | 29.8 | 25.7 | 13.2 | 25.7 |
| NET INCOME (USD Mil) | 51.2 | 27.6 | 16.1 | 7.3 | 16.9 |
| DILUTED EPS | 2.2 | 1.2 | 0.7 | 0.3 | 0.7 |
Source: Yahoo Finance — Quarterly Financial Statements
PSIX’s revenue turned down sharply after a brief late-2025 plateau. Revenue was $203.8M in Q3 2025, then $191.2M in Q4 2025, fell to $128.6M in Q1 2026, and recovered to $152.5M in Q2 2026. On a year-over-year basis, Q2 2026 revenue was up 20.0% versus $127.1M in Q2 2025, while EBITDA rose to $25.7M from $13.2M a year earlier, so operating leverage improved.
The Q1 2026 dip looks like a swing rather than a trend break, but the uneven quarter-to-quarter path keeps this growth signal neutral rather than bullish. That volatility also matters for the moat: a business built on certified systems can defend margins, but it still needs steadier volume to make the model compound.
Profitability
PSIX — Profitability (TTM)
| Metric | TTM |
|---|---|
| Operating Margin (TTM) | 15.7% |
| Net Margin (TTM) | 10.0% |
| Return on Assets (TTM) | 12.3% |
| Return on Equity (TTM) | 40.1% |
| Gross Margin (TTM) | 23.9% |
| EBITDA Margin (TTM) | 13.9% |
Source: Yahoo Finance — Trailing Twelve Months (TTM)
TTM operating margin of 15.7%, gross margin of 23.9%, and EBITDA margin of 13.9% show PSI is still early in its scaling phase, because the 8.2-point gap from gross to operating margin means selling, engineering, and overhead costs are still absorbing a large share of revenue. TTM net margin of 10.0% is lower than operating margin, which means interest, taxes, and other below-the-line items still take a meaningful cut, but the business is already keeping a solid portion of sales after those charges.
TTM return on assets of 12.3% and return on equity of 40.1% point to strong capital efficiency, although the wide ROE versus ROA gap suggests leverage is amplifying returns rather than the asset base alone generating them. I would watch operating margin moving closer to gross margin, because that would show scale is finally lowering overhead and would make the current moat more visible in the numbers.
Valuation
PSIX — Valuation Multiples
| Metric | Value |
|---|---|
| Current Share Price (USD) | 48 |
| Market Cap (USD Mil) | 1,106 |
| Enterprise Value (USD Mil) | 1,187 |
| Trailing P/E | 16.3 |
| Forward P/E | 14.7 |
| Price/Sales (TTM) | 1.6 |
| Price/Book (mrq) | 5.4 |
| EV/Revenue | 1.8 |
| EV/EBITDA | 12.6 |
| Beta (5Y Monthly) | 2.01 |
| FCF Yield % (TTM) | 3.8% |
| Forward EPS (USD) | 3.3 |
| Analyst Target Price – Low (USD) | 63.4 |
| Analyst Target Price – Mean (USD) | 69.8 |
| Analyst Target Price – High (USD) | 76 |
| # Analyst Opinions | 3 |
Source: Yahoo Finance
PSIX trades at 1.75x EV/Revenue and 1.64x Price/Sales on a current share price of $47.95, so the market is paying about 1.75 of enterprise value for every 1.00 of annual sales. The 12.6x EV/EBITDA multiple and 16.3x trailing P/E are not stretched in isolation, but they only look reasonable because TTM EBITDA margin is 13.9% and net margin is 10.0%, which means the equity is being valued as a profitable niche manufacturer rather than a cyclical engine supplier.
Forward P/E is 14.7x, and with forward EPS of $3.26 the stock is pricing in earnings that stay close to today’s level. PEG is 0.8x, which suggests the market is not demanding much growth for that earnings stream, while Price/Book is 5.4x against book value per share of $8.8, so investors are paying a large premium to accounting equity for a business with a 40.1% return on equity. FCF yield is 3.8%, which is modest at a $47.95 share price and says the stock is not cheap on cash generation.
On the analysis here, I would put fair value in a range of roughly $48-$60 per share. That sits below the $63.4–$76 analyst target range from three opinions, which tells me the consensus is more optimistic than I am; I think the market is giving too much credit to a clean earnings recovery before the growth trend has fully stabilized. The implied earnings path is also not especially rich versus peers: PSIX’s $3.26 forward EPS is far below FIX’s $65.9 and STRL’s $25.8, so the stock is not being valued on earnings power yet, only on a possible rebound.
Leverage
PSIX — Leverage & Coverage (Quarterly)
| Metric | Value |
|---|---|
| Total Debt/Equity % (mrq) | 67 |
| Current Ratio (mrq) | 2.6 |
| Total Debt (mrq, USD Mil) | 136.2 |
| Operating Cash Flow (TTM, USD Mil) | 74.4 |
| Levered Free Cash Flow (TTM, USD Mil) | 42.1 |
| Net Debt/EBITDA (TTM) | 0.7 |
| FCF Margin % (TTM) | 6.2% |
Source: Yahoo Finance — Quarterly Financial Statements
Total debt was $136.2M, with total debt to equity at 67.1% and a current ratio of 2.6x. Operating cash flow was $74.4M TTM, levered free cash flow was $42.1M TTM, net debt to EBITDA was 0.7x, and FCF margin was 6.2%.
That mix says leverage is manageable and the company has room to absorb a downturn, because cash generation is still positive and net debt is low relative to EBITDA. The current ratio gives a near-term liquidity cushion, while the 6.2% FCF margin shows cash conversion is positive but not especially wide, so a weaker operating quarter would matter more if EBITDA softened further. The balance sheet is one reason I do not have a Sell view, but it is not strong enough to justify paying for growth that has not yet proven durable.
Insider Activity
The insider transaction record is one-sided: there were 5 open-market sales and 0 open-market purchases in the 2025-01-14 to 2026-02-12 window, so insiders were net sellers. The activity is concentrated in a single 10%+ owner, Gary S. Winemaster, rather than broad across management, which makes the signal more limited than a company-wide selling wave, but it still leaves no offsetting buy-side support. I read that as a mild negative, not a thesis breaker, because the ownership base remains concentrated and the sales do not look like a broad governance reset.
Comparable Analysis
LF0 has published standalone analyses of these peers: Powell Industries (POWL) (rated Hold); Comfort Systems USA (FIX) (rated Sell); Generac Holdings (GNRC) (rated Hold).
Growth
| Company | Revenue TTM (USD Mil) | Revenue Growth YoY % | EBITDA TTM (USD Mil) | Diluted EPS TTM |
|---|---|---|---|---|
| PSIX | 676.2 | -20.5% | 94.1 | 2.9 |
| POWL | 1,157.5 | 8.9% | 236.2 | 5.2 |
| FIX | 12,543.4 | 53.7% | 2,272.2 | 46.3 |
| PPSI | 21.8 | -40.0% | -5.4 | -0.7 |
| GNRC | 4,438.7 | 10.6% | 636.2 | 4.3 |
| STRL | 3,438.5 | 90.1% | 714 | 13.9 |
Source: Yahoo Finance
PSIX’s revenue fell 20.5% TTM, while POWL grew 8.9%, FIX grew 53.7%, GNRC grew 10.6%, STRL grew 90.1%, and PPSI fell 40.0%. PSIX sits in the middle of a split group, but it still trails the profitable industrial peers by a wide margin, and that gap is hard to ignore when quarterly earnings growth was also -67.1%.
Valuation
| Company | Current Share Price (USD) | Trailing P/E | Forward P/E | EV/Revenue | EV/EBITDA | Price/Sales (TTM) | Price/Book (mrq) | Market Cap (USD Mil) | Enterprise Value (USD Mil) | Beta (5Y Monthly) | FCF Yield % (TTM) | Forward EPS | Analyst Target Price – Low | Analyst Target Price – Mean | Analyst Target Price – High | # Analyst Opinions |
|---|---|---|---|---|---|---|---|---|---|---|---|---|---|---|---|---|
| PSIX | 48 | 16.3 | 14.7 | 1.8 | 12.6 | 1.6 | 5.4 | 1,106 | 1,187 | 2.01 | 3.8% | 3.3 | 63.4 | 69.8 | 76 | 3 |
| POWL | 165.4 | 31.7 | 23.7 | 4.5 | 22.2 | 5.2 | 8 | 6,027 | 5,248 | 1.17 | 3.2% | 7 | 235 | 267.5 | 333 | 4 |
| FIX | 1,333.1 | 28.8 | 20.2 | 3.4 | 19 | 3.7 | 14 | 46,916 | 43,159 | 1.66 | 4.5% | 65.9 | 1,808 | 1,916.9 | 2,053 | 8 |
| PPSI | 2.6 | — | -15.4 | 0.9 | -3.8 | 1.3 | 1.2 | 29 | 20 | 1.85 | -19.8% | -0.2 | 7 | 9.5 | 12 | 2 |
| GNRC | 193.2 | 44.4 | 14.9 | 2.8 | 19.8 | 2.6 | 4 | 11,411 | 12,570 | 1.92 | 2.5% | 13 | 215 | 286.4 | 375 | 18 |
| STRL | 379.2 | 27.3 | 14.7 | 3.2 | 15.6 | 3.4 | 8.6 | 11,599 | 11,147 | 1.86 | 3.0% | 25.8 | 700 | 836.7 | 1,000 | 7 |
Source: Yahoo Finance
PSIX trades at 1.75x EV/Revenue, 16.3x trailing P/E, 14.7x forward P/E, and a 3.8% FCF yield, versus POWL at 4.5x, 31.7x, 23.7x, and 3.2%, FIX at 3.4x, 28.8x, 20.2x, and 4.5%, GNRC at 2.8x, 44.4x, 14.9x, and 2.5%, and STRL at 3.2x, 27.3x, 14.7x, and 3.0%. PSIX’s lower leverage helps explain part of the discount to the higher-multiple names, but the market is still not paying a growth premium for it, which is why the stock looks fair rather than cheap on a growth-adjusted basis.
Profitability
| Company | Operating Margin (TTM) | Net Margin (TTM) | Return on Assets (TTM) | Return on Equity (TTM) | Gross Margin (TTM) | EBITDA Margin (TTM) |
|---|---|---|---|---|---|---|
| PSIX | 15.7% | 10.0% | 12.3% | 40.1% | 23.9% | 13.9% |
| POWL | 20.6% | 16.5% | 11.6% | 28.3% | 30.1% | 20.4% |
| FIX | 16.5% | 13.0% | 16.9% | 58.6% | 25.7% | 18.1% |
| PPSI | -39.9% | -38.1% | -11.6% | -26.7% | 16.2% | -24.8% |
| GNRC | 17.9% | 5.8% | 4.7% | 9.5% | 39.5% | 14.3% |
| STRL | 20.1% | 12.5% | 14.6% | 40.0% | 23.8% | 20.8% |
Source: Yahoo Finance
PSIX’s 15.7% operating margin, 10.0% net margin, 23.9% gross margin, and 13.9% EBITDA margin trail POWL’s 20.6%, 16.5%, 30.1%, and 20.4%, and also sit below FIX’s 16.5%, 13.0%, 25.7%, and 18.1% and STRL’s 20.1%, 12.5%, 23.8%, and 20.8%. Because PSIX’s gross margin is only modestly below the better peers while operating margin is more clearly behind, the shortfall looks more like opex absorption and smaller scale than a fundamentally weaker product margin.
Leverage
| Company | Total Debt/Equity % (mrq) | Current Ratio (mrq) | Total Debt (mrq, USD Mil) | Operating Cash Flow TTM (USD Mil) | Free Cash Flow TTM (USD Mil) | Net Debt/EBITDA (TTM) | FCF Margin % (TTM) |
|---|---|---|---|---|---|---|---|
| PSIX | 67 | 2.6 | 136.2 | 74.4 | 42.1 | 0.7 | 6.2% |
| POWL | 0.3 | 2 | 2.5 | 256.1 | 190.4 | -2.7 | 16.4% |
| FIX | 11.2 | 1.1 | 374.4 | 3,006.9 | 2,128.6 | -0.8 | 17.0% |
| PPSI | 5.4 | 4.1 | 1.3 | -5.5 | -5.8 | 1.7 | -26.4% |
| GNRC | 49 | 2 | 1,410.3 | 548.1 | 289.1 | 1.8 | 6.5% |
| STRL | 24.2 | 1.1 | 336.8 | 597.7 | 349.4 | -0.2 | 10.2% |
Source: Yahoo Finance
PSIX’s 67.1% debt to equity and 0.7x net debt to EBITDA are higher than POWL’s 0.3% debt to equity and negative 2.7x net debt to EBITDA, but far safer than GNRC’s 49.0% debt to equity and 1.8x net debt to EBITDA, while FIX and STRL sit at 11.2% and 24.2% debt to equity with negative net debt to EBITDA. PSIX’s 6.2% FCF margin is below FIX’s 17.0% and POWL’s 16.4%, but it is still positive and supports the balance sheet, so the leverage profile looks like a manageable financing choice rather than a distress signal.
Conclusion
The key tension is that PSI has already shown it can generate profit and cash, but the revenue trend is still too uneven for me to call the recovery durable. Revenue reached $152.5M in Q2 2026 after $128.6M in Q1 2026, and that rebound matters because it needs to hold if the 15.7% operating margin is going to translate into a better earnings base rather than a one-quarter bounce.
I would keep the rating at Hold because the balance sheet is sound and the business is still producing $42.1M of levered free cash flow TTM, yet the stock is already pricing in a cleaner recovery than the operating data justify. The 20.5% TTM revenue decline is the main reason I am not more constructive, and the 14.7x forward P/E leaves less margin for error than the recent volatility would suggest.
I would raise my rating more toward Buy if quarterly revenue can hold above $152.5M for two or more quarters and EBITDA stays near $25.7M, because that would show the second-quarter rebound is not just noise. If operating margin moves from 15.7% TTM toward 18% to 19%, meaning overhead is finally being absorbed more efficiently, that would strengthen the case that the mix shift is working and that the current valuation is too conservative.
I would move from Hold to Sell if revenue slips back below $130M for a quarter or if EBITDA falls back toward $13.2M, because that would tell me the recovery has not held. A second warning sign would be net debt to EBITDA moving back above 1.0x, since the current 0.7x level is one of the main reasons the stock remains investable despite weak growth.
For now, I think the bear case is more likely to show up first because the growth trend is still uneven and the shares already reflect a better outcome than the business has yet delivered. The balance sheet keeps this out of a Sell call, but I do not see enough evidence yet to pay up for a cleaner growth profile.
What to Watch Next
- Quarterly revenue above $152.5M — would support a move toward Buy.
- EBITDA near $25.7M — would confirm the Q2 rebound is durable.
- Operating margin above 15.7% and trending toward 18% to 19% — would show better overhead absorption.
- Net debt to EBITDA below 1.0x — would keep refinancing risk low.
- Revenue back below $130M — would argue the recovery has stalled.
What’s your take? I rated Power Solutions International (PSIX) HOLD above — but the goal here is to get this right, not just to publish an opinion. What would you add to this analysis, or which risk or catalyst do you think I’m under- or over-weighting? Tell me in the comments.
Our track record: every directional call is tracked publicly on The Scorecard, and Stocks Covered lists every company we have rated and when.
Sources
- SEC 10-K Annual Report — filed 2026-03-02
- SEC 8-K Filing (2026-05-13)
- SEC 8-K Filing (2026-05-11)
- SEC 8-K Filing (2026-03-13)
- SEC 8-K Filing (2026-03-11)
- SEC 8-K Filing (2026-03-02)
- SEC 8-K Filing (2026-03-02)
- SEC Form 4 Insider Transaction (2026-04-17)
- SEC Form 4 Insider Transaction (2026-04-17)
- SEC Form 4 Insider Transaction (2026-02-17)
- SEC 10-K Annual Report — FY2026
- SEC 10-K Annual Report — FY2025
- SEC 10-K Annual Report — FY2024
- SEC 10-K Annual Report — FY2023
- SEC 10-K Annual Report — FY2022
Data sourced from Yahoo Finance and SEC EDGAR. Not investment advice.
Leave a Comment