
Expected price range
Each range is set from the stock’s recent price history and our Hold rating, using its own 1-year realised volatility (64% annualised) as the width of a ~68% statistical band, and checked against that rating so the range leans the same way as our view. Starting price $46.81 (close 2026-10-27). The stock traded between $20.47 and $49.00 over the last 6 months and between $15.10 and $49.00 over the last year. This is an illustration of where our view and normal volatility point, not a forecast, price target or investment advice; the stock can move outside it.
| Company | Oct 25 | Nov 25 | Dec 25 | Jan 26 | Feb 26 | Mar 26 | Apr 26 | May 26 | Jun 26 | Jul 26 | Aug 26 | Sep 26 | 12-Mo |
|---|---|---|---|---|---|---|---|---|---|---|---|---|---|
| AMN | +2% | -15% | -5% | +35% | -9% | -6% | +12% | +42% | +12% | +4% | +2% | +5% | +85% |
| AVAH | +2% | +3% | -13% | +3% | -12% | -13% | +2% | +10% | +20% | +10% | +43% | -8% | +40% |
| ADUS | -1% | +3% | -11% | -4% | +0% | -10% | +3% | -5% | +10% | +15% | -1% | -4% | -6% |
| EVH | -21% | -37% | -5% | -20% | +1% | -30% | +64% | +5% | +37% | -43% | +46% | -22% | -59% |
| ALHC | -3% | +14% | +3% | +14% | -15% | -8% | +28% | -32% | +55% | -38% | -10% | -39% | -53% |
| LFST | -11% | +33% | +8% | +0% | +2% | -12% | +19% | +2% | +39% | -2% | +18% | -3% | +119% |
Source: Yahoo Finance monthly adjusted close.
Quick Thesis
- Rated Hold — cash generation is solid, but earnings remain too uneven for a cleaner call.
- Strongest support: 445.8M of levered free cash flow and a 13.0% FCF margin.
- Biggest risk: Kaiser concentration at 22.0% of 2025 revenue.
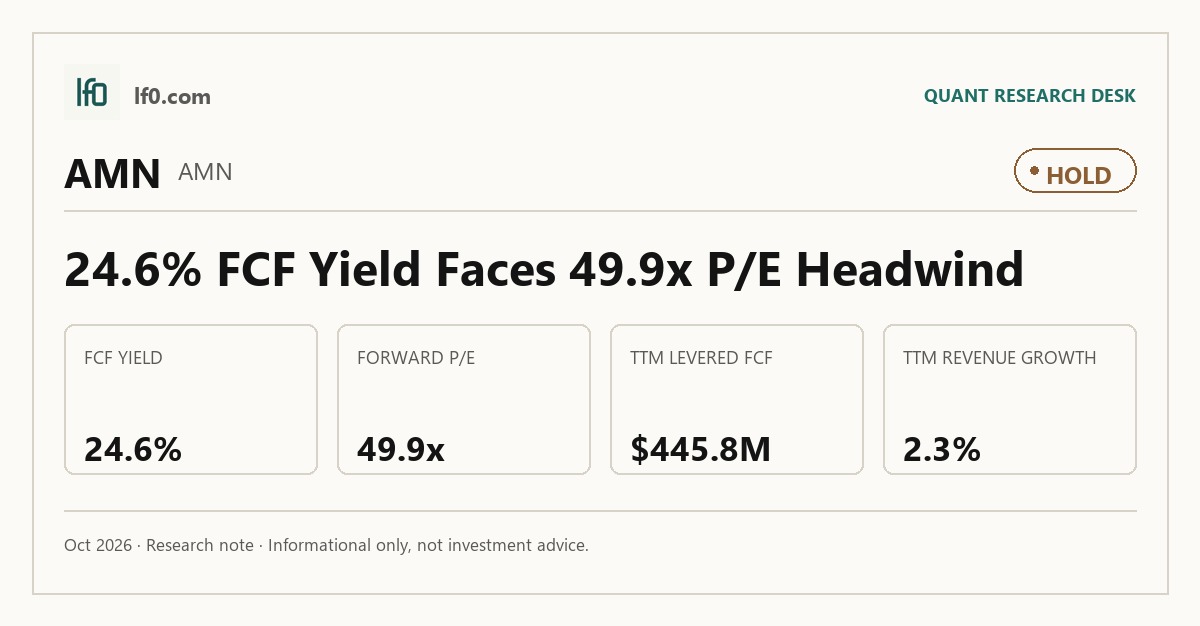
- Valuation is mixed: 0.67x EV/revenue looks reasonable, but 49.9x forward P/E is demanding.
- I would move more constructive if quarterly EBITDA stays above 150M for 2 to 3 quarters.
Executive Summary
Rating: HOLD | AMN
Measured from adjusted close on 2026-10-27 to 2026-10-27. Sell ratings are correct when the stock falls; Hold is tracked as a +/-10% range. Daily-close data, not intraday. Calls are tracked for 182 days from publication, then frozen as a final record.
I would put my rating as a Hold because AMN Healthcare Services has real cash generation, but the earnings base is still too volatile to justify paying for a clean recovery. In my view, the most important support is 445.8M of levered free cash flow and a 13.0% FCF margin, which tells me the business still converts revenue into cash even after interest and capex. The main risk is Kaiser Foundation Hospitals and its affiliates, which accounted for 22.0% of 2025 revenue and leaves the top line exposed to one account. I would raise my rating more towards a Buy if quarterly EBITDA stays above 150M for 2 to 3 quarters, because that would show the Q1 2026 level was not a one-off spike and would make the current valuation easier to defend.
Company Profile
AMN Healthcare Services, Inc. provides healthcare staffing and workforce management services in the United States. It earns revenue from temporary and permanent placement, managed services programs, vendor management systems, locum tenens, language interpretation, recruitment process outsourcing, interim leadership, and revenue cycle solutions. The company was founded in 1985 and went public in 2001. It has expanded from traditional staffing into a broader total talent solutions platform, including WorkWise, a healthcare technology platform launched in 2024, and ShiftWise Flex, its next-generation vendor management system.
AMN operates nationwide, with revenue in all 50 states and offices in Dallas, San Diego, Boca Raton, and Atlanta. It serves acute-care hospitals, physician groups, rehabilitation centers, schools, home health providers, and ambulatory surgery centers. As of December 31, 2025, it had 2,664 corporate team members and a large clinician network across nursing, allied health, leadership, and interpretation roles. The company is listed on Nasdaq under AMN and is financed with a mix of operating cash flow and corporate debt.
Economic Moat
Business Model
The most defensible advantage is AMN Healthcare’s integrated talent platform, which combines staffing, managed services programs, vendor management systems, language interpretation, recruitment process outsourcing, and workforce technology into one client relationship. In my view, a well-funded competitor would struggle to replicate that breadth, the cross-selling embedded in it, and the operating data that comes from managing all or part of a health system’s workforce within 3 years. That is reinforced by the scale of the network: in 2025, about 48% of consolidated revenue flowed through managed services relationships and about 3.3B of spend ran through managed services and vendor management programs, which tells me the model is already moving from transactional staffing toward a stickier workflow layer.
The digital stack is the secondary moat element. WorkWise, launched in 2024, brings staffing demand forecasting, predictive scheduling, and vendor management into one platform, while ShiftWise Flex and AMN Passport deepen clinician engagement; AMN Passport had more than 340,000 registered users as of January 2026, which matters because it lowers friction for clinicians and raises switching costs for clients that rely on that talent pool. I read that as a move toward a more durable, more recurring revenue mix, so the business is structurally stronger than five years ago because it now has more embedded client workflows and more ways to cross-sell beyond pure staffing.
Business & Operating Risks
Kaiser concentration is the clearest company-specific risk because Kaiser Foundation Hospitals and its affiliates comprised about 22.0% of consolidated revenue in 2025, so losing that account or even a meaningful share of it would hit revenue, operating results, and cash flow in a way that is already visible in the financial profile. The filing is explicit that if AMN were unable to provide a significant amount of services to Kaiser, whether directly or as a subcontractor, the impact could be material, and that risk is not hypothetical given the company’s managed services mix and the concentration already embedded in the top line.
The next most material risk is labor supply and credentialing, because AMN depends on recruiting and retaining enough qualified clinicians at reasonable cost while also matching and credentialing them quickly enough to meet client demand. The filing ties that directly to clinician burnout, an ongoing shortage of nurses and physicians, and the need to quickly and efficiently assist in obtaining licenses and privileges, which means any slippage raises wage costs, reduces fill rates, and can cause service failures. Technology and AI risk is more than boilerplate here because the company is explicitly relying on SaaS-based solutions, AMN Language Services, ShiftWise Flex, Medefis, b4health, and AMN Passport, while also saying that more tasks currently performed by people may continue to be replaced by automation, robotics, machine learning, AI, and other technological advances.
The disclosed risks do not threaten the moat itself so much as the economics of using it: the integrated platform still looks hard to copy, but concentration and labor-supply pressure can blunt the pricing power and utilization that make the moat valuable.
Management Discussion & Analysis
Management is actively responding to the concentration and execution risks mainly through liability management and portfolio simplification, but the core operating exposure remains in place. The clearest proof is the October 2025 issuance of $400M of 6.5% Senior Notes due 2031, paired with the redemption of the entire $500M of 4.6% Senior Notes due 2027 in the fourth quarter of 2025 and the use of proceeds, borrowings under the Senior Credit Facility, and cash from operations to fund that refinancing. That pushes the next major maturity wall out to 2031, which lowers near-term refinancing risk, but it also leaves the absolute debt load intact and adds a higher coupon, so this is liability management rather than deleveraging.
The July 1, 2025 sale of Smart Square, a healthcare scheduling software business, also fits that pattern: management is trimming a non-core asset, but the $(39.1) million gain on sale and $65.3M of proceeds show a balance-sheet and liquidity move more than a growth reinvestment. The narrative around strategic opportunities and market-leading efficiency is only partly supported by the numbers, because 2025 revenue fell to $2.7B in 2024 and gross margin slipped to 28.3% from 30.8%, which tells me the business is still fighting volume and pricing pressure even as management leans on technology and managed services to improve mix.
Management’s track record is mixed, which keeps credibility in the middle of the pack. In 2025, the company did deliver a lower DSO of 47 days versus 55 days in 2024, but it also recorded a $109.5M goodwill impairment in physician and leadership solutions and an $18.3M long-lived asset impairment, which means the asset base had to be written down even as the strategy was being presented as scalable. The tone has been more optimistic than the numbers justify for several years, because the company has repeatedly emphasized innovation and operating leverage while consolidated revenue fell from $5.2B in 2022 to $2.7B in 2025 and net income turned to a loss in 2025.
Recent Events
The most significant development I see here is the shareholder approval on May 1, 2026 of Amendment No. 1 to the AMN Healthcare 2025 Equity Plan, which gives management more flexibility to use equity compensation after the board had already cleared the change. That supports retention and hiring capacity, but it also raises dilution risk, so I view it as a modest help for execution rather than a clean positive for shareholders.
I also see a leadership transition on January 30, 2026, when R. Jeffrey Harris said he will retire from the board at the 2026 annual meeting, and the board nominated Eric Palmer, a former Cigna and Evernorth executive, to replace him. In my view, that is constructive for strategic oversight because Palmer brings healthcare services and insurance operating experience, but it also confirms the board is refreshing itself during a period when AMN needs sharper operating discipline.
The February 19, 2026 and May 7, 2026 8-Ks were routine quarterly earnings releases, and the January 14, 2026 filing was only a conference presentation. Taken together, recent 8-K disclosures leave the investment case materially unchanged, with governance and compensation actions helping execution at the margin but no new strategic catalyst.
Financial Analysis
Growth
AMN — Financial Growth (Quarterly, USD Mil)
| Metric | 2025-06-30 | 2025-09-30 | 2025-12-31 | 2026-03-31 | 2026-06-30 |
|---|---|---|---|---|---|
| REVENUE (USD Mil) | 658.2 | 634.5 | 748.2 | 1,378.4 | 673.2 |
| EBIT (USD Mil) | -123.7 | 47.6 | 8.1 | 117.2 | 26.9 |
| EBITDA (USD Mil) | -83.8 | 87.2 | 45.3 | 152.8 | 61 |
| NET INCOME (USD Mil) | -116.2 | 29.3 | -7.7 | 62.2 | 21.2 |
| DILUTED EPS | -3 | 0.8 | -0.2 | 1.6 | 0.5 |
Source: Yahoo Finance — Quarterly Financial Statements
AMN’s revenue moved from 658.2M in Q2 2025 to 634.5M in Q3 2025, then 748.2M in Q4 2025 and 1.4B in Q1 2026 before falling back to 673.2M in Q2 2026. The Q1 2026 spike is the outlier, and I would not extrapolate that run rate. EBITDA swung faster than revenue, from -83.8M in Q2 2025 to 87.2M in Q3 2025, 45.3M in Q4 2025, 152.8M in Q1 2026, and 61M in Q2 2026, which means earnings are more volatile than sales. That volatility matters because the moat only becomes valuable if the platform can turn recurring client relationships into steadier earnings, not just occasional spikes.
Profitability
AMN — Profitability (TTM)
| Metric | TTM |
|---|---|
| Operating Margin (TTM) | 4.0% |
| Net Margin (TTM) | 3.1% |
| Return on Assets (TTM) | 4.4% |
| Return on Equity (TTM) | 15.6% |
| Gross Margin (TTM) | 27.8% |
| EBITDA Margin (TTM) | 8.9% |
Source: Yahoo Finance — Trailing Twelve Months (TTM)
TTM gross margin was 27.8%, EBITDA margin was 9.0%, operating margin was 4.0%, and net margin was 3.1%. The spread from gross to operating margin is 23.8 percentage points, which tells me AMN still carries a heavy operating cost base relative to revenue, so the business is past the pure startup phase but not yet at full scale efficiency. EBITDA margin sits only 5.0 points above operating margin, which means depreciation and amortisation are not the main issue; the real question is how much more overhead can be absorbed as volumes normalize. ROA was 4.4% and ROE was 15.6%, so returns are positive, but the wide ROE versus ROA gap shows leverage is amplifying equity returns rather than the asset base itself generating exceptional profitability.
Valuation
AMN — Valuation Multiples
| Metric | Value |
|---|---|
| Current Share Price (USD) | 46.8 |
| Market Cap (USD Mil) | 1,813 |
| Enterprise Value (USD Mil) | 2,312 |
| Trailing P/E | 17.5 |
| Forward P/E | 49.9 |
| Price/Sales (TTM) | 0.5 |
| Price/Book (mrq) | 2.4 |
| EV/Revenue | 0.7 |
| EV/EBITDA | 7.5 |
| Beta (5Y Monthly) | 0.40 |
| FCF Yield % (TTM) | 24.6% |
| Forward EPS (USD) | 0.9 |
| Analyst Target Price – Low (USD) | 28 |
| Analyst Target Price – Mean (USD) | 36.6 |
| Analyst Target Price – High (USD) | 43 |
| # Analyst Opinions | 7 |
Source: Yahoo Finance
AMN Healthcare Services trades at 0.67x enterprise value to revenue and 0.53x price to sales on TTM results, with a current share price of 46.8. That is the cleanest read because trailing earnings are distorted by a TTM net margin of 3.1%, so the market is valuing the business mainly on revenue and cash conversion rather than earnings power. The 0.67x EV/revenue multiple implies investors are pricing in either a continued earnings recovery toward normalized profitability or a low-growth, low-margin staffing profile that keeps revenue quality under pressure.
The rest of the stack is mixed. Trailing P/E is 17.5x, but forward P/E jumps to 49.9x on forward EPS of 0.939, which signals the market is not yet giving full credit to a durable earnings rebound. EV/EBITDA is 7.52x, FCF yield is 24.6%, and PEG is 1.22x, which together say the stock is not expensive if free cash flow holds. Price/book is 2.44x against book value per share of 19.15, so buyers are paying about 2.4 times accounting equity for a business with 9.343 of cash per share. On the analysis here, I would put fair value in a range of roughly $35-$45, which sits around the analyst mean of 36.6 and below the high target of 43; that tells me the market is already discounting a recovery, but not one strong enough to justify a premium to consensus. The implied earnings path is also important: a 0.939 forward EPS on a 46.8 share price is rich relative to peers with stronger growth, so AMN needs margin improvement rather than just revenue stability to close the gap.
Leverage
AMN — Leverage & Coverage (Quarterly)
| Metric | Value |
|---|---|
| Total Debt/Equity % (mrq) | 104.7 |
| Current Ratio (mrq) | 1.1 |
| Total Debt (mrq, USD Mil) | 775.8 |
| Operating Cash Flow (TTM, USD Mil) | 470.8 |
| Levered Free Cash Flow (TTM, USD Mil) | 445.8 |
| Net Debt/EBITDA (TTM) | 1.3 |
| FCF Margin % (TTM) | 13.0% |
Source: Yahoo Finance — Quarterly Financial Statements
AMN’s leverage is manageable but not a cushion. Total debt/equity was 104.7%, current ratio was 1.128, and total debt was 775.8M, so the balance sheet is levered but not stretched into an immediate liquidity event. Operating cash flow was 470.8M and levered free cash flow was 445.8M, which shows solid cash generation and limited cash leakage after interest and capex. Net debt/EBITDA was 1.3x and FCF margin was 13.0%, so EBITDA is converting into cash at a healthy rate.
In my opinion, this is medium refinancing risk because the current ratio gives near-term flexibility, but the debt load still needs continued cash generation to stay comfortable if rates rise or if earnings soften. The key near-term watchpoint is whether cash flow stays near the current TTM level; if it slips materially, the cushion narrows quickly. The leverage profile also ties back to valuation: a 24.6% FCF yield looks attractive, but that yield matters less if earnings volatility forces management to keep prioritizing debt service over reinvestment.
Insider Activity
The insider transaction record I see here shows no open-market purchases or sales in the 2025-01-15 to 2026-05-01 window, so insiders were neither net buyers nor net sellers on a market-price basis. Activity is concentrated in option exercises and tax withholding across several directors and executives, which is neutral and does not signal a change in alignment. This is a neutral signal because there is no open-market buying or selling to read as a deliberate vote of confidence or caution.
Comparable Analysis
LF0 has published standalone analyses of these peers: Aveanna Healthcare (AVAH) (rated Hold); Addus HomeCare (ADUS) (rated Hold); Evolent Health (EVH) (rated Strong Sell); Alignment Healthcare (ALHC) (rated Hold); LifeStance Health (LFST) (rated Hold).
Growth
| Company | Revenue TTM (USD Mil) | Revenue Growth YoY % | EBITDA TTM (USD Mil) | Diluted EPS TTM |
|---|---|---|---|---|
| AMN | 3,434.3 | 2.3% | 307.3 | 2.7 |
| AVAH | 2,602.8 | 13.7% | 311.2 | 1.3 |
| ADUS | 1,476.4 | 8.0% | 160.5 | 5.7 |
| EVH | 2,097 | 46.9% | 61 | -4.5 |
| ALHC | 4,577.3 | 31.6% | 87.4 | 0.2 |
| LFST | 1,584.8 | 26.1% | 135 | 0.1 |
Source: Yahoo Finance
Growth is strongest at EVH, which posted 46.9% revenue growth in TTM, then ALHC at 31.6% and LFST at 26.1%, while AMN grew only 2.3% on $3.4B of TTM revenue. That gap says AMN is the slowest grower in the set, so its valuation cannot be justified on growth alone; the only support is that its earnings base is already large and more stable than the faster growers.
Valuation
| Company | Current Share Price (USD) | Trailing P/E | Forward P/E | EV/Revenue | EV/EBITDA | Price/Sales (TTM) | Price/Book (mrq) | Market Cap (USD Mil) | Enterprise Value (USD Mil) | Beta (5Y Monthly) | FCF Yield % (TTM) | Forward EPS | Analyst Target Price – Low | Analyst Target Price – Mean | Analyst Target Price – High | # Analyst Opinions |
|---|---|---|---|---|---|---|---|---|---|---|---|---|---|---|---|---|
| AMN | 46.8 | 17.5 | 49.9 | 0.7 | 7.5 | 0.5 | 2.4 | 1,813 | 2,312 | 0.40 | 24.6% | 0.9 | 28 | 36.6 | 43 | 7 |
| AVAH | 12.7 | 10.1 | 14 | 1.6 | 13.7 | 1.1 | 9.6 | 2,772 | 4,272 | 1.95 | 3.7% | 0.9 | 13 | 15.1 | 16 | 10 |
| ADUS | 121.2 | 21.2 | 16.1 | 1.5 | 13.9 | 1.5 | 1.9 | 2,263 | 2,226 | 0.83 | 5.1% | 7.5 | 96 | 134.1 | 155 | 13 |
| EVH | 4.4 | — | 10.9 | 0.7 | 22.4 | 0.2 | 1.3 | 500 | 1,367 | 1.02 | 25.4% | 0.4 | 3 | 5.8 | 8 | 12 |
| ALHC | 8.1 | 42.4 | 12.4 | 0.3 | 14.5 | 0.4 | 6.3 | 1,670 | 1,265 | 1.14 | 11.3% | 0.7 | 9 | 12.3 | 26 | 13 |
| LFST | 13.1 | 100.8 | 30.4 | 3.3 | 38.8 | 3.1 | 3.4 | 4,980 | 5,238 | 1.24 | 3.5% | 0.4 | 12 | 14.4 | 18 | 10 |
Source: Yahoo Finance
Valuation is where AMN looks best on a cash basis: its FCF yield is 24.6% TTM, ahead of ALHC at 11.3%, ADUS at 5.1%, LFST at 3.5%, and AVAH at 3.7%. On EV/revenue, AMN trades at 0.67x versus EVH at 0.7x, ALHC at 0.3x, ADUS at 1.5x, AVAH at 1.6x, and LFST at 3.3x, so the market is paying a low multiple for AMN’s cash generation rather than for growth. Using the peer EV/revenue range of 0.3x to 3.3x on AMN’s $3.4B revenue gives a very wide implied enterprise value range, which tells me the peer set is too mixed to anchor a precise target; AMN’s current price sits below the richer growth names, but the market is still paying for a recovery that has not shown up in earnings. That is why I think the valuation premium is really a cash-flow premium, not a growth premium.
Profitability
| Company | Operating Margin (TTM) | Net Margin (TTM) | Return on Assets (TTM) | Return on Equity (TTM) | Gross Margin (TTM) | EBITDA Margin (TTM) |
|---|---|---|---|---|---|---|
| AMN | 4.0% | 3.1% | 4.4% | 15.6% | 27.8% | 8.9% |
| AVAH | 12.6% | 10.6% | 9.7% | 198.6% | 32.0% | 12.0% |
| ADUS | 9.7% | 7.1% | 6.3% | 9.7% | 32.0% | 10.9% |
| EVH | -1.3% | -24.1% | -0.8% | -67.0% | 17.2% | 2.9% |
| ALHC | 3.2% | 0.9% | 3.1% | 20.0% | 12.6% | 1.9% |
| LFST | 7.2% | 3.2% | 2.3% | 3.4% | 33.6% | 8.5% |
Source: Yahoo Finance
Profitability is mixed but not weak: AMN’s gross margin of 27.8% is below ADUS at 32.0% and LFST at 33.6%, while its operating margin of 4.0% and EBITDA margin of 9.0% are also below ADUS at 9.7% and 10.9%, but above EVH’s -1.3% operating margin and 2.9% EBITDA margin. The gap looks more like a scale and mix issue than a pure cost-of-revenue problem, because AMN’s gross margin is not dramatically worse than the better peers, yet opex still leaves it with thinner operating profit than ADUS and LFST. ROE of 15.6% is respectable, but it is not enough to offset the fact that the company is still behind the better-margin peers on operating efficiency.
Leverage
| Company | Total Debt/Equity % (mrq) | Current Ratio (mrq) | Total Debt (mrq, USD Mil) | Operating Cash Flow TTM (USD Mil) | Free Cash Flow TTM (USD Mil) | Net Debt/EBITDA (TTM) | FCF Margin % (TTM) |
|---|---|---|---|---|---|---|---|
| AMN | 104.7 | 1.1 | 775.8 | 470.8 | 445.8 | 1.3 | 13.0% |
| AVAH | 522.7 | 1.2 | 1,505.3 | 168.2 | 103.8 | 4.5 | 4.0% |
| ADUS | 9.5 | 1.7 | 108.8 | 162.4 | 116.2 | 0.1 | 7.9% |
| EVH | 253.2 | 1.2 | 970.4 | 54.3 | 126.8 | 14 | 6.0% |
| ALHC | 124.7 | 1.7 | 330.5 | 205.6 | 188.6 | -4.2 | 4.1% |
| LFST | 32.1 | 1.4 | 474.1 | 217.9 | 172.4 | 1.8 | 10.9% |
Source: Yahoo Finance
Leverage is moderate and clearly better than the more levered peers: AMN’s debt/equity is 104.7% and net debt/EBITDA is 1.3x, versus AVAH at 522.7% and 4.5x, EVH at 253.2% and 14.0x, and LFST at 32.1% and 1.8x. AMN’s FCF margin of 13.0% is also far stronger than AVAH’s 4.0% and LFST’s 10.9%, which means the balance sheet is not the constraint here; capital structure is manageable and supports the equity case. In other words, AMN does not need the market to reward it for balance-sheet safety the way it might for a more levered peer, but it also does not have the leverage-driven upside that can make a weaker operator look cheap.
Conclusion
I would put my rating as a Hold because AMN Healthcare Services combines a 24.6% free cash flow yield with a 49.9x forward P/E, so the market is paying for a recovery that is not yet visible in the operating line. The strongest support is 445.8M of levered free cash flow, which tells me the business still converts revenue into cash even after interest and capital spending. The biggest risk is Kaiser Foundation Hospitals and its affiliates at 22.0% of 2025 revenue, because that concentration can move results quickly if the account weakens. AMN Healthcare Services stock analysis therefore lands in the middle for me: cash generation is real, but the earnings base is still too uneven to call it cheap.
The bull case is straightforward. If quarterly EBITDA stays above 150M for 2 to 3 quarters, roughly the Q1 2026 level, I would move more constructively because that would show the margin reset is durable rather than a one-quarter spike. If operating margin also moves from 4.0% toward 6.0%, that would add roughly $70M of annual operating profit on the current revenue base and would make debt service and reinvestment easier to balance. The bear case is just as clear: if EBITDA falls back toward the 45M to 60M range seen in late 2025 and revenue growth stays in the low single digits, the 49.9x forward P/E would look increasingly exposed. I would also watch Kaiser concentration closely; a move above 22.0% of revenue would make the top line more dependent on one account at the same time earnings visibility is weak.
Weighing both paths, I think the market is already giving AMN credit for a rebound that has not yet proved durable. The cash generation and leverage profile keep downside contained, but the stock needs a cleaner earnings pattern before I would move off Hold in either direction.
What to Watch Next
- Quarterly EBITDA above 150M — would support moving the rating toward Buy.
- Operating margin near 6.0% — would show the earnings base is becoming more durable.
- EBITDA back in the 45M to 60M range — would argue the recovery is not sticking.
- Kaiser concentration above 22.0% of revenue — would increase single-account risk.
- Revenue growth staying in the low single digits — would keep the forward P/E hard to justify.
What’s your take? I rated AMN Healthcare (AMN) HOLD above — but the goal here is to get this right, not just to publish an opinion. What would you add to this analysis, or which risk or catalyst do you think I’m under- or over-weighting? Tell me in the comments.
Our track record: every directional call is tracked publicly on The Scorecard, and Stocks Covered lists every company we have rated and when.
Sources
- SEC 10-K Annual Report — filed 2026-02-20
- SEC 8-K Filing (2026-05-07)
- SEC 8-K Filing (2026-05-04)
- SEC 8-K Filing (2026-02-19)
- SEC 8-K Filing (2026-02-05)
- SEC 8-K Filing (2026-01-14)
- SEC Form 4 Insider Transaction (2026-05-04)
- SEC Form 4 Insider Transaction (2026-05-04)
- SEC Form 4 Insider Transaction (2026-05-04)
- SEC 10-K Annual Report — FY2026
- SEC 10-K Annual Report — FY2025
- SEC 10-K Annual Report — FY2024
- SEC 10-K Annual Report — FY2023
- SEC 10-K Annual Report — FY2022
Data sourced from Yahoo Finance and SEC EDGAR. Not investment advice.
Leave a Comment