
Expected price range
Each range is set from the stock’s recent price history and our Strong Sell rating, using its own 1-year realised volatility (80% annualised) as the width of a ~68% statistical band, and checked against that rating so the range leans the same way as our view. Starting price $4.41 (close 2026-10-27). The stock traded between $3.08 and $6.19 over the last 6 months and between $2.17 and $7.41 over the last year. This is an illustration of where our view and normal volatility point, not a forecast, price target or investment advice; the stock can move outside it.
| Company | Oct 25 | Nov 25 | Dec 25 | Jan 26 | Feb 26 | Mar 26 | Apr 26 | May 26 | Jun 26 | Jul 26 | Aug 26 | Sep 26 | 12-Mo |
|---|---|---|---|---|---|---|---|---|---|---|---|---|---|
| EVH | -21% | -37% | -5% | -20% | +1% | -30% | +64% | +5% | +37% | -43% | +46% | -22% | -59% |
| AVAH | +2% | +3% | -13% | +3% | -12% | -13% | +2% | +10% | +20% | +10% | +43% | -8% | +40% |
| ADUS | -1% | +3% | -11% | -4% | +0% | -10% | +3% | -5% | +10% | +15% | -1% | -4% | -6% |
| ALHC | -3% | +14% | +3% | +14% | -15% | -8% | +28% | -32% | +55% | -38% | -10% | -39% | -53% |
| LFST | -11% | +33% | +8% | +0% | +2% | -12% | +19% | +2% | +39% | -2% | +18% | -3% | +119% |
| AMN | +2% | -15% | -5% | +35% | -9% | -6% | +12% | +42% | +12% | +4% | +2% | +5% | +85% |
Source: Yahoo Finance monthly adjusted close.
Quick Thesis
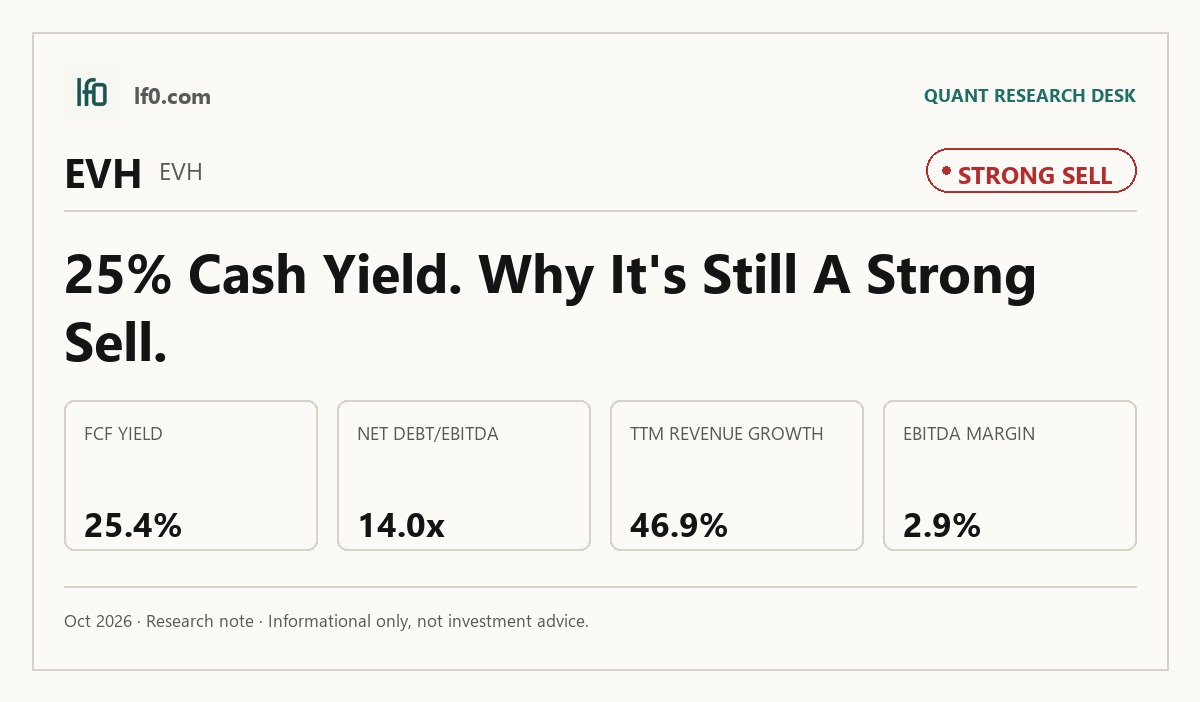
- Rated Strong Sell — leverage is too high for the current earnings quality.
- Best strength: 25.4% FCF yield, supported by $126.9M of levered free cash flow.
- Biggest risk: 14.0x net debt/EBITDA, with $970.4M of debt.
- Valuation is cheap on cash flow but not on risk: 22.4x EV/EBITDA and 0.652x EV/revenue.
- I would only turn more constructive if operating margin turns positive and leverage falls below 10.0x, meaning debt is moving back into a financeable range.
Executive Summary
Rating: STRONG SELL | EVH
Measured from adjusted close on 2026-10-27 to 2026-10-27. Sell ratings are correct when the stock falls; Hold is tracked as a +/-10% range. Daily-close data, not intraday. Calls are tracked for 182 days from publication, then frozen as a final record.
I would put my rating as a Strong Sell because the company’s cash generation is not enough to offset a 14.0x net debt/EBITDA load and negative operating margin. The business did post 46.9% TTM revenue growth, but that growth has not yet translated into durable earnings, and in my view the market is still paying for scale before it has proof of self-funding profitability. The clearest support for the stock is the 25.4% FCF yield, which is real, but I do not think it compensates for the balance-sheet risk and the weak margin profile. I would move toward a Sell (a less bearish view) only if net debt/EBITDA falls well below the current 14.0x and operating margin turns positive, because that would show the strong cash generation is strengthening the balance sheet rather than just servicing it.
Company Profile
Evolent Health provides specialty care management and administrative services for health plans and other risk-bearing entities, with revenue mainly tied to fixed fees per member per month and, in some cases, per-case and capitation arrangements. Its specialty platform covers oncology, cardiology, musculoskeletal care, radiology, and genetics, while Identifi®, its proprietary value-based care system, supports health plan operations, analytics, and risk management. The company was founded in 2011, went public in 2015, and now operates across the United States with about 4,200 employees. Substantially all operations run through Evolent Health LLC, and the portfolio is now narrower after the sale of Evolent Care Partners in December 2025.
Economic Moat
Business Model
I think the moat here rests on the combination of clinical workflow, proprietary technology, and specialist network relationships rather than on software alone. According to their SEC filings, the core specialty care management service combines evidence-based clinical pathways, CarePro technology, and direct specialist networks, which makes the platform harder to replicate than a standalone prior-authorization tool. Identifi® adds a second layer by embedding the software into recurring administrative and value-based care operations, so a competitor would need to rebuild both the clinical engine and the operating relationships at the same time.
The portfolio has also become more focused over time. New Century Health gave the company its specialty-care base, later acquisitions broadened the platform into radiology, musculoskeletal care, physical medicine, and genetics, and the Machinify assets added automation to prior authorization. After the Evolent Care Partners divestiture, the business is more concentrated on specialty care management and administrative services, which in my view strengthens the moat because management can spend more capital and attention on the areas where it has the deepest operating know-how.
Business & Operating Risks
The main disclosed risks are customer concentration, contract renegotiation, and regulatory scrutiny. Molina, Cook County Health and Hospitals System, Florida Blue, and Centene Corporation accounted for 25.7%, 16.4%, 14.2%, and 12.2% of 2025 revenue, so the loss of even one relationship would hit a concentrated revenue base. Those contracts can be terminated for convenience after notice or cut back through reprocurement, and the Performance Suite structure can also require refunds if service levels are missed, which means the company can lose revenue even without a full customer exit.
The Department of Justice Civil Investigative Demand is the most serious overhang because it reaches back to Medicare Advantage diagnosis coding and remains unresolved. I do not think these risks break the moat itself, but they do threaten the managed-service advantage by showing that the company’s embedded position can still be pressured by customer churn, service-level claims, and regulatory review.
Management Discussion & Analysis
Management is responding to those risks, but only partly. The 2025 refinancing and asset-sale activity pushed out maturities and simplified the portfolio, yet it also raised interest expense and left leverage elevated, so the response has been defensive rather than transformative. In my view, that is the right first step, but it does not yet solve the concentration and margin pressure that the filing highlights.
The capital structure actions were substantial: the company issued 2031 notes, repurchased 2025 notes, exchanged preferred stock for a second-lien term loan, and used divestiture proceeds to repay debt. That sequence tells me management is prioritizing liquidity and maturity management over balance-sheet repair, which is sensible in the near term but still leaves the equity exposed if operating performance does not improve. The 2025 goodwill impairment also tells me the company has not yet proven to me that acquisition-led expansion is automatically creating value.
Recent Events
The May 7, 2026 earnings release was routine and did not change the structural thesis. It confirmed that the company remains in normal reporting cadence, but it did not bring a new strategic catalyst, financing event, or operating reset.
The June 4, 2026 annual meeting was more relevant for governance than for operations. Stockholders elected the board, ratified Deloitte & Touche LLP as auditor for FY2026, approved named executive officer pay, and approved an amendment to the 2015 Omnibus Incentive Compensation Plan. I see that as neutral to slightly supportive for continuity, although the equity compensation approval keeps dilution on the table.
Financial Analysis
Growth
EVH — Financial Growth (Quarterly, USD Mil)
| Metric | 2025-06-30 | 2025-09-30 | 2025-12-31 | 2026-03-31 | 2026-06-30 |
|---|---|---|---|---|---|
| REVENUE (USD Mil) | 444.3 | 479.5 | 468.7 | 496.2 | 652.5 |
| EBIT (USD Mil) | -10.4 | -5.8 | -407 | -8.9 | -11.8 |
| EBITDA (USD Mil) | 12.8 | 17.8 | -362 | 12.7 | 9.8 |
| NET INCOME (USD Mil) | -19.9 | -20.9 | -429.1 | -26.6 | -28.4 |
| DILUTED EPS | -0.4 | -0.2 | -3.8 | -0.2 | -0.2 |
Source: Yahoo Finance — Quarterly Financial Statements
Revenue rose from $444.3M in Q2 2025 to $652.5M in Q2 2026, a 46.9% increase, and that is the clearest sign that the platform is still gaining scale. The more important point, though, is that EBITDA fell to $9.8M in Q2 2026 from $12.8M a year earlier, so the top line is growing faster than earnings and the moat is not yet showing up as operating leverage. That gap matters because a specialty-services model only becomes durable when growth starts to fund overhead instead of just adding volume.
The Q4 2025 EBITDA loss of $362M was the outlier in the period, and the filing’s $398.0 million goodwill impairment is the cleaner explanation than any simple operating slowdown. I do not read that quarter as a normal run-rate signal, but it does show how quickly acquisition accounting and portfolio changes can distort the earnings base.
Profitability
EVH — Profitability (TTM)
| Metric | TTM |
|---|---|
| Operating Margin (TTM) | -1.3% |
| Net Margin (TTM) | -24.1% |
| Return on Assets (TTM) | -0.8% |
| Return on Equity (TTM) | -67.0% |
| Gross Margin (TTM) | 17.2% |
| EBITDA Margin (TTM) | 2.9% |
Source: Yahoo Finance — Trailing Twelve Months (TTM)
TTM gross margin was 17.2%, EBITDA margin was 2.91%, operating margin was -1.34%, and net margin was -24.1%. The spread between gross margin and operating margin tells me the problem is not just service cost; overhead is still too heavy for the current revenue base. That is why the business can show positive EBITDA and still fail to produce acceptable operating earnings.
Returns are still weak. Return on assets was -0.785% and return on equity was -67%, which means the company is not yet earning its cost of capital and leverage is amplifying the loss to equity holders. I would want to see operating margin turn positive before I treat the current revenue growth as evidence of a durable earnings model.
Valuation
EVH — Valuation Multiples
| Metric | Value |
|---|---|
| Current Share Price (USD) | 4.4 |
| Market Cap (USD Mil) | 499 |
| Enterprise Value (USD Mil) | 1,367 |
| Forward P/E | 10.9 |
| Price/Sales (TTM) | 0.2 |
| Price/Book (mrq) | 1.3 |
| EV/Revenue | 0.7 |
| EV/EBITDA | 22.4 |
| Beta (5Y Monthly) | 1.02 |
| FCF Yield % (TTM) | 25.4% |
| Forward EPS (USD) | 0.4 |
| Analyst Target Price – Low (USD) | 3 |
| Analyst Target Price – Mean (USD) | 5.8 |
| Analyst Target Price – High (USD) | 8 |
| # Analyst Opinions | 12 |
Source: Yahoo Finance
EVH trades at 0.652x EV/revenue, 0.238x price/sales, 22.4x EV/EBITDA, and 10.9x forward P/E, with a 25.4% FCF yield and a 1.3x price/book multiple. On cash generation alone, that looks inexpensive, but the 14.0x net debt/EBITDA and 253.2% debt/equity make the equity look cheaper than it really is because the capital structure is doing part of the work. In my view, the market is paying for cash flow, not for balance-sheet safety.
I would put fair value in a range of roughly $4.00–$6.00 per share, which is close to the current price and below the $5.75 analyst mean. That range sits inside the analyst target band of $3.00–$8.00, so I am not fighting consensus outright; I am simply weighting leverage and margin risk more heavily than the average analyst appears to. On earnings, the 0.404 forward EPS implies a modest multiple, but compared with peers it is not obviously cheap once you adjust for EVH’s weaker profitability and much higher leverage.
Leverage
EVH — Leverage & Coverage (Quarterly)
| Metric | Value |
|---|---|
| Total Debt/Equity % (mrq) | 253.2 |
| Current Ratio (mrq) | 1.2 |
| Total Debt (mrq, USD Mil) | 970.4 |
| Net Debt/EBITDA (TTM) | 14 |
| FCF Margin % (TTM) | 6.0% |
Source: Yahoo Finance — Quarterly Financial Statements
Total debt/equity was 253.2%, current ratio was 1.239, total debt was $970.4M, operating cash flow was $54.32M, levered free cash flow was $126.9M, net debt/EBITDA was 14.0x, and FCF margin was 6.05%. The positive cash flow is helpful, but it does not neutralize the leverage load because the debt stack is still large relative to EBITDA and equity. In practical terms, the company has enough liquidity to keep operating, but not enough balance-sheet flexibility to absorb a meaningful earnings miss without pressure on refinancing terms.
Insider Activity
The insider record shows open-market buying rather than selling, with multiple directors participating in March 2025 purchases. I view that as a modest confidence signal, but it is not strong enough to outweigh the leverage and profitability issues already visible in the financials. Insider buying helps at the margin; it does not fix a 14.0x net debt/EBITDA profile.
Comparable Analysis
LF0 has published standalone analyses of these peers: Aveanna Healthcare (AVAH) (rated Hold); Addus HomeCare (ADUS) (rated Hold).
Growth
| Company | Revenue TTM (USD Mil) | Revenue Growth YoY % | Diluted EPS TTM |
|---|---|---|---|
| EVH | 2,097 | 46.9% | -4.5 |
| AVAH | 2,602.8 | 13.7% | 1.3 |
| ADUS | 1,476.4 | 8.0% | 5.7 |
| ALHC | 4,577.3 | 31.6% | 0.2 |
| LFST | 1,584.8 | 26.1% | 0.1 |
| AMN | 3,434.3 | 2.3% | 2.7 |
Source: Yahoo Finance
EVH’s 46.9% revenue growth is the fastest in the peer set, ahead of ALHC at 31.6%, LFST at 26.1%, AVAH at 13.7%, ADUS at 8.0%, and AMN at 2.3%. The problem is that EVH’s TTM diluted EPS is -4.5, while every named peer is positive, so the market is not rewarding growth alone. I think that is the right read: EVH is growing faster, but it has not yet converted that growth into earnings.
Valuation
| Company | Current Share Price (USD) | Trailing P/E | Forward P/E | EV/Revenue | EV/EBITDA | Price/Sales (TTM) | Price/Book (mrq) | Market Cap (USD Mil) | Enterprise Value (USD Mil) | Beta (5Y Monthly) | FCF Yield % (TTM) | Forward EPS | Analyst Target Price – Low | Analyst Target Price – Mean | Analyst Target Price – High | # Analyst Opinions |
|---|---|---|---|---|---|---|---|---|---|---|---|---|---|---|---|---|
| EVH | 4.4 | — | 10.9 | 0.7 | 22.4 | 0.2 | 1.3 | 499 | 1,367 | 1.02 | 25.4% | 0.4 | 3 | 5.8 | 8 | 12 |
| AVAH | 12.7 | 10.1 | 14 | 1.6 | 13.7 | 1.1 | 9.6 | 2,772 | 4,272 | 1.95 | 3.7% | 0.9 | 13 | 15.1 | 16 | 10 |
| ADUS | 121.2 | 21.2 | 16.1 | 1.5 | 13.9 | 1.5 | 1.9 | 2,263 | 2,226 | 0.83 | 5.1% | 7.5 | 96 | 134.1 | 155 | 13 |
| ALHC | 8.1 | 42.4 | 12.4 | 0.3 | 14.5 | 0.4 | 6.3 | 1,670 | 1,265 | 1.14 | 11.3% | 0.7 | 9 | 12.3 | 26 | 13 |
| LFST | 13.1 | 100.8 | 30.4 | 3.3 | 38.8 | 3.1 | 3.4 | 4,980 | 5,238 | 1.24 | 3.5% | 0.4 | 12 | 14.4 | 18 | 10 |
| AMN | 46.8 | 17.4 | 49.8 | 0.7 | 7.5 | 0.5 | 2.4 | 1,811 | 2,312 | 0.40 | 24.6% | 0.9 | 28 | 36.6 | 43 | 7 |
Source: Yahoo Finance
EVH trades at 0.652x EV/revenue and 22.4x EV/EBITDA, versus AVAH at 1.6x and 13.7x, ADUS at 1.5x and 13.9x, ALHC at 0.3x and 14.5x, LFST at 3.3x and 38.8x, and AMN at 0.7x and 7.5x. On a pure multiple basis, EVH looks inexpensive on revenue and expensive on EBITDA, which is exactly what I would expect when leverage is high and margins are weak. The 25.4% FCF yield is the strongest bull case in the group, but it is also the most balance-sheet-sensitive.
Using peer EV/revenue multiples, I would put EVH’s implied enterprise value in a wide range because the market is still split between a low-quality services multiple and a more normal healthcare-services multiple. That range is less useful as a precise target than as a signal that EVH’s valuation depends heavily on whether margins improve faster than leverage falls. Relative to peers, the stock looks cheaper on cash flow than on earnings quality.
Profitability
| Company | Operating Margin (TTM) | Net Margin (TTM) | Return on Assets (TTM) | Return on Equity (TTM) | Gross Margin (TTM) | EBITDA Margin (TTM) |
|---|---|---|---|---|---|---|
| EVH | -1.3% | -24.1% | -0.8% | -67.0% | 17.2% | 2.9% |
| AVAH | 12.6% | 10.6% | 9.7% | 198.6% | 32.0% | 12.0% |
| ADUS | 9.7% | 7.1% | 6.3% | 9.7% | 32.0% | 10.9% |
| ALHC | 3.2% | 0.9% | 3.1% | 20.0% | 12.6% | 1.9% |
| LFST | 7.2% | 3.2% | 2.3% | 3.4% | 33.6% | 8.5% |
| AMN | 4.0% | 3.1% | 4.4% | 15.6% | 27.8% | 8.9% |
Source: Yahoo Finance
EVH’s operating margin of -1.34%, net margin of -24.1%, gross margin of 17.2%, and EBITDA margin of 2.91% trail AVAH, ADUS, LFST, and AMN by a wide margin, while ALHC is also materially better on every line. The key issue is not just that EVH is below peers; it is that the margin gap is broad enough to suggest the company is still paying for scale rather than harvesting it. That is why I do not think the current revenue growth deserves a premium multiple.
Leverage
| Company | Total Debt/Equity % (mrq) | Current Ratio (mrq) | Total Debt (mrq, USD Mil) | Operating Cash Flow TTM (USD Mil) | Free Cash Flow TTM (USD Mil) | Net Debt/EBITDA (TTM) | FCF Margin % (TTM) |
|---|---|---|---|---|---|---|---|
| EVH | 253.2 | 1.2 | 970.4 | 54.3 | 126.8 | 14 | 6.0% |
| AVAH | 522.7 | 1.2 | 1,505.3 | 168.2 | 103.8 | 4.5 | 4.0% |
| ADUS | 9.5 | 1.7 | 108.8 | 162.4 | 116.2 | 0.1 | 7.9% |
| ALHC | 124.7 | 1.7 | 330.5 | 205.6 | 188.6 | -4.2 | 4.1% |
| LFST | 32.1 | 1.4 | 474.1 | 217.9 | 172.4 | 1.8 | 10.9% |
| AMN | 104.7 | 1.1 | 775.8 | 470.8 | 445.8 | 1.3 | 13.0% |
Source: Yahoo Finance
EVH’s 253.2% debt/equity and 14.0x net debt/EBITDA are far above ADUS at 9.5% and 0.1x, LFST at 32.1% and 1.8x, AMN at 104.7% and 1.3x, and AVAH at 522.7% and 4.5x. EVH’s 1.239 current ratio is only average, so the company does not have the liquidity cushion that would normally justify this level of leverage. In my view, that is why the stock trades like a cash-flow name rather than a quality compounder: the market is discounting the balance sheet as much as it is valuing the business.
Conclusion
I would put my rating as a Strong Sell because the company’s growth is still outrunning its earnings quality, and the balance sheet leaves too little room for disappointment. The key tension is that revenue growth is real, but the 14.0x net debt/EBITDA load means the equity needs margin repair to matter, not just more scale.
If I were to turn more constructive, I would need to see operating margin move into positive territory and stay there for two straight quarters, because that would show the specialty platform is finally absorbing overhead rather than just adding revenue. I would also want net debt/EBITDA below 10.0x, which would mean leverage is moving back into a financeable range and the company is no longer relying on refinancing discipline alone. If free cash flow margin were to slip below 4.0%, that would be a clear warning that the cash cushion is shrinking and the equity story is getting more fragile.
For now, I think the bull case is more likely to show up in the numbers before the bear case does, but not quickly enough to justify owning the stock. The business has enough growth to avoid a collapse thesis, yet the margin gap and leverage are still too wide for me to treat the current valuation as a bargain.
What to Watch Next
- Operating margin turning positive for two straight quarters — would support a move toward Buy.
- Net debt/EBITDA falling below 10.0x — would show leverage is moving into a safer range.
- Free cash flow margin staying above 6.0% — would support the current cash-yield case.
- Revenue growth staying above 30% while EBITDA rises — would show growth is starting to convert into earnings.
- Free cash flow margin dropping below 4.0% — would make the balance-sheet risk more acute.
What’s your take? I rated Evolent Health (EVH) STRONG SELL above — but the goal here is to get this right, not just to publish an opinion. What would you add to this analysis, or which risk or catalyst do you think I’m under- or over-weighting? Tell me in the comments.
Our track record: every directional call is tracked publicly on The Scorecard, and Stocks Covered lists every company we have rated and when.
Sources
- SEC 10-K Annual Report — filed 2026-02-25
- SEC 8-K Filing (2026-06-04)
- SEC 8-K Filing (2026-05-07)
- SEC 8-K Filing (2026-02-24)
- SEC Form 4 Insider Transaction (2026-06-08)
- SEC Form 4 Insider Transaction (2026-06-08)
- SEC Form 4 Insider Transaction (2026-06-08)
- SEC 10-K Annual Report — FY2026
- SEC 10-K Annual Report — FY2025
- SEC 10-K Annual Report — FY2024
- SEC 10-K Annual Report — FY2023
- SEC 10-K Annual Report — FY2022
Data sourced from Yahoo Finance and SEC EDGAR. Not investment advice.
Leave a Comment