
Expected price range
Each range is set from the stock’s recent price history and our Hold rating, using its own 1-year realised volatility (29% annualised) as the width of a ~68% statistical band, and checked against that rating so the range leans the same way as our view. Starting price $121 (close 2026-10-27). The stock traded between $88.49 and $123 over the last 6 months and between $88.49 and $123 over the last year. This is an illustration of where our view and normal volatility point, not a forecast, price target or investment advice; the stock can move outside it.
| Company | Oct 25 | Nov 25 | Dec 25 | Jan 26 | Feb 26 | Mar 26 | Apr 26 | May 26 | Jun 26 | Jul 26 | Aug 26 | Sep 26 | 12-Mo |
|---|---|---|---|---|---|---|---|---|---|---|---|---|---|
| ADUS | -1% | +3% | -11% | -4% | +0% | -10% | +3% | -5% | +10% | +15% | -1% | -4% | -6% |
| AVAH | +2% | +3% | -13% | +3% | -12% | -13% | +2% | +10% | +20% | +10% | +43% | -8% | +40% |
| EVH | -21% | -37% | -5% | -20% | +1% | -30% | +64% | +5% | +37% | -43% | +46% | -22% | -59% |
| ALHC | -3% | +14% | +3% | +14% | -15% | -8% | +28% | -32% | +55% | -38% | -10% | -39% | -53% |
| LFST | -11% | +33% | +8% | +0% | +2% | -12% | +19% | +2% | +39% | -2% | +18% | -3% | +119% |
| AMN | +2% | -15% | -5% | +35% | -9% | -6% | +12% | +42% | +12% | +4% | +2% | +5% | +85% |
Source: Yahoo Finance monthly adjusted close.
Quick Thesis
- Rated Hold — steady execution, but valuation already reflects it.
- Strongest support: 116.3M of levered free cash flow TTM.
- Main risk: 39.3% of 2025 revenue came from state and local agencies.
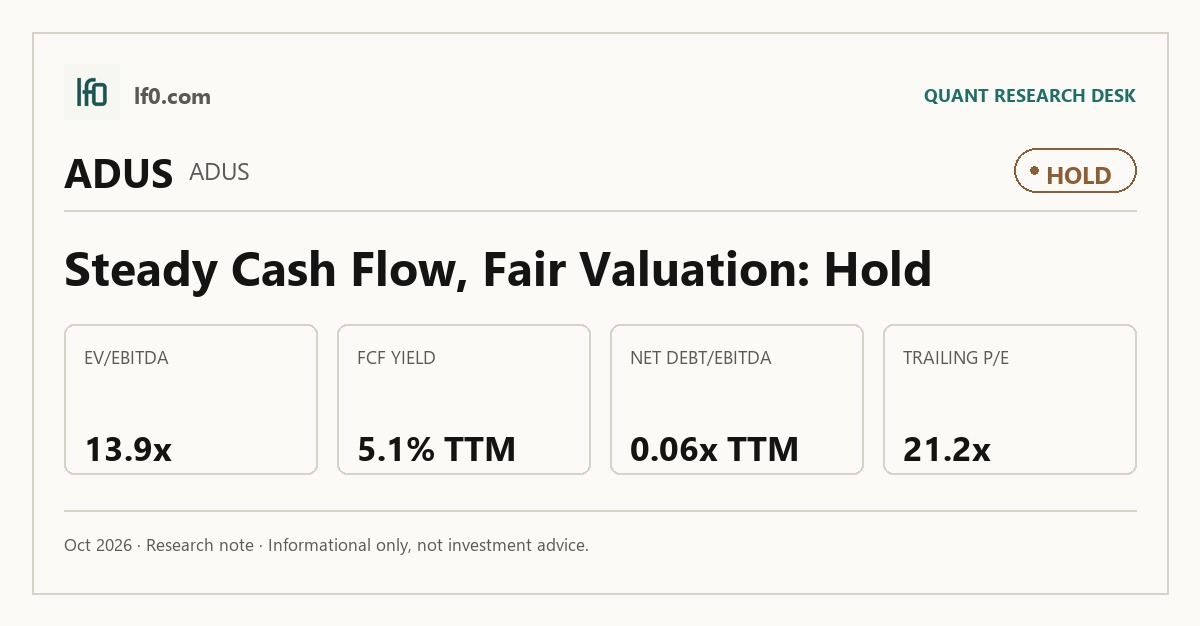
- Valuation is fair, not cheap: 13.9x EV/EBITDA and 16.1x forward P/E.
- I would turn more constructive if EBITDA margin moves above 11.5%.
Executive Summary
Rating: HOLD | ADUS
Measured from adjusted close on 2026-10-27 to 2026-10-27. Sell ratings are correct when the stock falls; Hold is tracked as a +/-10% range. Daily-close data, not intraday. Calls are tracked for 182 days from publication, then frozen as a final record.
I would put my rating as a Hold because Addus HomeCare combines a clean balance sheet with steady earnings, but the stock already prices in that stability. Net debt was only 0.06x EBITDA TTM, while forward P/E was 16.1x and EV/EBITDA was 13.9x, so the shares are not cheap enough to ignore reimbursement and labor risk, yet not weak enough to justify a bearish call. I would raise my rating more towards a Buy if revenue growth stays near the recent 8.0% TTM pace and operating margin moves above 10.0%, because that would show the company is turning acquisition volume and Illinois rate increases into real operating leverage.
Company Profile
Addus HomeCare Corp. provides in-home care through three segments: personal care, hospice, and home health. It earns revenue mainly from federal, state, and local agencies, managed care organizations, commercial insurers, and private pay consumers, with 2025 net service revenue of $1.4B split across personal care ($1.1B), hospice ($262.5M), and home health ($70.8M). Founded in 1979, it served about 107,000 consumers in 2025 across 23 states and roughly 262 offices, and it continues to expand both organically and through acquisitions. Recent deals included Gold Horses, Helping Hands Home Care Service, Great Lakes Home Care Unlimited, and its Jacksonville affiliate in 2025, following the 2024 Gentiva personal care acquisition and Upstate Home Care Solutions. Addus is listed on Nasdaq under ADUS and had $1.4B of total assets and $95.9M of net income in 2025.
Economic Moat
Business Model
The home setting itself is the hard-to-replicate advantage here, because Addus can deliver personal care, hospice, and home health under one operating model to a predominantly dual eligible population that is increasingly managed through narrow networks and value-based arrangements, according to its 2026 10-K. I feel that this is difficult for a well-funded competitor to copy within 3 years because the model depends on state-by-state licensure, electronic visit verification compliance, payor relationships, and caregiver density, not just capital. The secondary moat is the payor mix: managed care organizations have an economic incentive to shift care out of facilities, and Addus’ integrated offering in Ohio, Tennessee, Illinois, and New Mexico gives it a broader referral proposition than a single-line home care provider. The company also benefits from a fragmented market with rising regulatory and technology barriers, which should support consolidation rather than easy new entry.
Business & Operating Risks
Addus’s most material disclosed risk is reimbursement pressure from government payors, because 39.3% of net service revenues came from state and local governmental agencies and 20.5% came from Medicare in 2025, while the risk factors in its SEC 10-K warn that the Budget Control Act of 2011 requires a 2% Medicare reduction through the first eleven months of 2032 and that the OBBBA is expected to reduce Medicaid spending and change state program administration. A second risk is state concentration, especially Illinois, because 37.0% of 2025 net service revenues came from Illinois, 13.1% from New Mexico, and 15.2% from Texas, and 18.1% of 2025 revenue came from Illinois Department on Aging programs. The third risk is labor cost inflation and staffing scarcity, which is not boilerplate for this company because labor is the most significant component of total expenditures and 34.5% of the workforce was unionized at December 31, 2025. A fourth company-specific risk is acquisition and growth execution, because the filing says growth depends on integrating new offices, new services, and acquisitions while keeping pro forma compliance with the credit facility and lender consent thresholds. Taken together, these risks do not break the moat, but they do pressure the very operating model that creates it: the advantage is intact, yet reimbursement and labor can still compress the spread between scale and profit.
Management Discussion & Analysis
Management is signaling that acquisitions remain the main growth lever, but it is now funding them with a mix of revolver borrowings and equity rather than only cash. The Gentiva acquisition for approximately 353.6M was funded primarily with the revolving credit facility and a portion of the net proceeds from the public offering, which tells me management is willing to stretch the balance sheet to buy scale, but investors should not read that as self-funded deleveraging because revolving loans still stood at 124.3M at December 31, 2025 and the total net leverage covenant is capped at 3.75:1.00. The smaller 2025 deals, including Helping Hands for approximately 21.4M and Gold Horses for approximately 7.4M, show a continued tuck-in strategy that expands personal care and adds hospice and home health entry points. Management is also leaning on Illinois rate relief, because Illinois personal care rates rose to 29.63 effective January 1, 2025 and to 30.80 effective January 1, 2026, while the Illinois Department on Aging still represented 18.1% of 2025 net service revenues. That response is directionally right, but the 6.4% decline in personal care revenue per billable hour in 2025 tells me the company is still fighting for unit economics even as it scales.
Recent Events
The most important recent development is not a new product or a governance change; it is the continued acquisition cadence, which reinforces the moat by widening the service footprint and deepening referral density. The 2025 purchases of Jacksonville, Great Lakes, Helping Hands, and Gold Horses, following Gentiva in late 2024, show a deliberate buildout of local scale rather than a one-off expansion. I read that as strategically consistent with the moat, but it also raises the integration burden because the company has to absorb new offices while preserving caregiver quality and reimbursement discipline. No leadership break is visible in the recent record, so the main change is structural rather than managerial.
Financial Analysis
Growth
ADUS — Financial Growth (Quarterly, USD Mil)
| Metric | 2025-06-30 | 2025-09-30 | 2025-12-31 | 2026-03-31 | 2026-06-30 |
|---|---|---|---|---|---|
| REVENUE (USD Mil) | 349.4 | 362.3 | 373.1 | 363.6 | 377.4 |
| EBIT (USD Mil) | 33.5 | 33.7 | 42.9 | 34.6 | 39.5 |
| EBITDA (USD Mil) | 37.4 | 38.1 | 47 | 38.6 | 43.6 |
| NET INCOME (USD Mil) | 22.1 | 22.8 | 29.8 | 25.1 | 27.6 |
| DILUTED EPS | 1.2 | 1.2 | 1.6 | 1.3 | 1.5 |
Source: Yahoo Finance — Quarterly Financial Statements
Revenue rose from $349M in Q2 2025 to $377M in Q2 2026, and the year-over-year growth rate stayed positive across the period, ranging from 4.0% in Q1 2026 to 8.7% in Q3 2025. EBITDA increased to $43.6M in Q2 2026 from $37.4M a year earlier, while net income reached $27.6M from $22.1M. The Q1 2026 dip in revenue and earnings looks like a normal quarterly pause rather than a structural break, so I do not read it as a demand problem; the more important point is that growth is steady, not accelerating, which fits a business that is scaling through acquisitions and reimbursement rather than through a sharp organic inflection. That also means the moat is showing up in consistency more than in speed.
Profitability
ADUS — Profitability (TTM)
| Metric | TTM |
|---|---|
| Operating Margin (TTM) | 9.7% |
| Net Margin (TTM) | 7.1% |
| Return on Assets (TTM) | 6.3% |
| Return on Equity (TTM) | 9.7% |
| Gross Margin (TTM) | 32.0% |
| EBITDA Margin (TTM) | 10.9% |
Source: Yahoo Finance — Trailing Twelve Months (TTM)
TTM gross margin was 32.0%, TTM EBITDA margin was 10.9%, TTM operating margin was 9.7%, and TTM net margin was 7.1%. The 22.3-point gap between gross and operating margin shows the business is still carrying a heavy overhead load, so I focus on scale and staffing efficiency rather than pricing power alone. TTM ROA was 6.3% and TTM ROE was 9.7%, which tells me returns are respectable but not exceptional. The key threshold for me is a positive move in operating margin above 10.0%, because that would show the company is converting growth into operating leverage rather than simply holding the line. In other words, the moat is producing profit, but not yet enough profit to make the stock obviously cheap.
Valuation
ADUS — Valuation Multiples
| Metric | Value |
|---|---|
| Current Share Price (USD) | 121.1 |
| Market Cap (USD Mil) | 2,260 |
| Enterprise Value (USD Mil) | 2,226 |
| Trailing P/E | 21.2 |
| Forward P/E | 16.1 |
| Price/Sales (TTM) | 1.5 |
| Price/Book (mrq) | 1.9 |
| EV/Revenue | 1.5 |
| EV/EBITDA | 13.9 |
| Beta (5Y Monthly) | 0.83 |
| FCF Yield % (TTM) | 5.1% |
| Forward EPS (USD) | 7.5 |
| Analyst Target Price – Low (USD) | 96 |
| Analyst Target Price – Mean (USD) | 134.1 |
| Analyst Target Price – High (USD) | 155 |
| # Analyst Opinions | 13 |
Source: Yahoo Finance
Addus HomeCare trades at 1.5x EV/revenue and 1.5x price/sales on a current share price of $121.1, so the market is paying about $1.5 for each dollar of annual sales and is implicitly assuming the company can keep converting that revenue into mid-single-digit cash flow rather than a margin reset. The 13.9x EV/EBITDA multiple is the cleaner earnings anchor here, and it is supported by a 10.9% EBITDA margin and 5.1% FCF yield, which means the stock is not priced as a deep value name even though cash generation is real. Trailing P/E is 21.2x and forward P/E is 16.1x, while PEG is 1.1x, a combination that points to a fair but not cheap valuation if earnings growth stays near the current trajectory. Price/book is 1.9x versus book value per share of $62.8, and total cash per share is $5.4, so the equity is not being valued as a balance-sheet play. On the analysis here, I would put fair value in a range of roughly $110-$140, which sits close to the $134 analyst mean and inside the $96–$155 published range; that tells me the market and the Street are broadly aligned, even if I weight reimbursement and labor risk a bit more heavily than the consensus appears to. I would also frame earnings power at about $7.0-$7.8 per share on a normalized basis, which is close to the 7.5 forward EPS estimate and implies the stock is not obviously cheap on a like-for-like earnings basis versus peers with stronger growth or lower leverage. Overall, the valuation picture is neutral to slightly bear, because the current price already discounts steady execution.
Leverage
ADUS — Leverage & Coverage (Quarterly)
| Metric | Value |
|---|---|
| Total Debt/Equity % (mrq) | 9.5 |
| Current Ratio (mrq) | 1.7 |
| Total Debt (mrq, USD Mil) | 108.8 |
| Operating Cash Flow (TTM, USD Mil) | 162.4 |
| Levered Free Cash Flow (TTM, USD Mil) | 116.3 |
| Net Debt/EBITDA (TTM) | 0.1 |
| FCF Margin % (TTM) | 7.9% |
Source: Yahoo Finance — Quarterly Financial Statements
Addus HomeCare’s leverage is modest: total debt/equity was 9.5% in mrq, current ratio was 1.7x in mrq, and total debt was $108.8M in mrq. Cash generation is solid, with operating cash flow of $162.4M TTM and levered free cash flow of $116.3M TTM, while net debt/EBITDA was 0.1x TTM and FCF margin was 7.9% TTM. In my opinion, this is low refinancing risk because net debt is effectively negligible relative to EBITDA, so near-term maturities should be manageable without stress. The main watch item is cash conversion: EBITDA is turning into free cash flow, but the 7.9% FCF margin shows the business is not a large cash machine, so flexibility is good rather than exceptional. That balance-sheet strength matters because it gives Addus room to keep buying growth without the refinancing pressure that hangs over more levered peers.
Insider Activity
The insider transaction record I see here is one-sided: 56 open-market sales, $9.8M total, and no open-market purchases over the 2024-12-17 to 2026-05-21 window. The selling is broad rather than concentrated, with multiple executives and a director participating, which suggests weak insider alignment at the margin even though the sample is limited to 50 Form 4 filings. I do not treat that as a thesis breaker, but it does keep me from reading the clean operating profile as a full governance green light.
Comparable Analysis
LF0 has published standalone analyses of these peers: Aveanna Healthcare (AVAH) (rated Hold).
Growth
| Company | Revenue TTM (USD Mil) | Revenue Growth YoY % | EBITDA TTM (USD Mil) | Diluted EPS TTM |
|---|---|---|---|---|
| ADUS | 1,476.4 | 8.0% | 160.5 | 5.7 |
| AVAH | 2,602.8 | 13.7% | 311.2 | 1.3 |
| EVH | 2,097 | 46.9% | 61 | -4.5 |
| ALHC | 4,577.3 | 31.6% | 87.4 | 0.2 |
| LFST | 1,584.8 | 26.1% | 135 | 0.1 |
| AMN | 3,434.3 | 2.3% | 307.3 | 2.7 |
Source: Yahoo Finance
ADUS’s revenue growth of 8.0% TTM trails AVAH at 13.7%, ALHC at 31.6%, LFST at 26.1%, and EVH at 46.9%, while it only modestly leads AMN at 2.3%. That puts ADUS in the middle of the group rather than the growth leader, so its premium should rest on steadier execution and not on top-line acceleration. The comparison matters because ADUS is growing more slowly than the faster names, yet it is not being valued like a distressed laggard either.
Valuation
| Company | Current Share Price (USD) | Trailing P/E | Forward P/E | EV/Revenue | EV/EBITDA | Price/Sales (TTM) | Price/Book (mrq) | Market Cap (USD Mil) | Enterprise Value (USD Mil) | Beta (5Y Monthly) | FCF Yield % (TTM) | Forward EPS | Analyst Target Price – Low | Analyst Target Price – Mean | Analyst Target Price – High | # Analyst Opinions |
|---|---|---|---|---|---|---|---|---|---|---|---|---|---|---|---|---|
| ADUS | 121.1 | 21.2 | 16.1 | 1.5 | 13.9 | 1.5 | 1.9 | 2,260 | 2,226 | 0.83 | 5.1% | 7.5 | 96 | 134.1 | 155 | 13 |
| AVAH | 12.7 | 10 | 13.9 | 1.6 | 13.7 | 1.1 | 9.6 | 2,764 | 4,272 | 1.95 | 3.8% | 0.9 | 13 | 15.1 | 16 | 10 |
| EVH | 4.4 | — | 10.8 | 0.7 | 22.4 | 0.2 | 1.3 | 494 | 1,367 | 1.02 | 25.7% | 0.4 | 3 | 5.8 | 8 | 12 |
| ALHC | 8 | 42.1 | 12.3 | 0.3 | 14.5 | 0.4 | 6.2 | 1,658 | 1,265 | 1.14 | 11.4% | 0.7 | 9 | 12.3 | 26 | 13 |
| LFST | 13.1 | 100.9 | 30.4 | 3.3 | 38.8 | 3.1 | 3.4 | 4,986 | 5,238 | 1.24 | 3.5% | 0.4 | 12 | 14.4 | 18 | 10 |
| AMN | 46.7 | 17.4 | 49.8 | 0.7 | 7.5 | 0.5 | 2.4 | 1,810 | 2,312 | 0.40 | 24.6% | 0.9 | 28 | 36.6 | 43 | 7 |
Source: Yahoo Finance
ADUS trades at 5.1% FCF yield TTM, 21.2x trailing P/E, 16.1x forward P/E, 1.5x EV/revenue, and 1.5x price/sales, versus AMN at 24.6% FCF yield and 7.5x EV/EBITDA, AVAH at 3.8% and 13.7x, ALHC at 11.4% and 14.5x, LFST at 3.5% and 38.8x, and EVH at 25.7% and 22.4x. On cash yield, ADUS is not the cheapest name, but it is far less levered than AVAH or EVH and much less expensive than LFST on EV/EBITDA, so I think the multiple is fair rather than stretched. Using peer EV/revenue of 0.3x to 3.3x on ADUS’s $1.5B revenue implies an illustrative EV range of about $0.4B to $4.9B, or roughly $21 to $261 per share after netting debt and cash, which is too wide to be a precise target but shows the market is not pricing ADUS as an outlier. ADUS’s cleaner leverage profile helps explain why it trades above the weakest peers on revenue multiples without needing the highest growth rate.
Profitability
| Company | Operating Margin (TTM) | Net Margin (TTM) | Return on Assets (TTM) | Return on Equity (TTM) | Gross Margin (TTM) | EBITDA Margin (TTM) |
|---|---|---|---|---|---|---|
| ADUS | 9.7% | 7.1% | 6.3% | 9.7% | 32.0% | 10.9% |
| AVAH | 12.6% | 10.6% | 9.7% | 198.6% | 32.0% | 12.0% |
| EVH | -1.3% | -24.1% | -0.8% | -67.0% | 17.2% | 2.9% |
| ALHC | 3.2% | 0.9% | 3.1% | 20.0% | 12.6% | 1.9% |
| LFST | 7.2% | 3.2% | 2.3% | 3.4% | 33.6% | 8.5% |
| AMN | 4.0% | 3.1% | 4.4% | 15.6% | 27.8% | 8.9% |
Source: Yahoo Finance
ADUS’s 9.7% ROE, 6.3% ROA, 9.7% operating margin, 7.1% net margin, 32.0% gross margin, and 10.9% EBITDA margin sit below AVAH’s 12.6% operating margin and 12.0% EBITDA margin, but well above EVH’s -1.3% operating margin and -24.1% net margin. The gap looks more like scale and mix than a cost-of-revenue problem, because ADUS’s gross margin is close to AVAH’s 32.0% while its operating margin is only slightly lower, which suggests the difference is more about overhead absorption than core service economics. That is a useful distinction: the business is not structurally inferior, but it is not yet extracting the same operating leverage as the best peers.
Leverage
| Company | Total Debt/Equity % (mrq) | Current Ratio (mrq) | Total Debt (mrq, USD Mil) | Operating Cash Flow TTM (USD Mil) | Free Cash Flow TTM (USD Mil) | Net Debt/EBITDA (TTM) | FCF Margin % (TTM) |
|---|---|---|---|---|---|---|---|
| ADUS | 9.5 | 1.7 | 108.8 | 162.4 | 116.2 | 0.1 | 7.9% |
| AVAH | 522.7 | 1.2 | 1,505.3 | 168.2 | 103.8 | 4.5 | 4.0% |
| EVH | 253.2 | 1.2 | 970.4 | 54.3 | 126.8 | 14 | 6.0% |
| ALHC | 124.7 | 1.7 | 330.5 | 205.6 | 188.6 | -4.2 | 4.1% |
| LFST | 32.1 | 1.4 | 474.1 | 217.9 | 172.4 | 1.8 | 10.9% |
| AMN | 104.7 | 1.1 | 775.8 | 470.8 | 445.8 | 1.3 | 13.0% |
Source: Yahoo Finance
ADUS’s 9.5% debt/equity, 0.1x net debt/EBITDA, 7.9% FCF margin, and 1.7x current ratio are materially cleaner than AVAH’s 522.7% debt/equity and 4.5x net debt/EBITDA, LFST’s 32.1% and 1.8x, and AMN’s 104.7% and 1.3x. That balance sheet strength is a real advantage because it gives ADUS more room to keep funding growth without the refinancing risk that hangs over AVAH and AMN. It also helps explain why ADUS can trade at a steadier multiple than some peers even though its growth rate is not the fastest in the group.
Conclusion
I would put my rating as a Hold because Addus HomeCare is executing well, but the stock already prices in that steadiness at 13.9x EV/EBITDA and 16.1x forward P/E. The strongest support is cash generation: levered free cash flow was $116.3M TTM, equal to a 5.1% free cash flow yield, so the business is funding growth without balance-sheet strain. The main risk is reimbursement and labor pressure, with 39.3% of 2025 net service revenue tied to state and local agencies and 20.5% to Medicare, which leaves earnings exposed if rates lag wage inflation. Addus HomeCare therefore lands in the middle for me: the moat is real, but the current numbers do not yet justify paying up for a cleaner balance sheet and steadier growth.
I would raise my rating more towards a Buy if EBITDA margin moves above 11.5%, meaning the company is showing a clear step-up from the current 10.9% and proving that acquisitions are translating into better unit economics. At the current revenue base, that would signal that scale is finally feeding through to profit rather than just adding volume. I would move from Hold to Sell if Illinois reimbursement or Medicaid funding pressure pushes revenue growth below 4.0% for several quarters, because Illinois was 37.0% of 2025 net service revenue and 18.1% came from Illinois Department on Aging programs. If that mix weakens while labor costs stay sticky, the company could lose more than $20M of annual EBITDA on a business that already only produced a 10.9% EBITDA margin TTM, which would make the current multiple look too rich.
Weighing both paths, I think the bull case needs one more clean quarter of margin expansion before it becomes investable at a higher rating, while the bear case is more likely to show up first if state funding turns less supportive. That leaves me with Hold: the business is good enough to own, but not yet strong enough to pay up for.
What to Watch Next
- EBITDA margin above 11.5% — would support raising the rating toward Buy.
- Revenue growth below 4.0% for several quarters — would raise reimbursement risk.
- Illinois mix staying near 37.0% of revenue — would keep state-policy exposure high.
- FCF yield holding near 5.1% — would confirm cash generation remains solid.
- Net debt/EBITDA staying near 0.1x — would preserve balance-sheet flexibility.
What’s your take? I rated Addus HomeCare (ADUS) HOLD above — but the goal here is to get this right, not just to publish an opinion. What would you add to this analysis, or which risk or catalyst do you think I’m under- or over-weighting? Tell me in the comments.
Our track record: every directional call is tracked publicly on The Scorecard, and Stocks Covered lists every company we have rated and when.
Sources
- SEC 10-K Annual Report — filed 2026-02-24
- SEC 8-K Filing (2026-05-04)
- SEC 8-K Filing (2026-02-23)
- SEC Form 4 Insider Transaction (2026-05-22)
- SEC Form 4 Insider Transaction (2026-05-21)
- SEC Form 4 Insider Transaction (2026-04-22)
- SEC 10-K Annual Report — FY2026
- SEC 10-K Annual Report — FY2025
- SEC 10-K Annual Report — FY2024
- SEC 10-K Annual Report — FY2023
Data sourced from Yahoo Finance and SEC EDGAR. Not investment advice.
Leave a Comment