Expected price range
Each range is set from the stock’s recent price history and our Strong Sell rating, using its own 1-year realised volatility (57% annualised) as the width of a ~68% statistical band, and checked against that rating so the range leans the same way as our view. Starting price $49.39 (close 2026-10-23). The stock traded between $46.54 and $61.89 over the last 6 months and between $44.34 and $67.61 over the last year. This is an illustration of where our view and normal volatility point, not a forecast, price target or investment advice; the stock can move outside it.
| Company | Oct 25 | Nov 25 | Dec 25 | Jan 26 | Feb 26 | Mar 26 | Apr 26 | May 26 | Jun 26 | Jul 26 | Aug 26 | Sep 26 | 12-Mo |
|---|---|---|---|---|---|---|---|---|---|---|---|---|---|
| CRSP | -1% | -16% | -2% | -5% | +20% | -21% | +10% | +7% | -3% | -12% | +19% | -3% | -15% |
| VRTX | +9% | +2% | +5% | +4% | +6% | -10% | -4% | +5% | +11% | -4% | +14% | -4% | +33% |
| BMRN | -1% | +4% | +6% | -5% | +9% | -8% | -5% | +6% | -0% | +5% | +9% | -8% | +11% |
| BEAM | +3% | +1% | +9% | -0% | +3% | -16% | +27% | +9% | +4% | -26% | +15% | -17% | +1% |
| NTLA | -27% | -29% | +0% | +46% | +5% | -7% | +5% | +4% | +20% | -37% | +19% | -5% | -30% |
| TEM | +11% | -13% | -24% | +1% | -11% | -15% | +23% | -9% | +15% | -24% | +44% | +30% | +1% |
Source: Yahoo Finance monthly adjusted close.
Quick Thesis
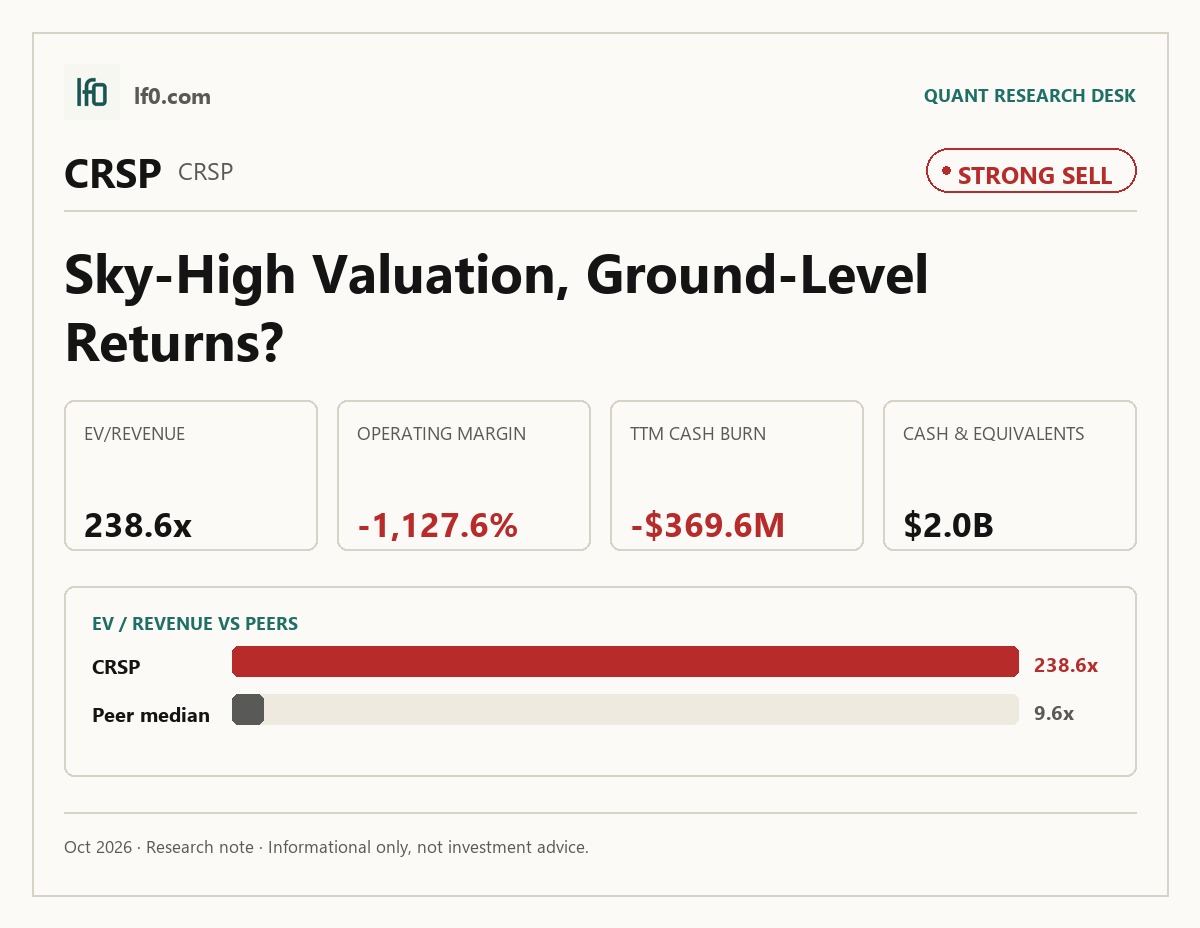
- Rated strong sell — valuation already discounts a much faster commercial ramp than the numbers support.
- Biggest strength: $2B of cash, cash equivalents and marketable securities at December 31, 2025.
- Biggest risk: operating cash flow of -$369.6M TTM, with levered free cash flow of -$215.8M TTM.
- Valuation is extreme at 238.6x EV/revenue and 356.6x price/sales.
- I would improve my view only if quarterly revenue moves well above $10M and gross margin turns positive.
Executive Summary
Rating: STRONG SELL | CRSP
Measured from adjusted close on 2026-10-26 to 2026-10-26. Sell ratings are correct when the stock falls; Hold is tracked as a +/-10% range. Daily-close data, not intraday. Calls are tracked for 182 days from publication, then frozen as a final record.
I would put my rating as a strong sell because CRISPR Therapeutics is still a cash-burning development platform trading as if a much larger commercial business already exists. The company has real scientific validation, but the current numbers do not yet show durable monetization: TTM revenue was $13.4M, operating cash flow was -$369.6M, and levered free cash flow was -$215.8M. In my view, the market is paying for future execution, not present earnings power, and that leaves little margin for error. I would raise my rating toward a hold if quarterly revenue moves well above the recent $10M level and gross margin turns positive, because that would show the platform is finally covering direct costs.
Company Profile
CRISPR Therapeutics AG, founded in 2013, is a gene-editing biopharmaceutical company listed on Nasdaq under CRSP. It develops CRISPR/Cas9-based medicines across four franchises: hemoglobinopathies, in vivo liver editing, CAR T cell therapy, and regenerative medicine. Revenue is still early-stage and comes mainly from collaboration payments, milestones, and royalties, led by the Vertex partnership on CASGEVY, the first approved CRISPR-based therapy. The company also has a March 2023 non-exclusive diabetes license with Vertex and a May 2025 collaboration with Sirius Therapeutics on CTX611, a factor XI siRNA program. It operates a 50,000 square foot cGMP manufacturing facility in Framingham, Massachusetts, where it began making clinical material in 2023, while still relying on third-party manufacturers for some early-stage programs.
Economic Moat
Business Model
The moat is the approved CRISPR/Cas9 platform itself, because CRISPR Therapeutics has already moved from discovery to an approved medicine with CASGEVY, and that regulatory track record is not something a well-funded rival can recreate quickly. I also think the harder-to-copy layer is the combination of proprietary CRISPR/Cas9 intellectual property, roughly 80 active patent families and more than 120 granted or allowed patents, plus the Framingham manufacturing facility, which began producing zugo-cel for clinical trials in 2023 and gives the company internal control over cell-therapy manufacturing know-how. The Vertex relationship and the Sirius collaboration widen the pipeline, but they are complements to the core platform rather than the moat itself. That breadth matters because it makes the intellectual property estate more valuable and harder to displace than a single-program biotech.
The business has broadened over time, but commercial breadth still lags strategic breadth. In fiscal 2022, the company was centered on hemoglobinopathies, three allogeneic CAR T candidates, regenerative medicine, and early in vivo work; by fiscal 2025, it had added a formal type 1 diabetes focus. I see that as a stronger platform than five years ago because the company now has an approved product, a deeper patent estate, and multiple shots on goal, although commercial execution and reimbursement still determine how much of that platform value becomes durable shareholder value.
Business & Operating Risks
CASGEVY is now the central risk because the company no longer has the option to defer those program costs, and the filing is explicit that beginning in 2025 it no longer has that option and that these expenses will exceed its share of revenue for the foreseeable future. That is not a theoretical biotech risk; it is already showing up in the financials because the company is still loss-making and the latest cash balance must absorb a higher ongoing burn from both development and commercialization. Vertex controls research, development, manufacturing and commercialization for CASGEVY, so CRISPR is exposed to execution it does not directly control while still carrying 40% of the net profits and net losses under the collaboration. In practical terms, the lead asset can consume cash faster than it contributes revenue, and the company has already acknowledged that the program’s economics are negative for the foreseeable future.
The second risk is the need for substantial additional funding, which the filing ties directly to dilution and possible program cuts. CRISPR had $2B of cash, cash equivalents and marketable securities at December 31, 2025, and management expects that to fund the current operating plan for at least the next 24 months, but the same section warns that future financing may be needed sooner if the company expands indications, geographies, or delivery modalities. That risk is already materialized in the sense that the business remains unprofitable and the current operating model depends on external capital rather than self-funding. The filing also says any financing could force the company to delay, reduce or eliminate research and development programs, which means dilution is not the only issue; capital scarcity can also slow the pipeline.
A third company-specific risk is the patent and litigation overhang around CRISPR/Cas9, which is no longer abstract. The filing names ToolGen, Inc. and says it initiated a lawsuit in the fourth quarter of 2025 alleging patent infringement by CASGEVY, while the broader patent estate is still entangled in interference and opposition proceedings involving the Broad Institute, Massachusetts Institute of Technology, Harvard University, Vilnius University, ToolGen, and MilliporeSigma. That is already affecting the business because legal defense, patent prosecution, and potential licensing costs can absorb management time and cash even before any damages are paid.
Taken together, these risks do threaten the moat: the patent disputes and CASGEVY economics strike directly at the platform advantage, while the funding risk threatens how long the company can keep that advantage in the field.
Management Discussion & Analysis
Management is signalling a capital-light, partnership-led push rather than a balance-sheet reset, and the March 2026 convertible notes show it is willing to extend runway before the platform becomes self-funding. According to management’s discussion in the 10-K, CRISPR had $1,975.8M of cash, cash equivalents and marketable securities at December 31, 2025, and it expects that base to fund operating expenses and capital expenditures for at least the next 24 months. That tells me the company is not forced into near-term financing, but it also means the current strategy still depends on external capital or collaboration receipts before the platform becomes self-funding. The 2025 ATM, which had $557.2M remaining available at year-end, and the Sirius share issuance show management is willing to use equity and strategic paper to finance development, which supports pipeline breadth but also dilutes holders if the programs do not convert into commercial value. The $96.3M acquired in-process research and development charge tied to the Sirius agreement, plus the $221.8M of deferred CASGEVY costs under the amended Vertex collaboration, tells me management is still paying up for optionality and pushing cash obligations into future program profitability rather than reducing risk today.
Management’s track record is mixed but not careless. In 2024, prior filings showed a belief that collaboration revenue would continue to support the model, yet 2025 collaboration revenue fell to $0 from $35M in 2024, which means the expected Vertex milestone stream did not repeat and the business remained dependent on financing rather than recurring partner cash. Prior filings also framed CASGEVY as the anchor of the franchise, and that was directionally correct because the 2025 filing shows increased CASGEVY commercial and manufacturing costs, but the same filing also shows the company had to exercise the deferral option in prior years and still posted a $581.6M net loss in 2025. Leadership continuity is stable, so there is no governance disruption to flag. The tone has remained optimistic, but the numbers have not kept pace with that confidence, especially on revenue durability and cash burn.
Management is responding to the funding and execution risks, but it has not yet shown me that the business can fund itself without repeated capital raises.
Recent Events
The most significant development is the capital raise on March 16, 2026, when CRISPR Therapeutics completed a $600M convertible senior notes due 2031 offering, with net proceeds of about $585.2M and an initial conversion price of $76.56 per share. I read that as strengthening the balance sheet and extending runway for pipeline execution, but it also adds a meaningful dilution overhang if the stock trades through the conversion price before 2031.
On June 4, 2026, shareholders approved the 2026 Stock Option and Incentive Plan, the increase in capital band, and the increase in conditional share capital for conversion of bonds and similar debt instruments. That gives management flexibility to fund growth and compensate talent, but it also confirms that equity issuance capacity is being preserved, which matters because the company is still in a capital-intensive development phase.
The same June 4 meeting also re-elected the full board and compensation committee and approved the amended Articles of Association, so governance continuity is intact rather than disrupted. Taken together with the March financing, the recent 8-Ks leave the investment case materially stronger on liquidity but more exposed to future dilution, which is supportive for execution and only modestly negative for per-share upside.
Financial Analysis
Growth
CRSP — Financial Growth (Quarterly, USD Mil)
| Metric | 2025-06-30 | 2025-09-30 | 2025-12-31 | 2026-03-31 | 2026-06-30 |
|---|---|---|---|---|---|
| REVENUE (USD Mil) | 0 | 0 | 0 | 1 | 10 |
| EBIT (USD Mil) | -229.3 | -132.1 | -154.8 | -130.2 | -117.3 |
| EBITDA (USD Mil) | -224.7 | -127.6 | -149.1 | -125.9 | -113 |
| NET INCOME (USD Mil) | -208.5 | -106.4 | -130.6 | -122.9 | -91.2 |
| DILUTED EPS | -2.4 | -1.2 | -1.4 | -1.3 | -0.9 |
Source: Yahoo Finance — Quarterly Financial Statements
Revenue is still tiny, but the trajectory is improving: CRISPR Therapeutics posted $1M in Q1 2026 after $0 in Q4 2025 and $0 in Q3 2025, versus $0 in Q1 2025, so the business has only just started to recognize product revenue. EBITDA loss narrowed to -$113M in Q2 2026 from -$125.9M in Q1 2026, while net loss improved to -$91.2M from -$122.9M, which means expense control is outpacing revenue growth. The quarter-to-quarter step-up is too small to call durable yet, but the direction is constructive for a pre-commercial biotech because the base is finally moving off zero.
Profitability
CRSP — Profitability (TTM)
| Metric | TTM |
|---|---|
| Operating Margin (TTM) | -1,127.6% |
| Net Margin (TTM) | 0.0% |
| Return on Assets (TTM) | -14.2% |
| Return on Equity (TTM) | -26.1% |
| Gross Margin (TTM) | -3,448.3% |
| EBITDA Margin (TTM) | -3,831.9% |
Source: Yahoo Finance — Trailing Twelve Months (TTM)
TTM operating margin was -1,127.6%, TTM gross margin was -3,448.3%, and TTM EBITDA margin was -3,831.9%, which means the business is still far from operating leverage and is spending well beyond current revenue on research, development, and launch costs. The gross margin being even more negative than operating margin shows the core cost structure is not yet covered by product revenue, so this is still a development-stage biotech rather than a scaled commercial platform. TTM net margin was 0.0%, but that sits against TTM operating cash flow of -$369.6M and levered free cash flow of -$215.8M, so the apparent breakeven is not a sign of durable earnings power. TTM return on assets was -14.2% and TTM return on equity was -26.1%, and the gap suggests losses are being amplified by capital structure rather than offset by asset productivity. Investors should watch for gross margin turning positive first, because that would show product revenue is finally covering direct costs; until then, the profitability profile remains a bear signal.
Valuation
CRSP — Valuation Multiples
| Metric | Value |
|---|---|
| Current Share Price (USD) | 49.4 |
| Market Cap (USD Mil) | 4,776 |
| Enterprise Value (USD Mil) | 3,195 |
| Trailing P/E | — |
| Forward P/E | -13.9 |
| Price/Sales (TTM) | 356.6 |
| Price/Book (mrq) | 2.7 |
| EV/Revenue | 238.6 |
| EV/EBITDA | -6.2 |
| Beta (5Y Monthly) | 1.76 |
| FCF Yield % (TTM) | -4.5% |
| Forward EPS (USD) | -3.6 |
| Analyst Target Price – Low (USD) | 44 |
| Analyst Target Price – Mean (USD) | 85.6 |
| Analyst Target Price – High (USD) | 291 |
| # Analyst Opinions | 19 |
Source: Yahoo Finance
CRISPR Therapeutics screens on an extreme valuation because the market is paying for a platform that is still producing losses. The primary anchor is EV/revenue at 238.6x, and that multiple implies investors are underwriting a very large future revenue ramp and eventual profitability from CASGEVY and the broader pipeline rather than anything visible in the current income statement. Price/sales is 356.6x on a current share price of $49.39, which means the stock is priced far above current sales power and only makes sense if commercial uptake accelerates sharply. Forward P/E is -13.9x and EV/EBITDA is -6.2x, so earnings-based multiples are not useful cheapness signals here because trailing and forward earnings remain negative. Price/book is 2.7x, but book value per share is only $18.07, so the stock trades at a premium to net assets even after accounting for the cash on the balance sheet. FCF yield is -4.5%, which confirms the business is still burning cash rather than converting sales into shareholder returns. Beta is 1.8, so the equity also carries above-market volatility.
On the analysis here, I would put fair value in a wide range of roughly $44–$86, which brackets the analyst low and mean targets but sits well below the $291 high. That range is still generous relative to the current operating profile because I am weighting cash burn and negative free cash flow more heavily than the consensus appears to. The implied EPS path is still negative: forward EPS is -$3.6, and that is broadly consistent with the peer set’s weakest names rather than with the profitable leaders. In other words, the market is paying for a future earnings inflection that has not yet arrived, and the valuation only works if revenue and margin improvement arrive together rather than separately.
Leverage
CRSP — Leverage & Coverage (Quarterly)
| Metric | Value |
|---|---|
| Total Debt/Equity % (mrq) | 44.9 |
| Current Ratio (mrq) | 17.8 |
| Total Debt (mrq, USD Mil) | 783.7 |
| Operating Cash Flow (TTM, USD Mil) | -369.6 |
| Levered Free Cash Flow (TTM, USD Mil) | -215.8 |
| Net Debt/EBITDA (TTM) | 3.1 |
| FCF Margin % (TTM) | -1,611.8% |
Source: Yahoo Finance — Quarterly Financial Statements
CRISPR Therapeutics’ leverage is manageable on paper but weak in cash generation. Total debt/equity was 44.9% in mrq, current ratio was 17.9x in mrq, and total debt was $783.8M in mrq, so the balance sheet has ample near-term liquidity. The problem is cash conversion: operating cash flow was -$369.6M TTM, levered free cash flow was -$215.8M TTM, net debt/EBITDA was 3.1x TTM, and FCF margin was -1,611.8% TTM. In my opinion, this is medium refinancing risk because the current ratio gives room to absorb losses today, but negative operating cash flow and negative free cash flow mean that cushion erodes unless the business turns cash generative. EBITDA is not yet translating into cash, which points to heavy R&D and development spending rather than a self-funding model. The leverage profile is a bear signal because liquidity is strong now, but cash burn keeps financial flexibility dependent on future clinical or commercial progress.
Insider Activity
The insider transaction record is clearly net selling, with 38 open-market sales versus 2 open-market purchases over the 2025-02-16 to 2026-05-29 window. The selling is broad rather than concentrated, led by the CEO, CFO, General Counsel, and Chief Medical Officer, which suggests weak alignment at the margin even though the sample is limited to 50 Form 4 filings. This is a bear signal because the open-market activity is large, repeated, and spread across multiple insiders.
Comparable Analysis
Growth
| Company | Revenue TTM (USD Mil) | Revenue Growth YoY % | EBITDA TTM (USD Mil) | Diluted EPS TTM |
|---|---|---|---|---|
| CRSP | 13.4 | 1,041.4% | -513.2 | -4.7 |
| VRTX | 12,587.2 | 12.5% | 5,100.5 | 17.2 |
| BMRN | 3,406.6 | 19.9% | 645.3 | 0.4 |
| BEAM | 156 | -94.2% | -355.8 | -0.7 |
| NTLA | 59.5 | -46.2% | -414.4 | -3.4 |
| TEM | 1,432 | 21.6% | -202.4 | -1.4 |
Source: Yahoo Finance
Revenue was $13.4M in TTM, up 1,041.4% year over year, but that is still far below VRTX at $12.6B and BMRN at $3.4B, while TEM grew 21.6% and VRTX 12.5%; the gap says CRSP is still a pre-scale commercializer, so the growth premium is hard to justify on current dollars rather than percentage growth alone. NTLA’s -46.2% revenue growth and BEAM’s -94.2% show CRSP is not the weakest grower, but the peer set is already monetizing at a much larger base, which is what investors are paying for.
Valuation
| Company | Current Share Price (USD) | Trailing P/E | Forward P/E | EV/Revenue | EV/EBITDA | Price/Sales (TTM) | Price/Book (mrq) | Market Cap (USD Mil) | Enterprise Value (USD Mil) | Beta (5Y Monthly) | FCF Yield % (TTM) | Forward EPS | Analyst Target Price – Low | Analyst Target Price – Mean | Analyst Target Price – High | # Analyst Opinions |
|---|---|---|---|---|---|---|---|---|---|---|---|---|---|---|---|---|
| CRSP | 49.4 | — | -13.9 | 238.6 | -6.2 | 356.6 | 2.7 | 4,776 | 3,195 | 1.76 | -4.5% | -3.6 | 44 | 85.6 | 291 | 19 |
| VRTX | 523.9 | 30.5 | 25.7 | 10.1 | 24.9 | 10.5 | 6.6 | 132,711 | 126,921 | 0.28 | 2.0% | 20.4 | 350 | 571.5 | 667 | 28 |
| BMRN | 56 | 151.2 | 8.4 | 4.2 | 21.9 | 3.2 | 1.7 | 10,830 | 14,159 | 0.21 | 0.8% | 6.6 | 60 | 91.6 | 122 | 27 |
| BEAM | 24 | — | -5.1 | 9.6 | -4.2 | 15.9 | 2.3 | 2,484 | 1,498 | 2.20 | -9.7% | -4.7 | 26 | 52.2 | 80 | 13 |
| NTLA | 11.2 | — | -4.4 | 20.3 | -2.9 | 26.4 | 2.2 | 1,571 | 1,206 | 1.80 | -15.9% | -2.6 | 8 | 23.1 | 61 | 18 |
| TEM | 67.6 | — | -1,435.3 | 9 | -63.4 | 8.6 | 27.4 | 12,322 | 12,828 | 3.54 | -0.8% | 0 | 35 | 74.9 | 100 | 18 |
Source: Yahoo Finance
CRSP trades at 238.6x EV/revenue and 356.6x price/sales, versus VRTX at 10.1x and 10.5x, BMRN at 4.2x and 3.2x, BEAM at 9.6x and 15.9x, NTLA at 20.3x and 26.4x, and TEM at 9.0x and 8.6x; the multiple gap is far wider than the growth gap, so I do not think the premium is warranted. FCF yield is -4.5% for CRSP, versus VRTX at 2.0% and BMRN at 0.8%, which is the more telling comparison here because CRSP is still burning cash. Using peer EV/revenue of 4.2x to 20.3x on CRSP’s $13.4M revenue gives an implied enterprise value of about $56M to $272M, or roughly $0.0 to $0.0 per share after net cash and debt, far below the $49.39 share price; that range is only illustrative, but it shows how much future success is already embedded. The market is also paying a premium despite CRSP’s weaker leverage and cash burn profile, so the valuation gap is not being offset by balance-sheet safety.
Profitability
| Company | Operating Margin (TTM) | Net Margin (TTM) | Return on Assets (TTM) | Return on Equity (TTM) | Gross Margin (TTM) | EBITDA Margin (TTM) |
|---|---|---|---|---|---|---|
| CRSP | -1,127.6% | 0.0% | -14.2% | -26.1% | -3,448.3% | -3,831.9% |
| VRTX | 38.1% | 35.0% | 11.9% | 23.5% | 55.0% | 40.5% |
| BMRN | 21.2% | 2.1% | 3.3% | 1.2% | 51.0% | 18.9% |
| BEAM | -25,827.1% | -55.4% | -17.0% | -8.2% | -161.9% | -228.0% |
| NTLA | -1,472.3% | 0.0% | -30.1% | -55.4% | -374.4% | -696.4% |
| TEM | -19.6% | -17.8% | -8.8% | -67.4% | 64.0% | -14.1% |
Source: Yahoo Finance
CRSP’s operating margin of -1,127.6%, gross margin of -3,448.3%, EBITDA margin of -3,831.9%, and net margin of 0.0% are all far weaker than VRTX at 38.1%, 55.0%, 40.5%, and 35.0%, or BMRN at 21.2%, 51.0%, 18.9%, and 2.1%. That is not a scale issue alone; the gross-margin collapse says cost of revenue is still the problem, not just overhead, which means the business model has not yet reached the operating leverage stage peers already enjoy.
Leverage
| Company | Total Debt/Equity % (mrq) | Current Ratio (mrq) | Total Debt (mrq, USD Mil) | Operating Cash Flow TTM (USD Mil) | Free Cash Flow TTM (USD Mil) | Net Debt/EBITDA (TTM) | FCF Margin % (TTM) |
|---|---|---|---|---|---|---|---|
| CRSP | 44.9 | 17.8 | 783.8 | -369.6 | -215.8 | 3.1 | -1,611.8% |
| VRTX | 9.8 | 3.2 | 1,977.6 | 4,292.9 | 2,627.9 | -1.2 | 20.9% |
| BMRN | 66.5 | 2.4 | 4,202.2 | 857.1 | 85.2 | 5.2 | 2.5% |
| BEAM | 23.2 | 14.6 | 247.4 | -359.4 | -241.8 | 2.5 | -155.0% |
| NTLA | 10.1 | 6.6 | 73.4 | -346.6 | -249.8 | 0.9 | -419.8% |
| TEM | 324.6 | 3.3 | 1,444.2 | -237.4 | -99.2 | -3.1 | -6.9% |
Source: Yahoo Finance
CRSP has 44.9% debt/equity, 3.1x net debt/EBITDA, and -1,611.8% FCF margin, while VRTX has 9.8% debt/equity, -1.2x net debt/EBITDA, and 20.9% FCF margin, and BMRN has 66.5%, 5.2x, and 2.5%. CRSP’s 17.9 current ratio and $24.45 cash per share are strong, but the negative FCF margin means the cash pile is funding losses rather than compounding value, so the balance sheet is a cushion, not a competitive advantage. That also explains part of the valuation gap: investors are paying more for CRSP than for some peers despite weaker cash generation and no profitability edge.
Conclusion
I would put my rating as a strong sell because the central tension is simple: CRISPR Therapeutics has a real platform asset, but the market is already pricing a commercial outcome that the financials have not yet earned. The company has $2B of cash and a credible scientific base, yet TTM operating cash flow is still -$369.6M and levered free cash flow is -$215.8M, so the balance sheet is buying time rather than proving the model. That is why I do not think the current valuation is justified by the present earnings path.
I would raise my rating toward a hold if quarterly revenue moves well above the recent $10M level and gross margin turns positive, because that would show the platform is finally covering direct costs. I would also want to see levered free cash flow loss narrow materially from the current -$215.8M TTM run rate, since that would tell me the company is moving toward self-funding economics rather than relying on repeated capital raises. If those thresholds are met together, the market would have a clearer path to a durable commercial model and the valuation would be easier to defend.
I would move from strong sell to strong sell only if cash burn stays near the current pace while the patent disputes around the core CRISPR/Cas9 estate intensify or if the company needs another large equity raise before the 2031 become the main funding bridge. In that case, dilution would arrive before the business has proven it can monetize the platform, and the current share price would look even more detached from operating reality.
Weighing both sides, I think the bear case is more likely to show up first because the company still has to convert scientific validation into durable commercial cash flow, and that has not happened yet. The balance sheet buys time, but it does not change the fact that the stock already discounts a level of execution that the latest financials do not yet justify.
What to Watch Next
- Quarterly revenue above $10M — would support a move toward a hold.
- Gross margin turning positive — would show direct costs are finally covered.
- Levered free cash flow narrowing materially from -$215.8M TTM — would improve self-funding confidence.
- Another large equity raise before 2031 — would increase dilution risk.
- Patent litigation around the CRISPR/Cas9 estate worsening — would pressure the moat further.
What’s your take? I rated CRISPR Therapeutics (CRSP) STRONG SELL above — but the goal here is to get this right, not just to publish an opinion. What would you add to this analysis, or which risk or catalyst do you think I’m under- or over-weighting? Tell me in the comments.
Our track record: every directional call is tracked publicly on The Scorecard, and Stocks Covered lists every company we have rated and when.
Sources
- SEC 10-K Annual Report — filed 2026-02-12
- SEC 8-K Filing (2026-06-04)
- SEC 8-K Filing (2026-05-04)
- SEC 8-K Filing (2026-03-16)
- SEC 8-K Filing (2026-03-11)
- SEC 8-K Filing (2026-02-12)
- SEC 8-K Filing (2026-01-12)
- SEC Form 4 Insider Transaction (2026-06-02)
- SEC Form 4 Insider Transaction (2026-06-02)
- SEC Form 4 Insider Transaction (2026-06-02)
- SEC 10-K Annual Report — FY2026
- SEC 10-K Annual Report — FY2025
- SEC 10-K Annual Report — FY2024
- SEC 10-K Annual Report — FY2023
- SEC 10-K Annual Report — FY2022
Data sourced from Yahoo Finance and SEC EDGAR. Not investment advice.
Leave a Comment