
Expected price range
Each range is a ~68% statistical band built from the stock’s own 1-year realised volatility (105% annualised), centred on a path that closes a quarter of the gap to our fair-value midpoint by 3 months and half by 6 months. Starting price $10.54 (close 2026-10-16). This is an illustration of where our view and normal volatility point, not a forecast, price target or investment advice; the stock can move outside it.
| Company | Oct 25 | Nov 25 | Dec 25 | Jan 26 | Feb 26 | Mar 26 | Apr 26 | May 26 | Jun 26 | Jul 26 | Aug 26 | Sep 26 | 12-Mo |
|---|---|---|---|---|---|---|---|---|---|---|---|---|---|
| USAR | +13% | -31% | -12% | +88% | -16% | -20% | +72% | +8% | -23% | -31% | +19% | -21% | -18% |
| MP | -6% | -2% | -18% | +16% | +0% | -18% | +37% | -2% | -13% | -26% | +32% | -14% | -29% |
| TMC | +11% | -2% | -11% | +7% | -5% | -26% | +12% | +15% | -27% | -20% | +34% | -19% | -40% |
| UUUU | +34% | -30% | +1% | +54% | -5% | -14% | +19% | -16% | -20% | -21% | +29% | -25% | -28% |
| UEC | +13% | -19% | -5% | +48% | -11% | -12% | +10% | -8% | -23% | -10% | +27% | -23% | -29% |
Source: Yahoo Finance monthly adjusted close.
Quick Thesis
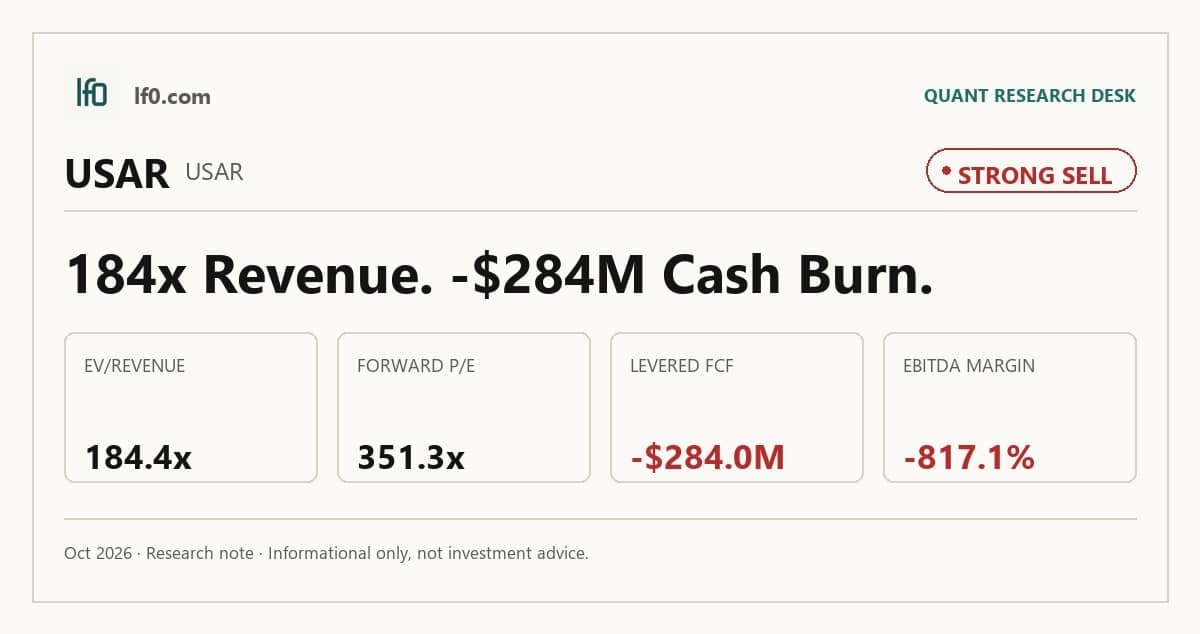
- Rated strong sell — valuation is far ahead of operating reality.
- Biggest strength: $1.5B of cash, or $6.25 per share, funds the buildout.
- Biggest risk: levered free cash flow of -$284M TTM keeps burning that cushion.
- Valuation is rich: 184.4x EV/Revenue and 351.3x forward P/E.
- I would improve only if quarterly revenue moves well above $5.82M and gross margin turns positive.
Executive Summary
Rating: STRONG SELL | USAR
Measured from adjusted close on n/a to 2026-10-16. Sell ratings are correct when the stock falls; Hold is tracked as a +/-10% range. Daily-close data, not intraday. Calls are tracked for 182 days from publication, then frozen as a final record.
I would put my rating as a strong sell because the stock already prices in a large operating inflection that is not visible in the reported numbers. Revenue was only $5.82M in Q2 2026, FCF yield was -7.2% TTM, and EV/Revenue was 184.4x, so the market is paying for a step-up in scale that has not yet shown up in earnings or cash flow. I would move toward a sell if quarterly revenue stays below $10M and operating cash flow remains negative, because that would mean the company is still burning cash without proving the commercial bridge from Less Common Metals to Stillwater and Round Top.
Company Profile
USA Rare Earth, Inc. was formed in 2023 as Inflection Point Acquisition Corp. II, a special purpose acquisition company, and became USA Rare Earth, Inc. on March 13, 2025 when it completed its business combination with USA Rare Earth, LLC. It trades on Nasdaq under USAR and also has warrants under USARW. The company is building a vertically integrated rare earth chain that spans extraction and separation at the Round Top Project in Hudspeth County, Texas, metal and alloy production through Less Common Metals in Cheshire, United Kingdom, and sintered neodymium-iron-boron magnet manufacturing at its Stillwater, Oklahoma facility. Less Common Metals was acquired on November 18, 2025, and the company owns 81.3% of Round Top Mountain Development, the entity holding the Round Top mining rights.
Economic Moat
Business Model
The moat case rests on assembling a rare earth chain that is hard to replicate quickly: mineral rights at Round Top, processing capability through Less Common Metals, and magnet manufacturing at Stillwater. In my view, that combination is more defensible than a single-asset developer because it links feedstock, metal making, and end-product manufacturing in one platform. The Round Top Project is still at the exploration stage, so the moat is strategic rather than proven in cash flow terms, but the environmental setup in an arid part of Texas and the use of overland conveying, heap leaching, and closed-loop recycling should reduce permitting friction versus a more intrusive mine plan.
Business & Operating Risks
The main disclosed risk is execution: the company has not commenced production of neo magnets, has not realized revenue from neo magnets or critical minerals, and still needs reliable feedstock and customers willing to buy at profitable prices. Round Top adds a second layer of risk because it has not commenced construction or commissioning of the mine and has not yet begun to extract minerals. Funding risk is also explicit, with the filing pointing to a required $600M of additional equity by December 31, 2027 and a $250M revolving credit facility by December 31, 2026. These risks do threaten the moat directly, because the integrated advantage only matters if Round Top, processing, and Stillwater all come online together; if one leg slips, the vertical chain becomes a set of disconnected assets rather than a structural edge.
Management Discussion & Analysis
Management is responding to those risks by leaning into capital formation rather than pretending the business is self-funding. The $1.5B PIPE, the June 2026 government funding package, and the South Carolina lease all point to a deliberate attempt to secure financing and manufacturing capacity while the operating base is still small. That response addresses the funding and buildout risks, but it does not remove them, because the company still has to convert capital into commercial output before the moat can be judged durable.
Recent Events
The June 3, 2026 Department of Commerce funding package is the most important recent event because it gives the company a long-dated, government-backed financing path for the buildout. The agreement supports up to $1.6B across the Round Top Mine Project, Stillwater Magnet Project, Stillwater Metal Project, Magnet Project 2, and Metal Project 2, which strengthens the industrial thesis but also adds liens, covenants, and restrictions on dividends, buybacks, and asset sales. The June 1, 2026 Blacksburg, South Carolina lease is the other key step: a 20-year, 800,000 square foot magnet manufacturing site tied to roughly $800M of investment and about 325 jobs. That broadens the footprint, yet it also raises execution risk because the lease, land purchase, and financing milestones all have to line up.
Financial Analysis
Growth
USAR — Financial Growth (Quarterly, USD Mil)
| Metric | 2025-06-30 | 2025-09-30 | 2025-12-31 | 2026-03-31 | 2026-06-30 |
|---|---|---|---|---|---|
| REVENUE (USD Mil) | 0 | 0 | 1.6 | 5.7 | 5.8 |
| EBIT (USD Mil) | -142.7 | -157 | -50.6 | -68.1 | -8.7 |
| EBITDA (USD Mil) | -142.4 | -156.8 | -49.5 | -65.9 | -6.2 |
| NET INCOME (USD Mil) | -142.5 | -156.7 | -50.2 | -67 | -10.3 |
| DILUTED EPS | -1.5 | -1.6 | -0.4 | -0.3 | -0.1 |
Source: Yahoo Finance — Quarterly Financial Statements
Revenue is finally moving off zero, but the scale is still tiny. It rose from $1.64M in Q4 2025 to $5.7M in Q1 2026 and $5.82M in Q2 2026, while EBITDA improved from -$49.5M to -$6.22M over the same span. That is encouraging, but the base is still too small to support the fixed-cost structure, so the growth profile remains pre-scale rather than durable.
Profitability
USAR — Profitability (TTM)
| Metric | TTM |
|---|---|
| Operating Margin (TTM) | -795.6% |
| Net Margin (TTM) | 0.0% |
| Return on Assets (TTM) | -4.4% |
| Return on Equity (TTM) | -23.6% |
| Gross Margin (TTM) | -9.7% |
| EBITDA Margin (TTM) | -817.1% |
Source: Yahoo Finance — Trailing Twelve Months (TTM)
TTM operating margin was -795.6%, gross margin was -9.7%, and EBITDA margin was -817.1%, which tells me the business is still far from covering its cost base. The gap between gross margin and operating margin is especially important: the problem is not only production cost, but also the overhead burden of building a mine-to-magnet platform before it has meaningful volume. TTM ROA was -4.4% and ROE was -23.6%, so capital is not yet being converted into returns efficiently.
Valuation
USAR — Valuation Multiples
| Metric | Value |
|---|---|
| Current Share Price (USD) | 10.5 |
| Market Cap (USD Mil) | 3,953 |
| Enterprise Value (USD Mil) | 2,426 |
| Forward P/E | 351.3 |
| Price/Sales (TTM) | 300.4 |
| Price/Book (mrq) | 1.2 |
| EV/Revenue | 184.3 |
| Beta (5Y Monthly) | 2.68 |
| FCF Yield % (TTM) | -7.2% |
| Forward EPS (USD) | 0 |
| Analyst Target Price – Low (USD) | 21 |
| Analyst Target Price – Mean (USD) | 35.6 |
| Analyst Target Price – High (USD) | 45 |
| # Analyst Opinions | 9 |
Source: Yahoo Finance
USAR trades at 184.4x EV/Revenue and 300.4x Price/Sales, versus a current share price of $10.5 and a forward P/E of 351.3x on forward EPS of $0.0. That is a demanding valuation for a business with negative FCF yield of -7.2% TTM and a beta of 2.7, because the market is already discounting a large earnings inflection that is not visible in the reported numbers. On the analysis here, I would put fair value in a range of roughly $0.0-$2.4 per share using peer EV/Revenue as a rough guide, and that sits well below the $35.6 analyst mean target across 9 opinions. I do not read that gap as a reason to chase the stock; rather, it tells me the consensus is giving more weight than I am to a future operating ramp that still has to prove itself. On earnings, the implied path is equally stretched: forward EPS of $0.0 versus peers such as MP at $0.8 and UUUU at $0.5 suggests USAR is still earlier in the monetization curve, even though it trades at a much richer multiple than those names. The valuation case is therefore tied directly to execution, not just to the cash balance.
Leverage
USAR — Leverage & Coverage (Quarterly)
| Metric | Value |
|---|---|
| Total Debt/Equity % (mrq) | 0.1 |
| Current Ratio (mrq) | 32.8 |
| Total Debt (mrq, USD Mil) | 3.2 |
| Operating Cash Flow (TTM, USD Mil) | -106.1 |
| Levered Free Cash Flow (TTM, USD Mil) | -284 |
| Net Debt/EBITDA (TTM) | 14.2 |
| FCF Margin % (TTM) | -2,157.4% |
Source: Yahoo Finance — Quarterly Financial Statements
The balance sheet is cash-rich, but the operating profile is still cash-consuming. Total debt/equity was 0.1% mrq and total debt was $3.2M, while current ratio was 32.8x and total cash was $1.5B, or $6.25 per share. That liquidity gives the company time, yet operating cash flow was -$106.1M TTM and levered free cash flow was -$284M TTM, so the cushion is being used to fund the buildout rather than compounding. Net debt/EBITDA was 14.2x TTM and FCF margin was -2,157.4%, which means leverage is not the immediate issue; cash burn is.
Insider Activity
The insider record is net buying. Directors bought 101,300 shares in late January 2026, while one director sold 13,000 shares in June 2026, so open-market purchases outweighed sales by a wide margin. I view that as a modest positive signal, but the sample is narrow and it does not override the operating and valuation picture.
Comparable Analysis
Growth
| Company | Revenue TTM (USD Mil) | Revenue Growth YoY % | EBITDA TTM (USD Mil) | Diluted EPS TTM |
|---|---|---|---|---|
| USAR | 13.2 | — | -107.5 | -2.5 |
| MP | 416.2 | 119.7% | 40.7 | -0.3 |
| TMC | — | — | -205.6 | -0.7 |
| UUUU | 105.8 | 496.1% | -71.7 | -0.3 |
| UEC | 37.2 | — | -126.2 | -0.3 |
Source: Yahoo Finance
USAR’s TTM revenue was $13.2M, far below MP’s $416.2M and UUUU’s $105.8M, while TMC had no revenue figure in the table and UEC was at $37.2M. MP’s 119.7% revenue growth and UUUU’s 496.1% growth show that peers are already scaling faster, so USAR is still the laggard on top-line momentum.
Valuation
| Company | Current Share Price (USD) | Trailing P/E | Forward P/E | EV/Revenue | EV/EBITDA | Price/Sales (TTM) | Price/Book (mrq) | Market Cap (USD Mil) | Enterprise Value (USD Mil) | Beta (5Y Monthly) | FCF Yield % (TTM) | Forward EPS | Analyst Target Price – Low | Analyst Target Price – Mean | Analyst Target Price – High | # Analyst Opinions |
|---|---|---|---|---|---|---|---|---|---|---|---|---|---|---|---|---|
| USAR | 10.5 | — | 351.3 | 184.3 | — | 300.4 | 1.2 | 3,953 | 2,426 | 2.68 | -7.2% | 0 | 21 | 35.6 | 45 | 9 |
| MP | 40.2 | — | 49.8 | 17.1 | 174.5 | 17.2 | 3.7 | 7,154 | 7,097 | 1.99 | -6.0% | 0.8 | 53 | 72.1 | 100 | 17 |
| TMC | 2.6 | — | -10.8 | — | -5.1 | — | -41 | 1,138 | 1,039 | 1.91 | 1.8% | -0.2 | 10 | 10.9 | 12.3 | 7 |
| UUUU | 8.5 | — | 17.5 | 17.6 | -26 | 21.2 | 2.7 | 2,243 | 1,863 | 1.87 | -3.9% | 0.5 | 14 | 23.4 | 32.5 | 5 |
| UEC | 7.9 | — | -106.9 | 92 | -27.2 | 105.2 | 2.9 | 3,920 | 3,428 | 1.39 | -1.8% | -0.1 | 10 | 16 | 26.8 | 11 |
Source: Yahoo Finance
USAR trades at 184.3x EV/Revenue and 300.4x Price/Sales, versus MP at 17.1x and 17.2x, UUUU at 17.6x and 21.2x, and UEC at 92.0x and 105.2x. That premium is hard to justify on growth alone, especially because USAR’s forward P/E is 351.3x while MP is 49.8x and UUUU is 17.5x. A $1 investment one year ago would be worth $0.38 in USAR, which is better than TMC’s $0.31 but worse than MP’s $0.50 and UEC’s $0.53; in my view, the market is already pricing in a recovery that still needs to show up in earnings.
Profitability
| Company | Operating Margin (TTM) | Net Margin (TTM) | Return on Assets (TTM) | Return on Equity (TTM) | Gross Margin (TTM) | EBITDA Margin (TTM) |
|---|---|---|---|---|---|---|
| USAR | -795.6% | 0.0% | -4.4% | -23.6% | -9.7% | -817.1% |
| MP | -14.7% | -14.6% | -1.5% | -3.6% | 42.3% | 9.8% |
| TMC | 0.0% | 0.0% | -72.5% | -1,123.2% | — | — |
| UUUU | -79.0% | -77.3% | -4.7% | -11.4% | 40.8% | -67.8% |
| UEC | -228.6% | 0.0% | -6.4% | -11.6% | -184.0% | -338.9% |
Source: Yahoo Finance
USAR’s operating margin of -795.6%, gross margin of -9.7%, and EBITDA margin of -817.1% are materially weaker than MP’s -14.7%, 42.3%, and 9.8%, and also worse than UUUU’s -79.0%, 40.8%, and -67.8%. The return profile is equally weak, with ROE of -23.6% and ROA of -4.4%, so the company is not yet converting capital into profit the way a scaled industrial platform should.
Leverage
| Company | Total Debt/Equity % (mrq) | Current Ratio (mrq) | Total Debt (mrq, USD Mil) | Free Cash Flow TTM (USD Mil) | Net Debt/EBITDA (TTM) | FCF Margin % (TTM) |
|---|---|---|---|---|---|---|
| USAR | 0.1 | 32.8 | 3.2 | -284 | 14.2 | -2,157.4% |
| MP | 41.4 | 9.5 | 981.6 | -432.9 | -11.6 | -104.0% |
| TMC | — | 1.9 | 0 | 20.8 | 0.5 | — |
| UUUU | 85.1 | 27.9 | 678.3 | -87.7 | 3.6 | -82.9% |
| UEC | 0.2 | 17.3 | 3 | -71.7 | 3.9 | -192.4% |
Source: Yahoo Finance
USAR’s current ratio of 32.8x and cash balance of $1.5B make it look safer than MP, UUUU, or UEC on near-term liquidity, but that is offset by -$284M of TTM free cash flow and a -2,157.4% FCF margin. MP and UUUU carry more debt, yet they are also operating at larger scale, so USAR’s apparent balance-sheet strength is really a runway advantage, not evidence of a self-funding model. That is why the leverage profile supports patience, but not a premium valuation.
Conclusion
I would put my rating as a strong sell because the key tension is simple: the company has enough liquidity to keep building, but the reported numbers still show a business that is far from proving commercial scale. Revenue is only $5.82M in the latest quarter, gross margin is still negative, and levered free cash flow is -$284M TTM, so the cash balance is being spent to fund the thesis rather than harvested from it.
I would move toward a hold if quarterly revenue moves above $20M and gross margin turns positive, because that would show the mine-to-magnet chain is finally covering direct costs and starting to absorb fixed overhead. At that point, the current 351.3x forward P/E would look more like a bridge to scale than a sign of overpayment, and the $1.5B cash balance would look like growth capital rather than a cushion being consumed.
I would move from strong sell to a more bearish sell if quarterly revenue stays below $10M while operating cash flow remains negative, because that would mean the company is still burning cash without proving the commercial bridge from Less Common Metals to Stillwater and Round Top. A second warning sign would be another large equity raise before the business reaches positive gross profit, since that would confirm the current capital structure is funding dilution rather than self-sustaining growth.
Weighing both paths, I think the bear case is more likely to show up first because the company still has to prove feedstock, manufacturing yield, and customer demand at the same time. The financing package gives USAR time, but it does not change the fact that the current valuation is far ahead of the reported operating base.
What to Watch Next
- Quarterly revenue above $20M — would support a move toward Hold.
- Gross margin turning positive — would show direct costs are finally covered.
- Operating cash flow staying negative — would keep dilution risk elevated.
- Another large equity raise before positive gross profit — would argue the thesis is still being financed, not proven.
- Levered free cash flow improving materially from -$284M TTM — would show the cash cushion is no longer being consumed as quickly.
What’s your take? I rated USA Rare Earth (USAR) STRONG SELL above — but the goal here is to get this right, not just to publish an opinion. What would you add to this analysis, or which risk or catalyst do you think I’m under- or over-weighting? Tell me in the comments.
Sources
- SEC 10-K Annual Report — filed 2026-03-30
- SEC 8-K Filing (2026-06-05)
- SEC 8-K Filing (2026-06-04)
- SEC 8-K Filing (2026-06-03)
- SEC 8-K Filing (2026-06-02)
- SEC 8-K Filing (2026-05-13)
- SEC 8-K Filing (2026-05-13)
- SEC Form 4 Insider Transaction (2026-06-08)
- SEC Form 4 Insider Transaction (2026-06-04)
- SEC Form 4 Insider Transaction (2026-06-04)
- SEC 10-K Annual Report — FY2026
- SEC 10-K Annual Report — FY2025
- SEC 10-K Annual Report — FY2024
Data sourced from Yahoo Finance and SEC EDGAR. Not investment advice.
Leave a Comment