
Expected price range
Each range is set from the stock’s recent price history and our Hold rating, using its own 1-year realised volatility (30% annualised) as the width of a ~68% statistical band, and checked against that rating so the range leans the same way as our view. Starting price $447 (close 2026-10-22). The stock traded between $324 and $447 over the last 6 months and between $291 and $447 over the last year. This is an illustration of where our view and normal volatility point, not a forecast, price target or investment advice; the stock can move outside it.
| Company | Oct 25 | Nov 25 | Dec 25 | Jan 26 | Feb 26 | Mar 26 | Apr 26 | May 26 | Jun 26 | Jul 26 | Aug 26 | Sep 26 | 12-Mo |
|---|---|---|---|---|---|---|---|---|---|---|---|---|---|
| AMGN | +6% | +17% | -5% | +4% | +14% | -9% | -2% | -2% | +8% | +6% | +12% | -2% | +54% |
| NVS | -3% | +5% | +6% | +8% | +13% | -7% | -3% | +2% | +4% | -0% | -3% | -6% | +15% |
| MRK | +2% | +22% | +1% | +5% | +12% | -2% | -9% | +9% | +9% | +1% | +13% | -1% | +78% |
| ABBV | -5% | +4% | +0% | -2% | +4% | -6% | -2% | +3% | +16% | +0% | +2% | +2% | +16% |
| REGN | +16% | +20% | -1% | -4% | +6% | -1% | -8% | -13% | +1% | +22% | +5% | -5% | +36% |
| GILD | +8% | +5% | -2% | +16% | +5% | -6% | -6% | +3% | -5% | +3% | +12% | +2% | +38% |
Source: Yahoo Finance monthly adjusted close.
Quick Thesis
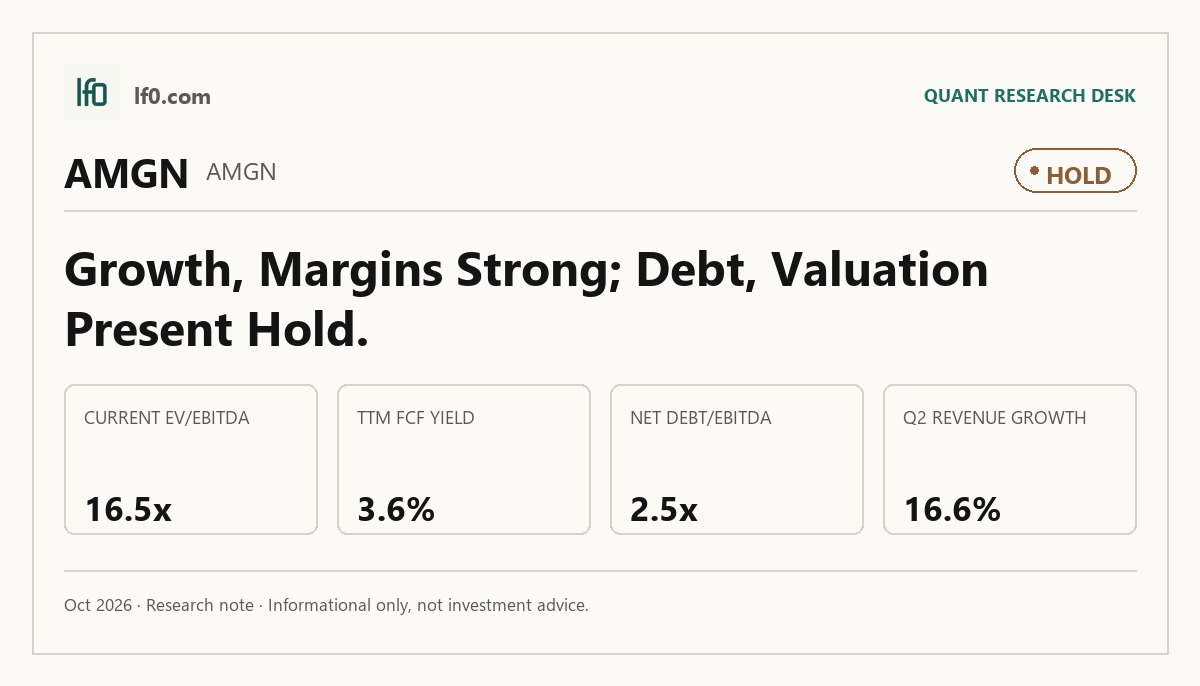
- Rated Hold — strong cash generation, but valuation already discounts it.
- TTM operating margin is 35.6%, supporting a durable earnings base.
- The main risk is $57.3B of debt and policy-driven pricing pressure.
- Valuation is rich versus peers at 16.5x EV/EBITDA.
- I would turn more constructive if revenue stays above 10% growth and FCF margin stays above 20%.
Executive Summary
Rating: HOLD | AMGN
We’ll begin tracking this call’s performance since publication once sufficient adjusted-close data is available.
I would put my rating as a Hold because Amgen’s cash generation is strong enough to support the business, but not strong enough to justify the current valuation with much margin for error. The company’s TTM operating margin is 35.6% and its TTM free cash flow margin is 22.7%, which tells me the franchise still converts sales into cash efficiently even as mature products face pricing pressure. What keeps me at Hold is that the stock already trades at 16.5x EV/EBITDA and 27.8x trailing P/E, so the market is paying for quality that is already visible in the numbers. I would turn more constructive if Amgen can hold revenue growth above 10% year over year while keeping operating margin above 35.0%, because that would show the current earnings base is still compounding rather than just defending itself.
Company Profile
Amgen discovers, develops, manufactures, and sells human therapeutics, with revenue driven by global product sales to wholesalers, providers, and pharmacies. It operates one segment, human therapeutics, and generated $35.1B of product sales in FY2025, with the U.S. contributing $25.7B and the rest of world $9.5B. Founded in 1980 in California and reincorporated in Delaware in 1987, it helped launch biotechnology more than 45 years ago and has since expanded through launches and acquisitions, including Horizon Therapeutics in October 2023. Amgen sells in about 100 countries, runs manufacturing in the U.S., Ireland, the Netherlands, and Singapore, and is expanding capacity in Holly Springs, North Carolina, New Albany, Ohio, and Puerto Rico. The company is listed on Nasdaq under AMGN and funds itself with operating cash flow, a broad commercial portfolio, and a mix of internal and third-party manufacturing and distribution.
Economic Moat
Business Model
The manufacturing network is the most defensible part of Amgen’s model because it spans the U.S., Ireland, the Netherlands, and Singapore, and the company is still expanding that base with the Holly Springs, North Carolina site, a new drug substance facility, and the New Albany, Ohio expansion. I feel that this is hard for a well funded competitor to replicate within 3 years because biologics manufacturing requires specialized process knowledge, regulatory validation, and supply chain control, not just capital. The North Carolina site matters because it opened in January 2025 and uses portable, smaller equipment, which gives Amgen more flexibility to run different medicines at once and respond faster to demand shifts. A second support comes from the portfolio itself: Repatha, TEZSPIRE, UPLIZNA, IMDELLTRA, and TEPEZZA each extend Amgen into distinct therapeutic areas, while patents on several products still run into the late 2020s and 2030s, which helps slow generic and biosimilar erosion. I also see distribution scale as a support, since three wholesalers — McKesson, Cencora, and Cardinal Health — each accounted for more than 10% of total revenues in 2025, but that is more a channel advantage than a moat on its own.
Business & Operating Risks
The most material disclosed risk is pricing and reimbursement pressure, because Amgen’s U.S. sales depend on government and commercial third-party payers and the company now names policy shocks that are already hitting the P&L: CMS has set Medicare Part D prices for ENBREL effective January 1, 2026 and Otezla effective January 2027 at significantly lower prices, while the IRA’s Medicare price setting, inflation rebates, and the July 2025 MFN Letter all point to lower net pricing and narrower access. That is not a theoretical overhang. The filing says these actions have had, and are likely to have, an adverse effect on sales and profitability, and the financial data in this article is consistent with that language because the company is already absorbing lower reimbursement on selected products rather than waiting for a future policy change. The next most important risk is biosimilar and generic erosion, since Amgen currently faces competition from biosimilars and generics and expects increasing competition ahead; the mechanism is direct revenue loss when patent protection expires or is challenged, and the filing is explicit that once exclusivity is lost, the company can lose the majority of revenues for that product in a very short period of time. A third company-specific risk is manufacturing concentration, because Amgen performs a substantial majority of commercial manufacturing in Puerto Rico and a substantial majority of clinical manufacturing in Thousand Oaks, California; a disruption at either site could impair supply, delay trials, and cut sales. The filing also names a single-source dependency on the SureClick autoinjector for products including Repatha and ENBREL, which means a supplier failure could hit multiple franchises at once. I do not think these risks threaten the manufacturing moat directly, but they do pressure the portfolio moat by making mature brands more exposed to pricing resets and exclusivity loss.
Management Discussion & Analysis
Management is responding to the disclosed risks, but it is doing so by reinvesting and defending the portfolio rather than by de-risking the business model outright. According to management’s discussion in their SEC 10-K, Amgen retired $6B of debt in 2025, raised the quarterly cash dividend by 6% to $2.38 per share, and approved $2.52 per share for Q1 2026, which tells me the company is using cash flow to support both the capital structure and shareholder returns. That is backed by $10B of operating cash flow in 2025 and $1.9B of capital expenditures, but the 2026 capex plan rises to about $2.6B, so the next dollar of cash is being steered toward manufacturing and R&D rather than rapid deleveraging. The company also broke ground on a new R&D facility in Thousand Oaks, California, and is expanding manufacturing in Ohio, North Carolina, and Puerto Rico, which signals a longer-duration pipeline and supply-chain buildout; I read that as a commitment to future product capacity, not a near-term margin tailwind. The gap is that 2025 sales growth was 10% while operating expenses rose 6% and R&D rose 22%, so management’s growth narrative is credible, but it also means earnings will stay exposed to pricing pressure from Prolia, XGEVA, ENBREL, and Otezla as exclusivity losses and Medicare price setting hit. The 6% dividend increase and $6.8B of remaining buyback authorization show confidence, but with $50B of long-term debt still on the balance sheet and 2026 capital spending stepping up, I do not read capital allocation as aggressively shareholder-maximizing; it is balanced between reinvestment and returns.
Recent Events
The most important development is the $4B senior note issuance on February 17, 2026, which brought in about $4B of net proceeds across 2031, 2036, 2046, and 2056 maturities. I read that as a balance-sheet strengthening move that gives Amgen more flexibility to fund pipeline work and capital returns while locking in long-dated funding before any tighter credit window.
The second signal is governance and leadership continuity. On April 22, 2026, Amgen announced that Chief Technology Officer David M. Reese will retire on June 30, 2026, and his responsibilities will be redistributed across James E. Bradner, Murdo Gordon, and Peter H. Griffith. In my view, that structure supports the company’s push to integrate science, technology, and commercial execution, but it also tests whether Amgen can keep its innovation engine coordinated without a single technology lead.
On May 19, 2026, the company disclosed that Chief Financial Officer Peter H. Griffith will retire effective August 31, 2026, with Thomas Dittrich set to take over on September 1, 2026. Dittrich’s prior finance and transformation experience at Galderma, Shire, and Amgen itself should help preserve execution discipline, so this looks more like managed succession than disruption.
The May 19, 2026 annual meeting was also cleanly supportive: all 12 directors were elected, executive compensation was approved, and the independent chairman proposal failed. Recent 8-Ks strengthen the investment case modestly because they show financing access and orderly leadership transition, not strategic stress.
Financial Analysis
Growth
AMGN — Financial Growth (Quarterly, USD Mil)
| Metric | 2025-06-30 | 2025-09-30 | 2025-12-31 | 2026-03-31 | 2026-06-30 |
|---|---|---|---|---|---|
| REVENUE (USD Mil) | 9,179 | 9,557 | 9,866 | 8,618 | 10,054 |
| EBIT (USD Mil) | 2,262 | 4,606 | 2,167 | 2,741 | 3,441 |
| EBITDA (USD Mil) | 3,603 | 5,913 | 3,299 | 3,857 | 4,553 |
| NET INCOME (USD Mil) | 1,432 | 3,216 | 1,333 | 1,819 | 2,375 |
| DILUTED EPS | 2.6 | 5.9 | 2.5 | 3.3 | 4.4 |
Source: Yahoo Finance — Quarterly Financial Statements
Amgen’s revenue rose from $8.62B in Q1 2026 to $10.1B in Q2 2026, and the latest quarter was up 16.6% year over year. EBITDA grew faster than revenue in the same period, rising to $4.6B from $3.9B, while net income increased to $2.4B from $1.8B. The Q1 2026 dip looks like a normal quarterly swing rather than a structural break, since Q2 2026 fully recovered and surpassed prior quarters. That matters for the moat because the manufacturing and portfolio base described above is still translating into top-line growth, not just holding share. Growth is a bull signal here because the latest quarter shows reacceleration and the earnings line is expanding faster than sales.
Profitability
AMGN — Profitability (TTM)
| Metric | TTM |
|---|---|
| Operating Margin (TTM) | 35.5% |
| Net Margin (TTM) | 23.0% |
| Return on Assets (TTM) | 8.7% |
| Return on Equity (TTM) | 91.5% |
| Gross Margin (TTM) | 71.9% |
| EBITDA Margin (TTM) | 45.3% |
Source: Yahoo Finance — Trailing Twelve Months (TTM)
Amgen’s TTM operating margin of 35.6%, gross margin of 71.9%, and EBITDA margin of 45.3% show a business with strong pricing power and a wide spread between product gross profit and operating earnings. The 36.3-point gap between gross and operating margin means a large opex burden still sits below the cost of goods sold line, so I weight operating leverage and R&D discipline more than gross margin alone. TTM net margin of 23.0% confirms that the business is already well past the early scaling phase, while TTM return on assets of 8.7% and TTM return on equity of 91.5% show very high equity returns, with the ROE far above ROA indicating leverage and capital structure amplify returns rather than pure asset productivity. The key watch item is whether operating margin keeps expanding toward net margin, because that would show more of the gross profit is converting into after-tax earnings. This is a bull signal because Amgen is already highly profitable and still has room to convert more of its gross profit into GAAP earnings.
Valuation
AMGN — Valuation Multiples
| Metric | Value |
|---|---|
| Current Share Price (USD) | 447.3 |
| Market Cap (USD Mil) | 241,814 |
| Enterprise Value (USD Mil) | 285,129 |
| Trailing P/E | 27.8 |
| Forward P/E | 18.3 |
| Price/Sales (TTM) | 6.3 |
| Price/Book (mrq) | 20.7 |
| EV/Revenue | 7.5 |
| EV/EBITDA | 16.5 |
| Beta (5Y Monthly) | 0.41 |
| FCF Yield % (TTM) | 3.6% |
| Forward EPS (USD) | 24.5 |
| Analyst Target Price – Low (USD) | 225 |
| Analyst Target Price – Mean (USD) | 396.7 |
| Analyst Target Price – High (USD) | 500 |
| # Analyst Opinions | 29 |
Source: Yahoo Finance
Amgen trades at 7.5x EV/Revenue and 16.5x EV/EBITDA on a current share price of $447, which tells me the market is paying for a large, profitable biotech franchise rather than a high-growth one. The primary anchor is EV/Revenue because it is the cleaner read on the stock’s valuation here, and 7.5x implies investors are underwriting durable cash generation and continued pipeline support, not a step-change in growth. Trailing P/E is 27.8x and forward P/E is 18.3x, so the stock is not cheap on earnings, but the forward multiple is more reasonable given forward EPS of 24.5. Price/Sales is 6.35x and Price/Book is 20.7x, which is rich on book value because biotech book equity is not the right economic base for a drug portfolio. FCF yield is 3.58%, so the stock is not priced like a deep value name. PEG ratio is 2.61, which says the multiple is asking for growth that is solid but not explosive. On the analysis here, I would put fair value in a range of about $236-$515 per share, using the peer EV/Revenue band and then adjusting for Amgen’s debt load and cash generation. That range sits around the current price and slightly above the analyst mean target of 397, which tells me the market is already giving credit for quality that the consensus also sees, but not for a much faster growth path. Forward EPS of 24.5 is well above NVS at $9.8, MRK at $9.3, and GILD at $10.0, so the stock is being priced on a much larger earnings base rather than on a clear discount. The valuation picture is a bear signal because the stock already discounts a quality franchise at a premium that leaves limited room for disappointment.
Leverage
AMGN — Leverage & Coverage (Quarterly)
| Metric | Value |
|---|---|
| Total Debt/Equity % (mrq) | 490.3 |
| Current Ratio (mrq) | 1.4 |
| Total Debt (mrq, USD Mil) | 57,304 |
| Operating Cash Flow (TTM, USD Mil) | 12,478 |
| Levered Free Cash Flow (TTM, USD Mil) | 8,645.6 |
| Net Debt/EBITDA (TTM) | 2.5 |
| FCF Margin % (TTM) | 22.7% |
Source: Yahoo Finance — Quarterly Financial Statements
Amgen’s leverage is manageable, but it is not a balance-sheet strength signal. Total Debt/Equity was 490.3% in mrq, Current Ratio was 1.371, and Total Debt was $57.3B, so the company is carrying a large debt load even though near-term liquidity is adequate. Operating Cash Flow was $12.5B in TTM, Levered Free Cash Flow was $8.6B, Net Debt/EBITDA was 2.5x, and FCF Margin was 22.7%. That combination says EBITDA is converting into cash well, which gives Amgen room to absorb a downturn and service debt without immediate stress. In my view, refinancing risk is medium rather than high because the current ratio is above 1.0 and cash generation is strong, but the $57.3B debt stack still leaves the company exposed if rates stay elevated or if a large maturity comes due before cash flow stays this strong. This is a neutral leverage signal.
Insider Activity
The insider transaction record I see here is one-sided: 14 open-market sales and 0 open-market purchases from 2025-02-05 to 2026-05-19, so insiders are net sellers. The activity is broad rather than concentrated, with multiple executives selling on the same dates, which points to weak alignment at the margin even though the sample is limited to 142 Form 4 filings. This is a bear signal because the open-market pattern is persistent selling with no offsetting insider buying.
Comparable Analysis
Growth
| Company | Revenue TTM (USD Mil) | Revenue Growth YoY % | EBITDA TTM (USD Mil) | Diluted EPS TTM |
|---|---|---|---|---|
| AMGN | 38,095 | 9.5% | 17,268 | 16.1 |
| NVS | 56,693 | 0.8% | 23,098 | 6.6 |
| MRK | 66,569 | 5.1% | 28,871 | 1.3 |
| ABBV | 64,386 | 10.2% | 30,763 | 3.5 |
| REGN | 15,534.7 | 16.7% | 4,702.4 | 40.4 |
| GILD | 30,457 | 10.2% | 14,601 | -2.6 |
Source: Yahoo Finance
Amgen’s revenue growth of 9.5% TTM sits above NVS at 0.8% and below REGN at 16.7%, while it is roughly in line with ABBV and GILD at 10.2% and ahead of MRK at 5.1%. That middle-of-the-pack profile does not support a large growth premium, especially because Amgen’s quarterly earnings growth of 64.9% is strong but still trails ABBV’s 290.4% and is not enough on its own to justify a top-tier multiple.
Valuation
| Company | Current Share Price (USD) | Trailing P/E | Forward P/E | EV/Revenue | EV/EBITDA | Price/Sales (TTM) | Price/Book (mrq) | Market Cap (USD Mil) | Enterprise Value (USD Mil) | Beta (5Y Monthly) | FCF Yield % (TTM) | Forward EPS | Analyst Target Price – Low | Analyst Target Price – Mean | Analyst Target Price – High | # Analyst Opinions |
|---|---|---|---|---|---|---|---|---|---|---|---|---|---|---|---|---|
| AMGN | 447.3 | 27.8 | 18.3 | 7.5 | 16.5 | 6.3 | 20.7 | 241,814 | 285,129 | 0.41 | 3.6% | 24.5 | 225 | 396.7 | 500 | 29 |
| NVS | 156.3 | 23.6 | 15.9 | 6 | 14.7 | 5.2 | 7.1 | 297,025 | 338,825 | 0.47 | 4.0% | 9.8 | 130 | 154.7 | 185 | 11 |
| MRK | 147.2 | 116.9 | 15.9 | 6.2 | 14.2 | 5.5 | 8.7 | 363,266 | 410,087 | 0.22 | 4.2% | 9.3 | 105 | 158.6 | 186 | 25 |
| ABBV | 285.2 | 80.6 | 17.6 | 8.8 | 18.5 | 7.8 | -84.9 | 503,964 | 568,327 | 0.23 | 3.4% | 16.2 | 200 | 284.8 | 328 | 28 |
| REGN | 819.1 | 20.3 | 13 | 4.9 | 16.3 | 5.4 | 2.6 | 84,329 | 76,502 | 0.15 | 3.6% | 62.8 | 730 | 867.3 | 1,030 | 27 |
| GILD | 157.2 | — | 15.8 | 7.1 | 14.8 | 6.4 | 16.5 | 194,909 | 216,189 | 0.33 | 5.0% | 10 | 126 | 160.2 | 184 | 26 |
Source: Yahoo Finance
Amgen’s FCF yield of 3.58% is below NVS at 4.0%, MRK at 4.2%, and GILD at 5.0%, while its EV/Revenue of 7.5x and EV/EBITDA of 16.5x are above NVS at 6.0x and 14.7x, MRK at 6.2x and 14.2x, and REGN at 4.9x and 16.3x. On a peer-multiple basis, Amgen’s implied EV range from the peer EV/Revenue band of 4.9x to 8.8x on $38.1B of revenue is about $186.9B to $336.7B; netting $57.3B of debt and $14B of cash and dividing by 540.6M shares gives an illustrative equity range of roughly $236 to $515 per share, which brackets the current $447 price and says the stock is priced toward the upper half of the peer set. Forward EPS of 24.5 is also higher than NVS at $9.8, MRK at $9.3, and GILD at $10.0, so the market is paying for a much larger earnings base rather than a clear valuation discount.
Profitability
| Company | Operating Margin (TTM) | Net Margin (TTM) | Return on Assets (TTM) | Return on Equity (TTM) | Gross Margin (TTM) | EBITDA Margin (TTM) |
|---|---|---|---|---|---|---|
| AMGN | 35.5% | 23.0% | 8.7% | 91.5% | 71.9% | 45.3% |
| NVS | 34.6% | 22.5% | 10.2% | 30.3% | 75.0% | 40.7% |
| MRK | -0.2% | 4.8% | 11.9% | 7.0% | 75.9% | 43.4% |
| ABBV | 40.0% | 9.8% | 10.5% | — | 72.8% | 47.8% |
| REGN | 33.1% | 27.9% | 6.5% | 14.0% | 44.5% | 30.3% |
| GILD | 33.7% | -10.6% | 14.1% | -20.7% | 79.6% | 47.9% |
Source: Yahoo Finance
Profitability is where Amgen earns its premium. Gross margin of 71.9% is below NVS at 75.0%, MRK at 75.9%, and GILD at 79.6%, but Amgen’s operating margin of 35.6% and EBITDA margin of 45.3% are stronger than NVS at 34.6% and 40.7%, MRK at -0.2% and 43.4%, and close to ABBV at 40.0% and 47.8%. That pattern points more to scale and operating leverage than to a cost-of-revenue advantage, because the gross margin gap is modest while the operating margin gap is more decisive.
Leverage
| Company | Total Debt/Equity % (mrq) | Current Ratio (mrq) | Total Debt (mrq, USD Mil) | Operating Cash Flow TTM (USD Mil) | Free Cash Flow TTM (USD Mil) | Net Debt/EBITDA (TTM) | FCF Margin % (TTM) |
|---|---|---|---|---|---|---|---|
| AMGN | 490.3 | 1.4 | 57,304 | 12,478 | 8,645.6 | 2.5 | 22.7% |
| NVS | 116.8 | 0.9 | 49,014 | 18,393 | 11,900.2 | 1.8 | 21.0% |
| MRK | 128.4 | 1.3 | 53,911 | 19,967 | 15,171.5 | 1.6 | 22.8% |
| ABBV | — | 0.8 | 70,885 | 19,507 | 16,870.2 | 2.1 | 26.2% |
| REGN | 8.5 | 3.3 | 2,706.6 | 4,681.3 | 3,065.3 | -1.1 | 19.7% |
| GILD | 223.5 | 1.3 | 26,246 | 13,552 | 9,768.9 | 1.5 | 32.1% |
Source: Yahoo Finance
Amgen is more levered than the cleanest balance sheets in the group. Net debt/EBITDA of 2.5x is above NVS at 1.8x, MRK at 1.6x, GILD at 1.5x, and REGN at -1.1x, while debt/equity of 490.3% is far above NVS at 116.8% and MRK at 128.4%; the offset is Amgen’s 22.7% FCF margin, which is close to MRK at 22.8% and above NVS at 21.0%. In other words, the balance sheet is not fragile, but it is more debt-dependent than the cash-rich peers, so the premium multiple needs continued cash conversion to hold.
Conclusion
I would put my rating as a Hold because Amgen’s 35.6% operating margin and 22.7% free cash flow margin in TTM show a highly cash-generative franchise, but the stock already prices that quality at 16.5x EV/EBITDA and 27.8x trailing P/E, which leaves limited room for disappointment. The key tension is that the business is still producing $8.6B of levered free cash flow in TTM and $12.5B of operating cash flow in TTM, yet policy-driven pricing pressure and patent erosion can still hit the earnings base before the next launch cycle fully offsets them.
I would raise my rating more toward a Buy if Amgen can hold revenue growth in the low double digits while keeping operating margin above 35.0%, because that would show the current earnings base is still compounding rather than just defending itself. A cleaner bull case would be another year of cash conversion near the current $8.6B run rate, plus no material hit from ENBREL and Otezla pricing resets, since that would support continued buybacks and dividend growth without forcing the market to pay for a weaker earnings profile. If the company can also keep net debt/EBITDA near 2.5x while the new manufacturing sites in North Carolina and Ohio ramp, I would see a path to a higher multiple because the market would have evidence that reinvestment is still creating incremental value.
I would move from Hold to Sell if the policy and patent headwinds start to hit the numbers together, especially if operating margin slips below 33.0%, meaning the company is losing more of its gross profit to pricing pressure and R&D before the new launches can offset it. A second trigger would be free cash flow falling materially below the current $8.6B run rate, because that would weaken the company’s ability to fund the dividend, debt service, and the $2.6B capex plan at the same time. If ENBREL, Prolia, and XGEVA erosion accelerates while the Medicare pricing actions on ENBREL and Otezla flow through, I would expect earnings to compress faster than the market is now discounting.
Weighing both sides, I lean to Hold rather than Buy because the bull case depends on execution staying near current levels, while the bear case has several already visible policy and exclusivity pressures that can show up before the next launch cycle fully offsets them. The cash engine is strong enough to prevent a near-term rerating lower, but not strong enough to make the current valuation look cheap.
What to Watch Next
- Revenue growth above 10% year over year — would support a move toward Buy.
- Operating margin above 35.0% — would show earnings power is still compounding.
- Levered free cash flow near $8.6B — would support continued buybacks and dividends.
- Net debt/EBITDA near 2.5x — would show reinvestment is not weakening the balance sheet.
- Operating margin below 33.0% — would argue for a move toward Sell.
What’s your take? I rated Amgen (AMGN) HOLD above — but the goal here is to get this right, not just to publish an opinion. What would you add to this analysis, or which risk or catalyst do you think I’m under- or over-weighting? Tell me in the comments.
Sources
- SEC 10-K Annual Report — filed 2026-02-13
- SEC 8-K Filing (2026-05-20)
- SEC 8-K Filing (2026-05-19)
- SEC 8-K Filing (2026-04-30)
- SEC 8-K Filing (2026-04-22)
- SEC 8-K Filing (2026-02-19)
- SEC 8-K Filing (2026-02-03)
- SEC Form 4 Insider Transaction (2026-05-21)
- SEC Form 4 Insider Transaction (2026-05-21)
- SEC Form 4 Insider Transaction (2026-05-21)
- SEC 10-K Annual Report — FY2026
- SEC 10-K Annual Report — FY2025
- SEC 10-K Annual Report — FY2024
- SEC 10-K Annual Report — FY2023
- SEC 10-K Annual Report — FY2022
Data sourced from Yahoo Finance and SEC EDGAR. Not investment advice.
Leave a Comment