
Expected price range
Each range is a ~68% statistical band built from the stock’s own 1-year realised volatility (57% annualised), centred on a path that closes a quarter of the gap to our fair-value midpoint by 3 months and half by 6 months. Starting price $188 (close 2026-10-22). This is an illustration of where our view and normal volatility point, not a forecast, price target or investment advice; the stock can move outside it.
| Company | Oct 25 | Nov 25 | Dec 25 | Jan 26 | Feb 26 | Mar 26 | Apr 26 | May 26 | Jun 26 | Jul 26 | Aug 26 | Sep 26 | 12-Mo |
|---|---|---|---|---|---|---|---|---|---|---|---|---|---|
| GNRC | +0% | -10% | -10% | +23% | +34% | -13% | +33% | +7% | +5% | -33% | -6% | +12% | +24% |
| HUBB | +9% | -8% | +3% | +10% | +5% | -4% | +4% | -7% | +10% | -10% | -4% | +0% | +7% |
| ETN | +2% | -9% | -8% | +10% | +7% | -5% | +21% | -7% | +6% | -3% | -3% | +7% | +16% |
| TT | +6% | -6% | -8% | +8% | +10% | -10% | +18% | -8% | +9% | -7% | -2% | +2% | +8% |
| CARR | +0% | -8% | -4% | +13% | +8% | -13% | +19% | -5% | +15% | -15% | -6% | -6% | -7% |
| REZI | -1% | -23% | +6% | -2% | +13% | -13% | +23% | -24% | -1% | +10% | -19% | -6% | -40% |
Source: Yahoo Finance monthly adjusted close.
Quick Thesis
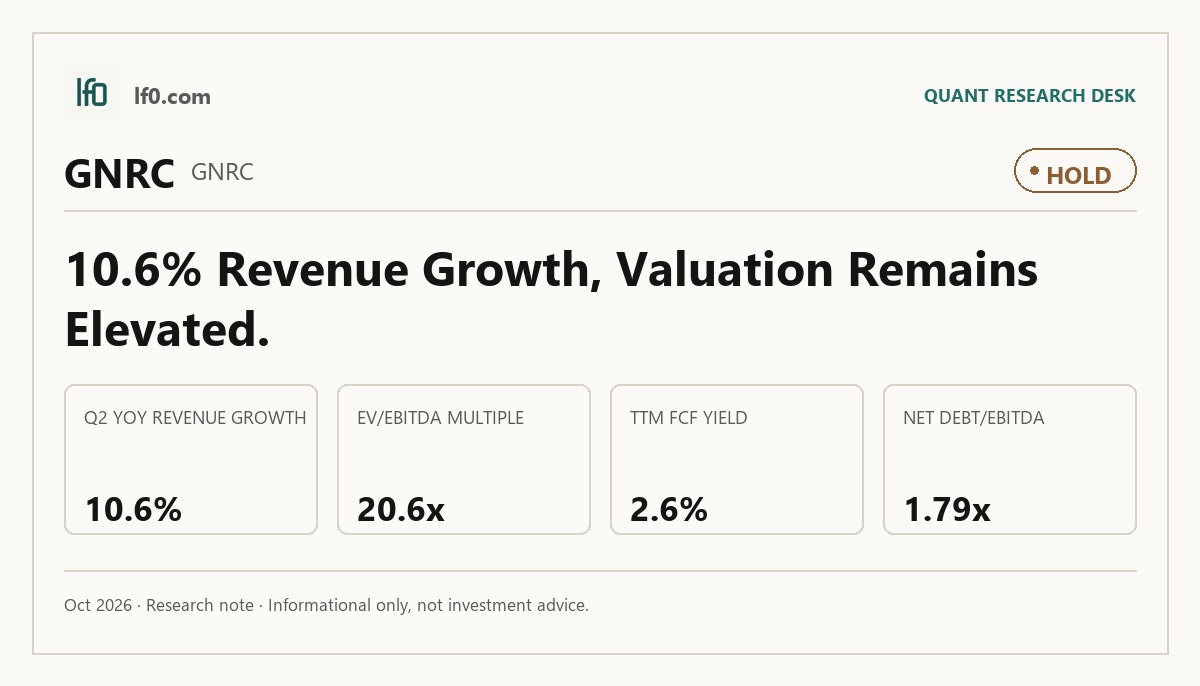
- Rated Hold — valuation already discounts a recovery, but cash conversion is still modest.
- Strongest support: 289.1M of levered free cash flow and 1.79x net debt/EBITDA.
- Main risk: 23 open-market insider sales for $15M and no purchases.
- Valuation is fair to slightly rich at 20.6x EV/EBITDA and 14.4x forward P/E.
- I would turn more constructive if revenue holds above 1.2B and margins keep expanding.
Executive Summary
Rating: HOLD | GNRC
We’ll begin tracking this call’s performance since publication once sufficient adjusted-close data is available.
I would put my rating as a Hold because the market is already pricing in a recovery that is visible in forward earnings, but not yet fully confirmed in cash generation. Generac’s latest quarter showed 1.2B of revenue and 264.9M of EBITDA, which is a clear step up from late 2025, yet the company still posted only a 2.6% FCF yield over the last twelve months and insider activity has been one-sided selling. In my view, that leaves the stock in a middle ground: the operating trend is improving, but the valuation is not cheap enough to ignore the execution risk. I would raise my rating more towards a Buy if revenue stays above 1.2B and EBITDA holds above 264.9M for a few more quarters, because that would show the rebound is becoming durable rather than quarter-specific.
Company Profile
Generac Holdings designs and sells power generation equipment, energy storage systems, energy management devices, and related services for residential, commercial, data center, telecom, rental, and industrial customers. The company began in 1959, went public in 2010, and now operates globally from Waukesha, Wisconsin. Its portfolio spans home standby generators, large-megawatt diesel generators for data centers, PWRcell storage, ecobee smart home devices, and microinverters. Residential products accounted for 53.9% of 2025 net sales, so the business still leans on the home backup market even as it broadens into a wider energy platform.
Economic Moat
Business Model
Generac’s moat is built on an installed base and distribution system that is hard to rebuild quickly. In my view, the largest factory-direct independent generator dealer network in North America matters more than any single product line because it gives the company reach across residential dealers, industrial distributors, retail channels, and connected devices. The product set also helps: the company sells from 800W to 3,250kW and layers Mobile Link remote monitoring, ecobee, PWRcell 2, and PWRmicro onto the same channel. No single customer provided more than 4% of 2025 net sales, which tells me the model is not dependent on one buyer and is instead spread across a broad route to market.
Business & Operating Risks
The biggest disclosed risk is demand volatility tied to outage activity. Generac says demand for most products is significantly affected by unpredictable power outages, and that long stretches without major disruptions can reduce awareness, slow sales growth, and leave excess inventory. Supply risk is also real: the company does not typically use long-term supply contracts and relies on a small number of outside manufacturers and component suppliers, including single-source vendors. That can delay shipments, raise costs, and hurt launches. The move into data center backup power adds another layer of execution risk because those projects are harder to forecast and can require more capital and management attention. Taken together, these risks do not break the moat, but they do test whether the channel advantage can keep converting into steady earnings when demand is uneven.
Management Discussion & Analysis
Management is responding to those risks, but only partially. The July 2025 amendment to the Term Loan A Facility and Revolving Credit Facility extended maturities to 2030, which lowers refinancing pressure, and the new $500M repurchase authorization shows the company still has enough liquidity to return capital. At the same time, the operating message is more mixed than the capital-allocation message: 2025 net sales fell 2.0% to 4.2B, so the recent product and channel expansion has not yet fully offset residential softness. I read that as management defending flexibility first and proving growth second.
Recent Events
The most important recent filing was the March 2026 segment reorganization, which moved reporting from Domestic and International to Residential and Commercial & Industrial. That is more than a presentation change; it lines up the reporting structure with where management is now focusing capital and attention. The March 2026 equity awards for Norm Taffe and Erik Wilde also matter because they tie compensation to performance through 2027 and 2028, which suggests management wants the new structure to translate into execution. Recent 8-Ks therefore support the moat thesis by making the business easier to track, but they do not by themselves prove that the broader platform is already earning a premium return.
Financial Analysis
Growth
GNRC — Financial Growth (Quarterly, USD Mil)
| Metric | 2025-06-30 | 2025-09-30 | 2025-12-31 | 2026-03-31 | 2026-06-30 |
|---|---|---|---|---|---|
| REVENUE (USD Mil) | 1,061.2 | 1,114.4 | 1,091.5 | 1,059.4 | 1,173.5 |
| EBIT (USD Mil) | 108.1 | 96.8 | -10.8 | 112.1 | 206.5 |
| EBITDA (USD Mil) | 156.4 | 146 | 40.4 | 168.1 | 264.9 |
| NET INCOME (USD Mil) | 74 | 66.2 | -24.5 | 73.3 | 143.2 |
| DILUTED EPS | 1.2 | 1.1 | -0.4 | 1.2 | 2.4 |
Source: Yahoo Finance — Quarterly Financial Statements
Revenue has improved from the late-2025 trough, with Q2 2026 sales of 1.2B up 10.6% year over year. EBITDA rose faster, reaching 264.9M in Q2 2026 versus 156.4M a year earlier, which tells me the company is getting operating leverage back as demand improves. The key point is that this is a rebound from a softer base, not a clean multi-quarter acceleration yet, so I would not overread one strong quarter.
Profitability
GNRC — Profitability (TTM)
| Metric | TTM |
|---|---|
| Operating Margin (TTM) | 17.9% |
| Net Margin (TTM) | 5.8% |
| Return on Assets (TTM) | 4.7% |
| Return on Equity (TTM) | 9.5% |
| Gross Margin (TTM) | 39.5% |
| EBITDA Margin (TTM) | 14.3% |
Source: Yahoo Finance — Trailing Twelve Months (TTM)
TTM gross margin was 39.5%, EBITDA margin was 14.3%, operating margin was 17.9%, net margin was 5.8%, ROA was 4.7%, and ROE was 9.5%. The spread between gross and operating margin shows that overhead still absorbs a large share of gross profit, so the business is not yet converting its product economics into full earnings power. ROE above ROA tells me leverage helps returns, but not enough to make the balance sheet a major source of upside. The more important signal is whether net margin keeps moving closer to operating margin, because that would show less leakage below EBIT and a cleaner earnings base.
Valuation
GNRC — Valuation Multiples
| Metric | Value |
|---|---|
| Current Share Price (USD) | 186.5 |
| Market Cap (USD Mil) | 11,016 |
| Enterprise Value (USD Mil) | 13,126 |
| Trailing P/E | 42.9 |
| Forward P/E | 14.4 |
| Price/Sales (TTM) | 2.5 |
| Price/Book (mrq) | 3.8 |
| EV/Revenue | 3 |
| EV/EBITDA | 20.6 |
| Beta (5Y Monthly) | 1.92 |
| FCF Yield % (TTM) | 2.6% |
| Forward EPS (USD) | 13 |
| Analyst Target Price – Low (USD) | 215 |
| Analyst Target Price – Mean (USD) | 287.8 |
| Analyst Target Price – High (USD) | 375 |
| # Analyst Opinions | 18 |
Source: Yahoo Finance
Generac trades at 20.6x EV/EBITDA, 14.4x forward P/E, 2.5x price/sales, and 3.8x price/book, with a current share price of $186.5 and an enterprise value of 13.1B. I think that is fair to slightly rich for a business with a 2.6% FCF yield and only 289.1M of levered free cash flow over the last twelve months. The market is clearly paying for earnings normalization, not for current cash yield.
On my read, fair value sits around $170-$240 per share. That range is below the 287.8 analyst mean target and inside the 215-$375 analyst range, which tells me my view is more cautious than consensus because I weight cash conversion and leverage more heavily than the sell-side appears to. I also think the implied earnings path matters more than the headline multiple: with forward EPS at 13, the stock is not expensive if the company can keep margins moving higher, but it is not cheap if the recovery stalls. That is why I keep the call at Hold rather than leaning into the analyst target range.
Leverage
GNRC — Leverage & Coverage (Quarterly)
| Metric | Value |
|---|---|
| Total Debt/Equity % (mrq) | 49 |
| Current Ratio (mrq) | 2 |
| Total Debt (mrq, USD Mil) | 1,410.3 |
| Operating Cash Flow (TTM, USD Mil) | 548.1 |
| Levered Free Cash Flow (TTM, USD Mil) | 289.1 |
| Net Debt/EBITDA (TTM) | 1.8 |
| FCF Margin % (TTM) | 6.5% |
Source: Yahoo Finance — Quarterly Financial Statements
Leverage is manageable, but it is not a source of competitive advantage. Total debt was 1.4B, debt/equity was 49%, and the current ratio was 2.0x, so the company has enough liquidity to absorb a softer quarter without immediate balance-sheet stress. Net debt/EBITDA of 1.79x and FCF margin of 6.5% show that earnings are still turning into cash, but not at a level that gives much room for error if demand weakens or rates stay high. In my view, this is a workable balance sheet rather than a loose one.
Insider Activity
The insider record is one-sided: 23 open-market sales for $15M and no open-market purchases from 2025-01-02 to 2026-06-05. The pattern is concentrated in repeated sales by Aaron Jagdfeld and smaller sales by Taffe Norman P, which does not support a strong alignment signal in the near term. I treat that as a mild negative, not a thesis breaker, but it does matter when the stock already trades on a recovery narrative.
Comparable Analysis
Growth
| Company | Revenue TTM (USD Mil) | Revenue Growth YoY % | Diluted EPS TTM |
|---|---|---|---|
| GNRC | 4,438.7 | 10.6% | 4.3 |
| HUBB | 6,223.6 | 15.3% | 16.9 |
| ETN | 30,026 | 21.4% | 9.8 |
| TT | 22,209.9 | 10.6% | 13.4 |
| CARR | 22,108 | 3.9% | 1.4 |
| REZI | 7,652 | 2.0% | 2.4 |
Source: Yahoo Finance
GNRC’s revenue growth was 10.6% TTM, versus 15.3% for HUBB, 21.4% for ETN, 10.6% for TT, 3.9% for CARR, and 2.0% for REZI. That puts Generac in the middle of the pack on growth, so I do not think the market should pay it a premium growth multiple versus HUBB or ETN. It does, however, deserve a better read than CARR or REZI because its growth is coming from a stronger base and a broader product mix.
Valuation
| Company | Current Share Price (USD) | Trailing P/E | Forward P/E | EV/Revenue | EV/EBITDA | Price/Sales (TTM) | Price/Book (mrq) | Market Cap (USD Mil) | Enterprise Value (USD Mil) | Beta (5Y Monthly) | FCF Yield % (TTM) | Forward EPS | Analyst Target Price – Low | Analyst Target Price – Mean | Analyst Target Price – High | # Analyst Opinions |
|---|---|---|---|---|---|---|---|---|---|---|---|---|---|---|---|---|
| GNRC | 186.5 | 42.9 | 14.4 | 3 | 20.6 | 2.5 | 3.8 | 11,016 | 13,126 | 1.92 | 2.6% | 13 | 215 | 287.8 | 375 | 18 |
| HUBB | 437.3 | 25.9 | 19 | 4.7 | 19.5 | 3.7 | 5.9 | 23,109 | 29,516 | 0.85 | 2.1% | 23 | 485 | 555.5 | 630 | 13 |
| ETN | 363.9 | 37 | 22.3 | 5.8 | 26.2 | 4.7 | 7 | 141,297 | 173,682 | 1.13 | 2.2% | 16.3 | 333 | 485.5 | 534 | 26 |
| TT | 445 | 33.2 | 25.2 | 4.8 | 24.8 | 4.4 | 11.4 | 97,904 | 107,044 | 1.16 | 3.2% | 17.7 | 422 | 529.1 | 575 | 23 |
| CARR | 55.6 | 40.3 | 16.8 | 2.6 | 18.7 | 2.1 | 3.5 | 46,184 | 57,925 | 1.29 | 1.9% | 3.3 | 55 | 73 | 90 | 23 |
| REZI | 17.6 | 7.4 | 8.5 | 0.8 | 7.8 | 0.3 | 1.1 | 2,666 | 6,490 | 1.50 | -71.4% | 2.1 | 20 | 29.8 | 45 | 6 |
Source: Yahoo Finance
GNRC’s 20.6x EV/EBITDA sits below ETN at 26.2x and TT at 24.8x, but above CARR at 18.7x and REZI at 7.8x. On a growth-adjusted basis, that looks reasonable rather than cheap, especially because GNRC’s 2.6% FCF yield is only middling versus peers and its 1-year total return of 5.5% trails TT’s 11.9% but beats CARR’s -4.2% and REZI’s -41.2%. The peer set tells me the market is paying for a recovery, but not for best-in-class quality.
Profitability
| Company | Operating Margin (TTM) | Net Margin (TTM) | Return on Assets (TTM) | Return on Equity (TTM) | Gross Margin (TTM) | EBITDA Margin (TTM) |
|---|---|---|---|---|---|---|
| GNRC | 17.9% | 5.8% | 4.7% | 9.5% | 39.5% | 14.3% |
| HUBB | 21.7% | 14.5% | 8.4% | 24.4% | 35.3% | 24.3% |
| ETN | 16.6% | 12.8% | 7.1% | 19.7% | 36.0% | 22.1% |
| TT | 19.3% | 13.3% | 11.0% | 36.6% | 35.4% | 19.4% |
| CARR | 13.1% | 5.5% | 3.0% | 9.0% | 24.7% | 14.0% |
| REZI | 7.9% | 5.6% | 4.6% | 15.2% | 29.2% | 10.9% |
Source: Yahoo Finance
GNRC’s 17.9% operating margin and 14.3% EBITDA margin are better than CARR’s 13.1% and 14.0%, but below HUBB’s 21.7% and 24.3% and TT’s 19.3% and 19.4%. Gross margin at 39.5% is strong relative to the group, which suggests the issue is more overhead and scale than product economics. ROE of 9.5% and ROA of 4.7% are respectable, but they are clearly mid-tier next to HUBB, ETN, and TT.
Leverage
| Company | Total Debt/Equity % (mrq) | Current Ratio (mrq) | Total Debt (mrq, USD Mil) | Net Debt/EBITDA (TTM) | FCF Margin % (TTM) |
|---|---|---|---|---|---|
| GNRC | 49 | 2 | 1,410.3 | 1.8 | 6.5% |
| HUBB | 141.6 | 1.6 | 5,556.6 | 3.4 | 8.0% |
| ETN | 105.1 | 1.2 | 21,326 | 3.1 | 10.3% |
| TT | 53.4 | 1.1 | 4,616.8 | 0.8 | 14.1% |
| CARR | 92 | 1 | 12,394 | 3.6 | 3.9% |
| REZI | 129.9 | 2.2 | 3,905 | 4 | -24.9% |
Source: Yahoo Finance
GNRC’s 49% debt/equity and 1.79x net debt/EBITDA are lighter than HUBB, ETN, CARR, and REZI, so the balance sheet is not the weak point. The trade-off is that its 6.5% FCF margin is still below TT’s 14.1% and ETN’s 10.3%, which means the company is not converting its cleaner leverage profile into superior cash generation. That is why the stock can look cheaper than some peers on earnings, yet still fail to screen as obviously cheap on cash flow.
Conclusion
I would put my rating as a Hold because the key tension is between improving earnings and only modest cash conversion. The recent quarter shows the operating rebound is real, but the stock already trades at 20.6x EV/EBITDA and 14.4x forward P/E, so the market is not waiting for proof that the recovery exists; it is waiting for proof that it can last. I think that is the right stance for now.
I would move more towards a Buy if revenue stays above 1.2B for several quarters and EBITDA remains above 264.9M, because that would show the recent step-up is becoming a durable run rate rather than a single-quarter bounce. A move toward a positive operating margin trend above the current 17.9% TTM level would also matter, because it would mean more of the gross profit is reaching the bottom line and free cash flow should follow.
I would move from Hold to Sell if revenue slips back toward the late-2025 flat pattern or if EBITDA falls back toward the 40.4M Q4 2025 level, because that would tell me the current multiple is pricing in a recovery that is not sticking. In that case, the combination of a 2.6% FCF yield and one-sided insider selling would look less like a temporary caution signal and more like a warning that the market is ahead of the fundamentals.
For now, I lean to Hold because the balance sheet is workable at 1.79x net debt/EBITDA and the product mix is broader than it was five years ago, but the company still needs a cleaner stretch of cash generation before I would call the shares a Buy. The next few quarters should show whether the Q2 2026 strength is the start of a steadier earnings base or just a better patch inside a still-volatile demand cycle.
What to Watch Next
- Revenue above 1.2B for several quarters — would support a move toward Buy.
- EBITDA staying above 264.9M — would confirm the rebound is durable.
- Operating margin trending above 17.9% — would improve free cash flow conversion.
- Net debt/EBITDA staying near 1.8x — would keep balance-sheet risk manageable.
- Insider buying replacing open-market selling — would improve conviction in management alignment.
What’s your take? I rated Generac Holdings (GNRC) HOLD above — but the goal here is to get this right, not just to publish an opinion. What would you add to this analysis, or which risk or catalyst do you think I’m under- or over-weighting? Tell me in the comments.
Sources
- SEC 10-K Annual Report — filed 2026-02-18
- SEC 8-K Filing (2026-04-29)
- SEC 8-K Filing (2026-03-25)
- SEC 8-K Filing (2026-02-11)
- SEC Form 4 Insider Transaction (2026-06-08)
- SEC Form 4 Insider Transaction (2026-06-03)
- SEC Form 4 Insider Transaction (2026-05-05)
- SEC 10-K Annual Report — FY2026
- SEC 10-K Annual Report — FY2025
- SEC 10-K Annual Report — FY2024
- SEC 10-K Annual Report — FY2023
- SEC 10-K Annual Report — FY2022
Data sourced from Yahoo Finance and SEC EDGAR. Not investment advice.
Leave a Comment