
Expected price range
Each range is a ~68% statistical band built from the stock’s own 1-year realised volatility (32% annualised), centred on the current price. Starting price $27.59 (close 2026-10-21). This is an illustration of where our view and normal volatility point, not a forecast, price target or investment advice; the stock can move outside it.
| Company | Oct 25 | Nov 25 | Dec 25 | Jan 26 | Feb 26 | Mar 26 | Apr 26 | May 26 | Jun 26 | Jul 26 | Aug 26 | Sep 26 | 12-Mo |
|---|---|---|---|---|---|---|---|---|---|---|---|---|---|
| CPRT | -4% | -9% | +0% | +4% | -6% | -13% | -0% | -1% | -14% | +3% | +13% | -17% | -39% |
| RBA | -8% | -1% | +5% | +10% | -11% | -5% | +9% | +2% | +9% | -6% | -23% | -4% | -24% |
| VRRM | -6% | -6% | +3% | -14% | -13% | -14% | +4% | -70% | -6% | +24% | -16% | -30% | -87% |
| CAR | -15% | -0% | -6% | -10% | -15% | +50% | +24% | -3% | -16% | -7% | +7% | -28% | -34% |
| UHAL | -7% | -1% | -4% | +12% | -10% | -6% | +7% | +13% | +13% | +8% | -5% | -11% | +5% |
| CTAS | -11% | +2% | +1% | +2% | +5% | -16% | +3% | -2% | -1% | +20% | -1% | -3% | -4% |
Source: Yahoo Finance monthly adjusted close.
Quick Thesis
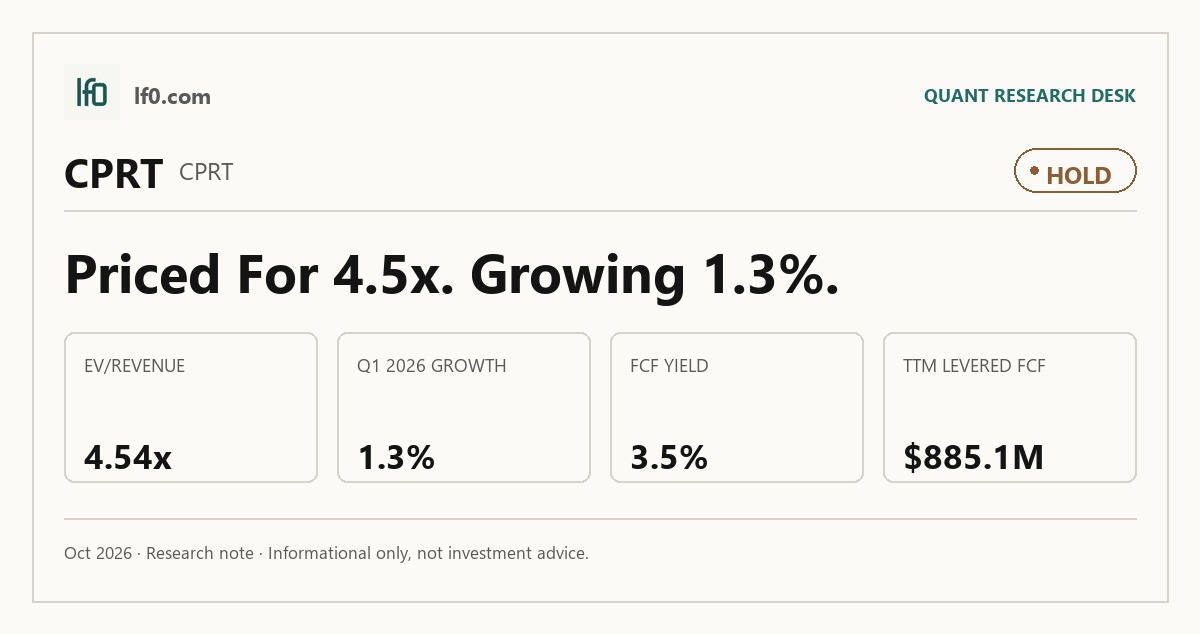
- Rated Hold — quality is high, but growth is only 2.4% TTM.
- Strongest support is cash generation: $885.1M levered free cash flow TTM.
- Main risk is insider selling: 10 open-market sales and 0 purchases.
- Valuation is fair, not cheap: 11.3x EV/EBITDA and 4.5x EV/Revenue.
- I would move toward Buy if revenue growth stays above 8.0% for two quarters.
Executive Summary
Rating: HOLD | CPRT
We’ll begin tracking this call’s performance since publication once sufficient adjusted-close data is available.
I would put my rating as a Hold because Copart combines a 32.0% operating margin with negative 2.4x net debt to EBITDA, but the stock already trades at 4.5x EV/Revenue and 17.8x trailing P/E, so the market is paying for quality before it pays for faster growth. In my view, the key tension is that the business still throws off cash, yet 2.4% TTM revenue growth is too slow to justify a rerating on its own. I would raise my rating more toward a Buy if revenue growth moves back above 8.0% year over year for two straight quarters, meaning the platform is re-accelerating rather than just defending its base.
Company Profile
Copart was incorporated in California in 1982, went public in 1994, and reincorporated in Delaware in January 2012. It runs an online vehicle auction and remarketing platform that earns most of its revenue from auction and auction-related fees, including listing, selling, storage, transportation, title processing, and loading charges. In the U.K. and parts of Europe, it also buys salvage vehicles outright and resells them for its own account.
The company operates in the U.S., U.K., Germany, Brazil, Canada, the U.A.E., Spain, Finland, Oman, the Republic of Ireland, and Bahrain. It has 11,700 employees and more than 100 vehicle inspection stations, and it continues to extend a network that began with a single site in Vallejo, California. Copart is listed on Nasdaq under CPRT and funds the business primarily through operating cash flow, with a large cash balance as a strategic buffer.
Economic Moat
Business Model
Copart’s moat is built on network depth, not just on physical yards. Its VB3 online auction platform reaches registered buyers globally, supports real-time bidding, and is protected by a patent issued in 2008 covering aspects of the virtual bidding system. In my view, that software layer is harder to replicate quickly than a yard network alone because a competitor would need both buyer liquidity and the technology stack to match Copart’s auction depth.
The scale effects are visible in the buyer base and logistics. Copart had about 1 million registered members in fiscal 2024, and 68.4% of U.S. vehicles sold to members registered outside the state, which shows that the platform can pull demand across borders rather than relying on local buyers. Over 100 inspection stations, direct DMV title-processing links in multiple states, and a transportation network that can pick up most vehicles within 24 hours all reduce friction for insurers and other sellers.
The business has also broadened beyond core salvage. National Powersport Auctions, Purple Wave, and Copart Recycling in the U.K. widen the addressable market and let the company monetize more vehicle and equipment types without changing the core auction model. That matters because the moat is not just the auction engine itself; it is the combination of software, logistics, and seller relationships that makes the platform useful at scale.
Business & Operating Risks
The most material disclosed risk is supply concentration. According to the risk factors in Copart’s SEC 10-K, a limited number of vehicle sellers have historically accounted for a substantial portion of revenue, and a reduction in vehicles from a significant seller or a change in contract terms could hurt results. That risk goes straight at the moat because the platform only compounds if vehicle inflows keep rising.
International execution is the second risk I would watch. The filing highlights localization, foreign exchange, tariffs, trade barriers, and the possibility that the German expansion may heighten execution risk. Copart has built a broader footprint abroad, but that also means the company must keep proving that its U.S. model travels well across different legal and operating environments.
Cybersecurity is more than a generic disclosure here because the auction platform is the product. The 10-K notes that a new or undetected virus could disrupt service, and it also says one subsidiary suffered a ransomware attack in March 2023. That incident did not break the group, but it shows the platform has already been tested.
The DOJ money-laundering investigation tied to auction-platform members is another specific overhang. It targets the trust layer of the marketplace, which is central to the moat, even if the financial impact is not yet quantified. Taken together, these risks do not yet appear to be breaking the structural advantage, but they do pressure the same network and trust system that makes the model valuable.
Management Discussion & Analysis
Management is responding to those risks mainly by keeping the balance sheet flexible and continuing to expand the network. The company has said it expects to acquire and develop facilities in new regions, and the revolver remained undrawn, which tells me growth is still being funded from internal cash rather than from balance-sheet stress. That is the right response to concentration and execution risk: preserve liquidity, keep adding capacity, and avoid forcing the model.
The numbers support that stance. Service revenues rose 11.3% in fiscal 2024 and yard operating expenses rose 12.7%, so the company is still scaling the platform even as costs rise with it. That is not a margin-break story; it is a reminder that Copart is investing to keep the network dense enough to preserve its auction advantage.
Management has also been disciplined on capital allocation. It did not repurchase shares in fiscal 2024, 2023, or 2022, which suggests buybacks are not the priority while the company keeps building out facilities and preserving optionality. In my view, that is sensible, but it also means investors should not expect capital returns to be the main driver of the thesis.
Recent Events
The most important recent event was the March 8, 2024 leadership transition, disclosed on March 12, 2024, when A. Jayson Adair moved from co-Chief Executive Officer to Executive Chair and Jeffrey Liaw became sole Chief Executive Officer and a board member. I see that as a governance-positive change because it formalizes succession without disrupting the operating model, which supports continuity in a business that depends on execution and seller trust.
The November 21, 2024 first-quarter fiscal 2025 earnings release did not point to a strategic reset, and I do not see a new acquisition, divestiture, financing amendment, or regulatory shock in the recent 8-Ks. That matters because the moat thesis is still being driven by steady operating execution rather than by a one-time corporate event.
The December 6, 2024 annual meeting was largely routine: directors were elected, executive pay was approved, and Ernst & Young LLP was ratified as auditor. On balance, the recent filings reinforce continuity more than change, and the only material signal is that the company is still executing through the same platform-led model.
Financial Analysis
Growth
CPRT — Financial Growth (Quarterly, USD Mil)
| Metric | 2025-04-30 | 2025-07-31 | 2025-10-31 | 2026-01-31 | 2026-04-30 | 2026-07-31 |
|---|---|---|---|---|---|---|
| REVENUE (USD Mil) | 1,211.7 | 1,125.1 | 1,155 | 1,121.7 | 1,237.1 | — |
| EBIT (USD Mil) | 451.5 | 412.6 | 430.7 | 388.7 | 464.3 | — |
| EBITDA (USD Mil) | 506.1 | 466.7 | 484.9 | 444.2 | 523.4 | — |
| NET INCOME (USD Mil) | 406.6 | 396.4 | 403.7 | 350.7 | 402.4 | — |
| DILUTED EPS | — | 0.4 | 0.4 | 0.4 | 0.4 | 0.3 |
Source: Yahoo Finance — Quarterly Financial Statements
Revenue was $1.2B in 2026-04-30, up from $1.2B a year earlier, while EBITDA rose to $523.4M and EBIT to $464.3M. The latest quarter is better than the prior-year base, but the broader picture is still modest: 2.4% TTM revenue growth is slow for a business that depends on scale, and that is why I do not treat the recent quarter as proof of a new growth phase.
Net income was $402.4M in 2026-04-30 versus $406.6M a year earlier, so earnings are holding up even as top-line growth stays restrained. That combination tells me the model is still efficient, but it also means the stock needs either faster volume growth or a higher mix of fee income to justify a rerating.
Profitability
CPRT — Profitability (TTM)
| Metric | TTM |
|---|---|
| Operating Margin (TTM) | 32.0% |
| Net Margin (TTM) | 31.8% |
| Return on Assets (TTM) | 10.3% |
| Return on Equity (TTM) | 16.2% |
| Gross Margin (TTM) | 45.3% |
| EBITDA Margin (TTM) | 40.0% |
Source: Yahoo Finance — Trailing Twelve Months (TTM)
TTM operating margin was 32.0%, net margin was 31.8%, gross margin was 45.3%, EBITDA margin was 40.0%, ROA was 10.3%, and ROE was 16.2%. Those are strong margins by any reasonable standard, and they fit the moat: Copart’s platform can turn a large share of gross profit into operating profit because the network is already scaled.
The gap between gross margin and operating margin is 13.3 points, which shows the company still carries meaningful operating expense, but not enough to undermine the model. ROE also exceeds ROA by 5.9 points, so capital structure helps returns, yet the return profile is still fundamentally driven by operating efficiency rather than leverage.
Valuation
CPRT — Valuation Multiples
| Metric | Value |
|---|---|
| Current Share Price (USD) | 27.6 |
| Market Cap (USD Mil) | 25,553 |
| Enterprise Value (USD Mil) | 21,168 |
| Trailing P/E | 17.8 |
| Forward P/E | 15.2 |
| Price/Sales (TTM) | 5.5 |
| Price/Book (mrq) | 2.8 |
| EV/Revenue | 4.5 |
| EV/EBITDA | 11.3 |
| Beta (5Y Monthly) | 1.06 |
| FCF Yield % (TTM) | 3.5% |
| Forward EPS (USD) | 1.8 |
| Analyst Target Price – Low (USD) | 25 |
| Analyst Target Price – Mean (USD) | 39 |
| Analyst Target Price – High (USD) | 55 |
| # Analyst Opinions | 10 |
Source: Yahoo Finance
Copart trades at 4.5x EV/Revenue, 11.3x EV/EBITDA, 17.8x trailing P/E, and 15.2x forward P/E, with a 3.5% FCF yield and a current share price of $27.6. I read that as a fair valuation for a high-quality business, not a cheap one, because the multiple already reflects the company’s margin profile and balance-sheet strength.
With 10 analyst opinions, the target range runs from $25 to $55 and the mean is $39. My own fair-value range is $15.2-$33.8 per share based on peer EV/Revenue and Copart’s cash-rich balance sheet, so the current price sits inside that band and below the consensus mean. That tells me the market is not ignoring the company’s quality, but it is also not pricing in a major growth surprise.
Forward EPS is 1.8 for Copart. That is below the larger, higher-earnings peers in the comp set, which is why I do not think the stock deserves a premium on earnings power alone; the case rests more on durable cash conversion and balance-sheet flexibility than on absolute EPS scale.
Leverage
CPRT — Leverage & Coverage (Quarterly)
| Metric | Value |
|---|---|
| Total Debt/Equity % (mrq) | 1 |
| Current Ratio (mrq) | 7.9 |
| Total Debt (mrq, USD Mil) | 88.4 |
| Operating Cash Flow (TTM, USD Mil) | 1,604.5 |
| Levered Free Cash Flow (TTM, USD Mil) | 885.1 |
| Net Debt/EBITDA (TTM) | -2.4 |
| FCF Margin % (TTM) | 19.0% |
Source: Yahoo Finance — Quarterly Financial Statements
Copart’s leverage profile is a clear strength. Total debt to equity is 1.0%, current ratio is 7.9x, total debt is $88.4M, and net debt to EBITDA is -2.4x, which means cash more than offsets debt. Operating cash flow was $1.6B TTM and levered free cash flow was $885.1M TTM, so the company has real financial flexibility.
The 19.0% FCF margin reinforces that point. I do not see refinancing risk as a near-term issue because the company is net cash and liquid, but I would watch for any sustained drop in free cash flow margin toward the low teens, since that would weaken the cushion that currently supports the valuation.
Insider Activity
The insider record is one-sided: 10 open-market sales and 0 open-market purchases from 2025-01-02 to 2026-04-15. The selling is concentrated in a few names, led by Jeffrey Liaw and several directors, so it is not a broad panic signal, but it is still a clear negative when there is no offsetting buying.
I do not think this changes the moat, but it does matter for sentiment. When insiders are selling into a stock that already trades at a premium multiple, I want to see stronger growth before I give the market the benefit of the doubt.
Comparable Analysis
LF0 has published standalone analyses of these peers: Verra Mobility (VRRM) (rated Hold); Avis Budget (CAR) (rated Buy).
Growth
| Company | Revenue TTM (USD Mil) | Revenue Growth YoY % | EBITDA TTM (USD Mil) | Diluted EPS TTM |
|---|---|---|---|---|
| CPRT | 4,666.2 | 2.4% | 1,866.3 | 1.6 |
| RBA | 4,847.8 | 11.1% | 1,323 | 2.3 |
| VRRM | 1,007 | 11.7% | 357.9 | 0.3 |
| CAR | 11,711 | -1.3% | 1,539 | -18.1 |
| UHAL | 6,089.4 | 3.2% | 760.1 | 0.1 |
| CTAS | 11,560.6 | 10.9% | 3,104.7 | 5.1 |
Source: Yahoo Finance
Copart’s 2.4% TTM revenue growth is the slowest in the peer set, versus RBA at 11.1%, VRRM at 11.7%, UHAL at 3.2%, and CTAS at 10.9%, while CAR is down 1.3%. That slower growth is the main reason the market should not pay Copart the same growth multiple as the faster-growing peers, even though Copart is the largest revenue base at $4.7B TTM.
Valuation
| Company | Current Share Price (USD) | Trailing P/E | Forward P/E | EV/Revenue | EV/EBITDA | Price/Sales (TTM) | Price/Book (mrq) | Market Cap (USD Mil) | Enterprise Value (USD Mil) | Beta (5Y Monthly) | FCF Yield % (TTM) | Forward EPS | Analyst Target Price – Low | Analyst Target Price – Mean | Analyst Target Price – High | # Analyst Opinions |
|---|---|---|---|---|---|---|---|---|---|---|---|---|---|---|---|---|
| CPRT | 27.6 | 17.8 | 15.2 | 4.5 | 11.3 | 5.5 | 2.8 | 25,553 | 21,168 | 1.06 | 3.5% | 1.8 | 25 | 39 | 55 | 10 |
| RBA | 82 | 35.3 | 16.9 | 4.1 | 15 | 3.2 | 2.7 | 15,277 | 19,840 | 0.53 | 4.0% | 4.9 | 104 | 128.8 | 152 | 11 |
| VRRM | 3 | 10.9 | 3.1 | 1.5 | 4.1 | 0.4 | 2 | 448 | 1,479 | 0.42 | 9.7% | 0.9 | 5 | 6.4 | 10 | 5 |
| CAR | 98.4 | — | 18.4 | 2.8 | 20.9 | 0.3 | -1 | 3,476 | 32,204 | 2.11 | 31.4% | 5.3 | 94 | 122.9 | 160 | 7 |
| UHAL | 55.8 | 398.3 | 26.8 | 2.9 | 23.3 | 1.8 | 1.4 | 10,839 | 17,735 | 1.11 | -14.8% | 2.1 | 74 | 87.7 | 99 | 3 |
| CTAS | 220.1 | 43.4 | 35.7 | 7.8 | 28.9 | 7.6 | 16.9 | 87,416 | 89,763 | 0.92 | 2.0% | 6.2 | 181 | 218.3 | 250 | 16 |
Source: Yahoo Finance
Copart trades at 4.5x EV/Revenue, 11.3x EV/EBITDA, 17.8x trailing P/E, and 15.2x forward P/E, which puts it below CTAS on every major multiple and above VRRM on most of them. RBA is slightly cheaper on EV/Revenue at 4.1x but richer on trailing P/E at 35.3x, while CTAS commands 7.8x EV/Revenue and 35.7x forward P/E; in my view, Copart’s valuation is reasonable because the market is paying for quality, not for growth acceleration.
The peer-implied range from EV/Revenue is roughly $15.2-$33.8 per share, and that brackets the current price of $27.6. I would not call that a discount, but I also would not call it stretched given Copart’s stronger balance sheet than RBA, CAR, or UHAL. The market is giving Copart credit for quality, yet not enough credit to assume a faster growth path.
Profitability
| Company | Operating Margin (TTM) | Net Margin (TTM) | Return on Assets (TTM) | Return on Equity (TTM) | Gross Margin (TTM) | EBITDA Margin (TTM) |
|---|---|---|---|---|---|---|
| CPRT | 32.0% | 31.8% | 10.3% | 16.2% | 45.3% | 40.0% |
| RBA | 17.7% | 10.0% | 4.1% | 8.1% | 45.8% | 27.3% |
| VRRM | 27.2% | 4.4% | 9.2% | 15.4% | 55.7% | 35.5% |
| CAR | 14.9% | -5.4% | 2.7% | — | 27.4% | 13.1% |
| UHAL | 15.1% | 1.0% | 1.3% | 0.8% | 28.5% | 12.5% |
| CTAS | 24.1% | 17.8% | 16.7% | 41.4% | 51.0% | 26.9% |
Source: Yahoo Finance
Copart’s 32.0% operating margin and 31.8% net margin are above RBA’s 17.7% and 10.0%, UHAL’s 15.1% and 1.0%, and CAR’s 14.9% and -5.4%. Its 40.0% EBITDA margin also leads most of the group, which tells me the platform is converting scale into profit more effectively than most peers.
CTAS still posts the strongest ROE at 41.4%, but Copart’s 16.2% ROE and 10.3% ROA are solid without requiring heavy leverage. That is important because the profitability edge is real, but it is not so extreme that it overwhelms the slower growth profile.
Leverage
| Company | Total Debt/Equity % (mrq) | Current Ratio (mrq) | Total Debt (mrq, USD Mil) | Operating Cash Flow TTM (USD Mil) | Free Cash Flow TTM (USD Mil) | Net Debt/EBITDA (TTM) | FCF Margin % (TTM) |
|---|---|---|---|---|---|---|---|
| CPRT | 1 | 7.9 | 88.4 | 1,604.5 | 885.1 | -2.4 | 19.0% |
| RBA | 77.6 | 1.3 | 4,695.5 | 860.7 | 603.6 | 3.2 | 12.4% |
| VRRM | 486.4 | 2.1 | 1,087.7 | 214.9 | 43.3 | 2.9 | 4.3% |
| CAR | — | 0.8 | 29,125 | 2,906 | 1,093.1 | 18.6 | 9.3% |
| UHAL | 106.3 | 1 | 8,145 | 1,826.5 | -1,604.8 | 9.3 | -26.4% |
| CTAS | 52.1 | 1.5 | 2,711.4 | 2,434.1 | 1,744 | 0.8 | 15.1% |
Source: Yahoo Finance
Copart’s 1.0% debt to equity, 7.9x current ratio, and -2.4x net debt to EBITDA are far stronger than RBA’s 77.6%, 1.3x, and 3.2x, and much better than UHAL’s 106.3%, 1.0x, and 9.3x. The company’s $4.5B cash balance more than covers its $88.4M debt, so leverage is a source of flexibility rather than a constraint.
That balance-sheet strength helps explain why Copart can trade at a premium to more levered peers even with slower growth. In other words, the market is paying for safety and cash conversion, not just for the business itself.
Conclusion
I would put my rating as a Hold because Copart’s moat is intact, but the stock already reflects much of the quality premium while growth remains only 2.4% TTM. The company is still producing strong margins, $885.1M of levered free cash flow TTM, and a net cash balance sheet, so the core business is not under pressure; the issue is that the numbers do not yet justify a higher multiple.
The bull case is straightforward: if revenue growth moves back above 8.0% year over year for two straight quarters, meaning the platform is re-accelerating rather than merely holding share, I would become more constructive. I would also want EBITDA margin to stay above 40.0% and free cash flow to remain near the current $885.1M TTM run rate, because that would show Copart can grow without sacrificing the cash conversion that supports the thesis.
The bear case is just as clear. If revenue growth slips below 0.0% year over year for a full quarter, meaning the platform is no longer expanding, or if operating margin falls under 30.0%, I would move from Hold toward Sell because the premium valuation would no longer be backed by the operating profile. A sustained drop in free cash flow margin from 19.0% toward the low teens would be another warning sign, since it would weaken the cash cushion that currently makes the balance sheet such a strength.
For now, I lean to the cautious side because the stock already prices in a lot of durability, while the growth profile has not yet proven to me that it deserves a rerating. I am not bearish enough to call it a Sell, but I do think investors should wait for faster top-line growth before paying up again.
What to Watch Next
- Revenue growth above 8.0% for two quarters — would support a move toward Buy.
- Operating margin staying above 30.0% — would confirm the cost base is still under control.
- Free cash flow margin near 19.0% — would preserve the cash cushion behind the valuation.
- Net debt to EBITDA staying negative — would keep leverage a non-issue.
- Insider buying replacing open-market sales — would improve sentiment around the stock.
What’s your take? I rated Copart (CPRT) HOLD above — but the goal here is to get this right, not just to publish an opinion. What would you add to this analysis, or which risk or catalyst do you think I’m under- or over-weighting? Tell me in the comments.
Sources
- SEC 10-K Annual Report — filed 2024-09-30
- SEC 8-K Filing (2024-12-12)
- SEC 8-K Filing (2024-11-21)
- SEC 8-K Filing (2024-09-04)
- SEC 8-K Filing (2024-05-16)
- SEC 8-K Filing (2024-03-12)
- SEC 8-K Filing (2024-02-22)
- SEC Form 4 Insider Transaction (2026-04-17)
- SEC Form 4 Insider Transaction (2026-01-22)
- SEC Form 4 Insider Transaction (2026-01-16)
- SEC 10-K Annual Report — FY2024
- SEC 10-K Annual Report — FY2023
- SEC 10-K Annual Report — FY2022
- SEC 10-K Annual Report — FY2021
- SEC 10-K Annual Report — FY2020
Data sourced from Yahoo Finance and SEC EDGAR. Not investment advice.
Leave a Comment