Expected price range
Each range is set from the stock’s recent price history and our Hold rating, using its own 1-year realised volatility (32% annualised) as the width of a ~68% statistical band, and checked against that rating so the range leans the same way as our view. Starting price $13.91 (close 2026-10-28). The stock traded between $12.58 and $16.67 over the last 6 months and between $12.58 and $20.02 over the last year. This is an illustration of where our view and normal volatility point, not a forecast, price target or investment advice; the stock can move outside it.
| Company | Oct 25 | Nov 25 | Dec 25 | Jan 26 | Feb 26 | Mar 26 | Apr 26 | May 26 | Jun 26 | Jul 26 | Aug 26 | Sep 26 | 12-Mo |
|---|---|---|---|---|---|---|---|---|---|---|---|---|---|
| CAG | -4% | +4% | -3% | +9% | +4% | -18% | -6% | -7% | +1% | +9% | +10% | -16% | -21% |
| CPB | -3% | +1% | -9% | +2% | -4% | -17% | -5% | +2% | +5% | +0% | +8% | -16% | -33% |
| GIS | -6% | +2% | -2% | +1% | -2% | -18% | -4% | -4% | +3% | +5% | +15% | -22% | -32% |
| KHC | -5% | +5% | -5% | -2% | +4% | -7% | +1% | +6% | +0% | +9% | -1% | -10% | -7% |
| SJM | -5% | +2% | -6% | +7% | +12% | -17% | +2% | +6% | +9% | +6% | +11% | -9% | +14% |
| HRL | -12% | +8% | +2% | +5% | +4% | -12% | -4% | +8% | +7% | +2% | -13% | -9% | -15% |
Source: Yahoo Finance monthly adjusted close.
Quick Thesis
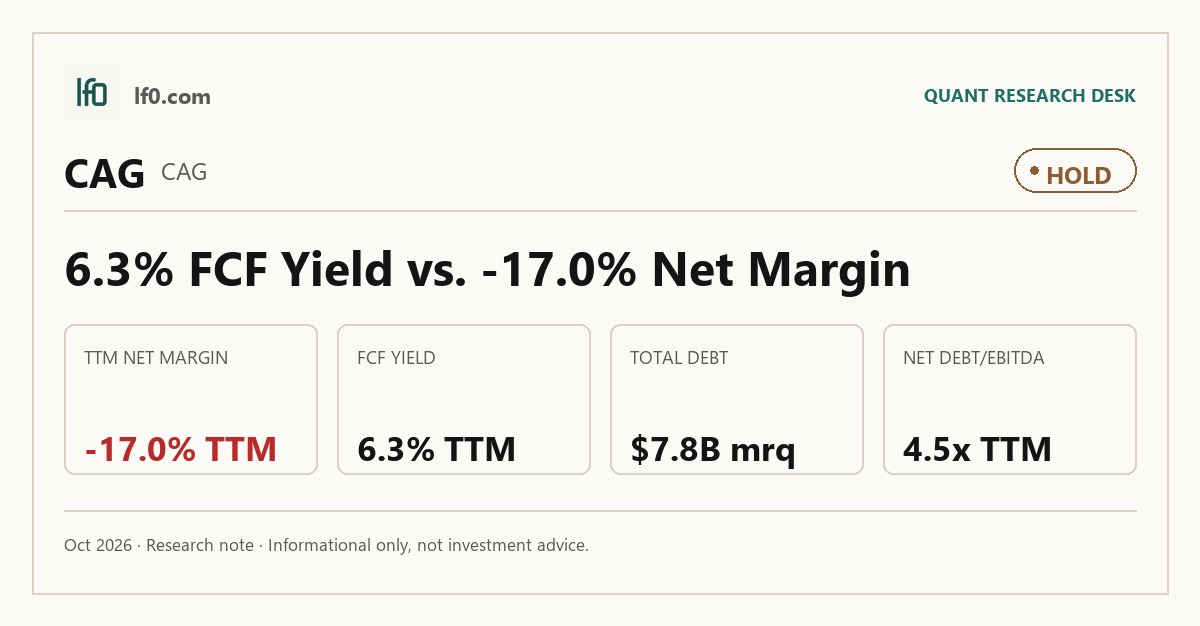
- Hold — cash support offsets weak earnings conversion.
- Strongest strength: 6.3% FCF yield on $11.2B TTM revenue.
- Biggest risk: 4.5x net debt/EBITDA with a -17.0% net margin.
- Valuation is fair at 8.6x EV/EBITDA versus mixed peers.
- I would move toward Buy if net margin turns positive for two quarters.
Executive Summary
Rating: HOLD | CAG
Measured from adjusted close on 2026-10-28 to 2026-10-28. Sell ratings are correct when the stock falls; Hold is tracked as a +/-10% range. Daily-close data, not intraday. Calls are tracked for 182 days from publication, then frozen as a final record.
I would put my rating as a Hold because Conagra’s branded portfolio still supports cash generation, but the latest numbers do not show a durable earnings reset. The company’s 6.3% TTM free cash flow yield and 8.6x EV/EBITDA give the stock enough support to avoid a bearish call, yet the -17.0% TTM net margin and 4.5x net debt/EBITDA keep me from calling it cheap enough for a Buy. In my view, the key tension is that the franchise is stable while the equity still depends on margin repair that has not fully shown up in the numbers.
I would raise my rating more toward a Buy if net margin turns positive and stays there for two consecutive quarters, because that would show pricing, mix, and cost control are finally working together. If that improvement also lifts FCF margin from 3.7% toward the mid-single digits, the current cash yield would look more durable and the balance sheet would have more room to improve.
Company Profile
Conagra Brands is a branded food company that sells shelf-stable, refrigerated, frozen, and foodservice products through retail, wholesale, club, convenience, restaurant, school, healthcare, and government channels. Its brands include Birds Eye, Duncan Hines, Healthy Choice, Marie Callender’s, Reddi-wip, Slim Jim, and Angie’s BOOMCHICKAPOP, and it also sells licensed products under names such as P.F. Chang’s, Bertolli, Wendy’s, and Libby’s. Headquartered in Chicago, the company had about 18,500 employees as of May 26, 2024, and it operates globally through its International segment. Conagra is listed on the New York Stock Exchange under CAG.
Economic Moat
Business Model
The branded portfolio is the core structural advantage, because Conagra’s shelf-stable, refrigerated, frozen, international, and foodservice brands sit inside long-lived consumer habits and retailer shelf space that a new entrant cannot rebuild quickly. In my view, the strongest evidence is the company’s reach across Birds Eye, Duncan Hines, Healthy Choice, Marie Callender’s, Reddi-wip, Slim Jim, and Angie’s BOOMCHICKAPOP, plus licensed brands such as P.F. Chang’s, Bertolli, Wendy’s, and Libby’s, which makes replacement costly for both retailers and consumers. A second layer of protection comes from intellectual property and brand licensing, since some licenses are perpetual while others must be renewed, and Conagra also owns trademarks such as Alexia and Marie Callender’s that it licenses to third parties. Scale in procurement and manufacturing helps too, but I see that as support for the moat rather than the moat itself.
The business has also become easier to manage as a pure-play branded food operator. The current four-segment structure is cleaner than the more acquisition-heavy profile that followed Pinnacle Foods, and that matters because it gives management a more focused platform for pricing, mix, and portfolio decisions. I also note that the company still relies on a heavy operating base, with about 18,500 employees and 46% covered by collective bargaining agreements, so the moat is not a software-like asset-light model; it is a brand-and-distribution franchise that has to be defended every quarter. That is still a real moat in packaged food, and the current structure makes it easier to protect than it was several years ago.
Business & Operating Risks
The most material disclosed risk is leverage. As of May 26, 2024, Conagra had $7.8B of total debt, and the filing says that debt can require a substantial portion of operating cash flow for debt service, limit share repurchases and dividends, and raise refinancing costs if credit quality weakens. That risk is already visible in the numbers: net debt/EBITDA is 4.5x, so the company has room to operate, but not much room for a sustained earnings slip.
Input-cost inflation is the next major threat, and it is especially relevant for a branded food company that cannot fully pass through every cost increase immediately. Conagra does not fully hedge commodity prices, and it uses derivatives for grains, vegetable oils, pork, dairy products, and energy, so gross margin and net earnings can swing when pricing lags cost inflation. The company’s current margin profile shows why that matters: the business is still absorbing cost pressure below the gross line rather than eliminating it.
Customer concentration is another real pressure point. Walmart and its affiliates accounted for about 28% of consolidated net sales in fiscal 2024, and larger retailers can demand lower pricing, more promotions, or private-label shelf space. That is a direct threat to the shelf-space advantage described above, because the moat depends on retailer access as much as on brand recognition. If a major customer pushes harder on price or mix, the brand franchise can still hold, but the economics of that franchise weaken.
The disclosed risks do not break the moat, but they do test it. In my view, leverage and retailer concentration are the two risks most likely to erode the managed-brand advantage if margins stay weak for too long.
Management Discussion & Analysis
Management is signaling caution rather than aggression, and that is the right response to the leverage and margin risks above. Fiscal 2025 capital expenditures are expected to be about $500M, which tells me the company is still funding the base business and not leaning on a large expansion program to drive earnings. The company also has $916.6M of remaining share repurchase authorization, but no shares were repurchased in fiscal 2024, so buybacks remain optional rather than a near-term priority.
The refinancing work is more important than the capital-return language. Conagra used commercial paper and a $300M term loan to repay the $1B senior notes due May 1, 2024, which pushed out maturity pressure but did not reduce leverage. That is a sensible liquidity move, yet it also shows management is still managing the balance sheet around debt service rather than from a position of excess cash. The operating tone is constructive, but the reported results still lag that tone: fiscal 2024 net sales fell 1.8% and diluted EPS dropped to $0.72 from $1.42, so the recovery story is still incomplete.
I also think the dividend policy matters here. The quarterly dividend was raised to $0.35 per share on April 11, 2024 and then maintained, which signals confidence in cash generation, but it also leaves less room for error if margins do not improve. Management is actively responding to the leverage risk through refinancing and cash discipline, but the margin risk is still unresolved in the numbers.
Recent Events
The most important recent development is the governance reset on 2024-09-18, when shareholders approved officer exculpation and the board removed obsolete staggered-board language. That does not change the operating model, but it does modestly reduce governance friction and supports a steadier capital-allocation framework.
The 2024-05-15 bylaw amendments are the other notable structural change, because they let shareholders call special meetings and update advance notice rules. I do not read the recent 8-Ks as a strategic break; instead, they show continuity in execution and no disclosed acquisition, divestiture, or financing event that would materially alter the moat thesis. In that sense, the recent filings reinforce stability more than they create a new catalyst.
Financial Analysis
Growth
CAG — Financial Growth (Quarterly, USD Mil)
| Metric | 2025-08-31 | 2025-11-30 | 2026-02-28 | 2026-05-31 | 2026-08-31 |
|---|---|---|---|---|---|
| REVENUE (USD Mil) | 2,632.6 | 2,979.1 | 2,787.8 | 2,882.1 | 2,595.9 |
| EBIT (USD Mil) | 385.5 | -555.5 | 323.2 | -1,587.5 | 326 |
| EBITDA (USD Mil) | 480.8 | -458.5 | 424.6 | -1,485.2 | 423.9 |
| NET INCOME (USD Mil) | 164.5 | -663.6 | 199.8 | -1,616.9 | 174.3 |
| DILUTED EPS | 0.3 | -1.4 | 0.4 | -3.4 | 0.4 |
Source: Yahoo Finance — Quarterly Financial Statements
Revenue moved from $2.6B in Q1 2026 to $2.9B in Q2 2026, then back to $2.6B in Q3 2026, so the top line is choppy rather than steadily compounding. The cleanest year-over-year read is Q3 2026 revenue of $2.6B versus $2.6B in Q3 2025, essentially flat, while EBITDA swung from $423.9M to -$1.5B in the prior quarter and net income from $174.3M to -$1.6B, which means earnings are far more volatile than sales. That volatility is consistent with a packaged-food business facing pricing and cost pressure rather than a clean demand collapse, but it also means the current valuation is not being backed by accelerating growth.
Profitability
CAG — Profitability (TTM)
| Metric | TTM |
|---|---|
| Operating Margin (TTM) | 11.6% |
| Net Margin (TTM) | -17.0% |
| Return on Assets (TTM) | 4.1% |
| Return on Equity (TTM) | -24.9% |
| Gross Margin (TTM) | 23.8% |
| EBITDA Margin (TTM) | 14.7% |
Source: Yahoo Finance — Trailing Twelve Months (TTM)
TTM gross margin was 23.8%, EBITDA margin was 14.7%, operating margin was 11.6%, and net margin was -17.0%. The spread from gross to operating margin is 12.3 percentage points, which tells me the core product economics are intact but overhead, interest, and other below-gross costs still absorb a large share of revenue. EBITDA sits 3.1 points above operating margin, so depreciation and amortization are not the main issue; the bigger drag is the step down from operating profit to net loss, which points to financing and non-operating charges still overwhelming the business.
ROA was 4.1% while ROE was -24.9%, and that gap shows returns are not being driven by durable equity profitability. A negative ROE alongside positive ROA usually means leverage and below-the-line costs are distorting the equity result, so I would weight operating and EBITDA margins more heavily than net income until the net margin closes toward breakeven. The key threshold to watch is a positive net margin, because that would show the company is finally converting operating profit into shareholder earnings.
Valuation
CAG — Valuation Multiples
| Metric | Value |
|---|---|
| Current Share Price (USD) | 13.9 |
| Market Cap (USD Mil) | 6,648 |
| Enterprise Value (USD Mil) | 14,187 |
| Trailing P/E | — |
| Forward P/E | 9.3 |
| Price/Sales (TTM) | 0.6 |
| Price/Book (mrq) | 1 |
| EV/Revenue | 1.3 |
| EV/EBITDA | 8.6 |
| Beta (5Y Monthly) | 0 |
| FCF Yield % (TTM) | 6.3% |
| Forward EPS (USD) | 1.5 |
| Analyst Target Price – Low (USD) | 11 |
| Analyst Target Price – Mean (USD) | 13.7 |
| Analyst Target Price – High (USD) | 16 |
| # Analyst Opinions | 15 |
Source: Yahoo Finance
Conagra trades at 1.26x EV/Revenue and 0.591x Price/Sales, which is the cleanest read here because trailing earnings are not usable and the business is being valued on sales rather than profit. At a current share price of $13.9, the market is paying about $0.59 for each dollar of annual sales, so the stock is pricing in a low-growth, low-margin packaged-food profile rather than a reacceleration. EV/EBITDA is 8.6x, which implies investors are still assigning value to the company’s cash earnings power even though net income is negative on a TTM basis.
Forward P/E is 9.3x on forward EPS of 1.5, so the market is assuming earnings normalize from the current loss and that management can convert sales into profit again. PEG ratio is 10.9x, which is rich for a business with this kind of mature profile and suggests the market is not paying for much growth. Beta is 0.0, but I would treat that as a limited signal rather than a true measure of defensiveness, because the more useful evidence here is the combination of cash yield and earnings quality. FCF yield is 6.3%, which is supportive but not enough on its own to offset the weak margin profile.
On the analysis here, I would put fair value in a range of about $11-$16 per share. That range sits close to the $13.7 analyst mean and inside the broader $11–$16 analyst target band, so there is no major disagreement with consensus; the market is already near the center of that range. I would not pay much above the top end unless margins improve, because the current leverage profile means growth has to translate into cash, not just sales.
Using the peer EV/Revenue range of 1.1x to 2.2x on CAG’s $11.2B of TTM revenue gives an implied enterprise value of about $12.5B to $25.2B; after netting CAG’s $7.4B of debt less $0.4B of cash and dividing by 477.4M shares, that implies roughly $10.4 to $37.2 per share. I would not anchor on the top of that range, because CAG’s weaker growth and negative TTM EPS of -$4 make the higher multiples look too generous relative to peers. On earnings, the implied EPS path is roughly $1.5 forward versus peers such as CPB at $1.8, GIS at $3.2, KHC at $2.1, SJM at $11, and HRL at $1.6, which leaves CAG looking cheaper than the premium growers but not obviously mispriced on a like-for-like basis.
Leverage
CAG — Leverage & Coverage (Quarterly)
| Metric | Value |
|---|---|
| Total Debt/Equity % (mrq) | 121.2 |
| Current Ratio (mrq) | 1.1 |
| Total Debt (mrq, USD Mil) | 7,760.1 |
| Operating Cash Flow (TTM, USD Mil) | 1,277.3 |
| Levered Free Cash Flow (TTM, USD Mil) | 419.6 |
| Net Debt/EBITDA (TTM) | 4.5 |
| FCF Margin % (TTM) | 3.7% |
Source: Yahoo Finance — Quarterly Financial Statements
Total debt is $7.8B against a current ratio of 1.1x and total debt/equity of 121.2%, so the balance sheet is levered but not stretched to the point of immediate distress. Operating cash flow was $1.3B TTM and levered free cash flow was $419.6M TTM, which means EBITDA is converting to cash, but a large share is still absorbed by working capital, capex, and interest. Net debt/EBITDA of 4.5x is the key credit signal here because it leaves limited room for a downturn before refinancing risk becomes more visible, especially if cash flow weakens before the next debt maturity. FCF margin was 3.7% TTM, which is thin for a consumer staples name and tells me the business is generating cash, but not enough to create much financial flexibility.
Insider Activity
The insider transaction record I see here shows net buying only, with 2 open-market purchases and no open-market sales in the 2025-03-03 to 2026-06-01 window. The activity is concentrated in 2 insiders, so it is not broad-based, but the absence of any selling still points to alignment rather than distribution. I view that as a modest positive, not a thesis changer.
Comparable Analysis
LF0 has published standalone analyses of these peers: General Mills (GIS) (rated Hold); Kraft Heinz (KHC) (rated Hold).
Growth
| Company | Revenue TTM (USD Mil) | Revenue Growth YoY % | EBITDA TTM (USD Mil) | Diluted EPS TTM |
|---|---|---|---|---|
| CAG | 11,244.9 | -1.4% | 1,657.9 | -4 |
| CPB | 9,744 | -7.9% | 1,620 | 1.3 |
| GIS | 18,296.6 | -2.8% | 3,415 | -1.6 |
| KHC | 24,900 | -1.4% | 5,493 | -2.9 |
| SJM | 9,156.9 | 5.0% | 2,263.9 | 2.1 |
| HRL | 12,146.9 | -2.4% | 1,264.9 | 0.6 |
Source: Yahoo Finance
CAG’s revenue fell 1.4% TTM, which is better than CPB at -7.9% and GIS at -2.8%, but worse than SJM at +5.0% and only slightly better than KHC at -1.4% and HRL at -2.4%. That puts CAG in the middle of the pack, so the market should not pay a growth premium, especially because SJM is still growing while CAG is shrinking.
Valuation
| Company | Current Share Price (USD) | Trailing P/E | Forward P/E | EV/Revenue | EV/EBITDA | Price/Sales (TTM) | Price/Book (mrq) | Market Cap (USD Mil) | Enterprise Value (USD Mil) | Beta (5Y Monthly) | FCF Yield % (TTM) | Forward EPS | Analyst Target Price – Low | Analyst Target Price – Mean | Analyst Target Price – High | # Analyst Opinions |
|---|---|---|---|---|---|---|---|---|---|---|---|---|---|---|---|---|
| CAG | 13.9 | — | 9.3 | 1.3 | 8.6 | 0.6 | 1 | 6,648 | 14,187 | 0 | 6.3% | 1.5 | 11 | 13.7 | 16 | 15 |
| CPB | 20.5 | 15.6 | 11.2 | 1.4 | 8.4 | 0.6 | 1.6 | 6,109 | 13,529 | 0.04 | 10.4% | 1.8 | 16 | 20.8 | 41.5 | 17 |
| GIS | 33 | — | 10.5 | 1.7 | 9.1 | 1 | 2.4 | 17,656 | 31,092 | 0.02 | 7.4% | 3.2 | 30 | 37 | 45 | 18 |
| KHC | 23.8 | — | 11.5 | 1.8 | 8.2 | 1.1 | 0.8 | 28,217 | 44,975 | 0.11 | 11.5% | 2.1 | 19 | 24.7 | 41 | 18 |
| SJM | 125.3 | 58.5 | 11.4 | 2.2 | 9.1 | 1.5 | 2.3 | 13,384 | 20,507 | 0.27 | 10.9% | 11 | 120 | 141.8 | 160 | 16 |
| HRL | 20.6 | 33.2 | 13.1 | 1.1 | 10.7 | 0.9 | 1.4 | 11,332 | 13,489 | 0.29 | 5.5% | 1.6 | 23 | 25.3 | 29 | 8 |
Source: Yahoo Finance
CAG’s 6.3% FCF yield is below KHC at 11.5%, CPB at 10.4%, and SJM at 10.9%, but above GIS at 7.4% and HRL at 5.5%, while its 8.6x EV/EBITDA sits close to CPB at 8.4x and KHC at 8.2x and below GIS at 9.1x and HRL at 10.7x. Using the peer EV/Revenue range of 1.1x to 2.2x on CAG’s $11.2B of TTM revenue gives an implied enterprise value of about $12.5B to $25.2B; after netting CAG’s debt and cash, that implies roughly $10.4 to $37.2 per share versus the actual $13.93. The wide range says the stock is not obviously expensive, but the discount to the higher-FCF peers is justified by CAG’s weaker growth and negative TTM EPS of -$4.
Profitability
| Company | Operating Margin (TTM) | Net Margin (TTM) | Return on Assets (TTM) | Return on Equity (TTM) | Gross Margin (TTM) | EBITDA Margin (TTM) |
|---|---|---|---|---|---|---|
| CAG | 11.6% | -17.0% | 4.1% | -24.9% | 23.8% | 14.7% |
| CPB | 10.2% | 4.1% | 4.9% | 10.1% | 28.5% | 16.6% |
| GIS | 15.2% | -4.9% | 5.6% | -10.5% | 33.7% | 18.7% |
| KHC | 15.5% | -13.6% | 3.6% | -8.8% | 33.5% | 22.1% |
| SJM | 17.9% | 2.5% | 6.3% | 3.9% | 38.0% | 24.7% |
| HRL | 8.6% | 2.8% | 4.6% | 4.3% | 15.7% | 10.4% |
Source: Yahoo Finance
CAG’s gross margin of 23.8% trails CPB at 28.5%, GIS at 33.7%, KHC at 33.5%, SJM at 38.0%, and HRL at 15.7%, while its EBITDA margin of 14.7% is below CPB at 16.6%, GIS at 18.7%, KHC at 22.1%, and SJM at 24.7%, and only above HRL at 10.4%. The operating margin gap is smaller than the gross margin gap, which points to a cost-of-revenue disadvantage rather than a pure overhead problem, and the negative net margin of -17.0% versus positive net margins at CPB, GIS, KHC, SJM, and HRL shows CAG is still absorbing costs below the operating line.
Leverage
| Company | Total Debt/Equity % (mrq) | Current Ratio (mrq) | Total Debt (mrq, USD Mil) | Operating Cash Flow TTM (USD Mil) | Free Cash Flow TTM (USD Mil) | Net Debt/EBITDA (TTM) | FCF Margin % (TTM) |
|---|---|---|---|---|---|---|---|
| CAG | 121.2 | 1.1 | 7,760.1 | 1,277.3 | 419.6 | 4.5 | 3.7% |
| CPB | 179.3 | 0.8 | 7,450 | 1,039 | 634.5 | 4.4 | 6.5% |
| GIS | 182.4 | 0.7 | 13,615.6 | 2,067 | 1,302.6 | 3.9 | 7.1% |
| KHC | 52.6 | 1.1 | 19,001 | 4,621 | 3,250.5 | 3 | 13.1% |
| SJM | 120.7 | 0.9 | 6,940.2 | 1,909.9 | 1,464.3 | 3 | 16.0% |
| HRL | 36.3 | 1.9 | 2,855.1 | 1,091.7 | 621.5 | 1.6 | 5.1% |
Source: Yahoo Finance
CAG’s debt/equity of 121.2% is below CPB at 179.3% and GIS at 182.4%, but above KHC at 52.6%, SJM at 120.7%, and HRL at 36.3%; its net debt/EBITDA of 4.5x is slightly worse than CPB at 4.4x and above GIS at 3.9x, KHC at 3.0x, SJM at 3.0x, and HRL at 1.6x. The 3.7% FCF margin is also below CPB at 6.5%, GIS at 7.1%, KHC at 13.1%, SJM at 16.0%, and HRL at 5.1%, so the balance sheet is serviceable but not a source of advantage. CAG’s leverage profile looks like a financing choice for a mature packaged-food business, not a competitive edge, and that is why its valuation should not be read as a bargain on its own.
Conclusion
I would put my rating as a Hold because Conagra’s cash generation is good enough to support the equity, but the company has not yet shown me that margin repair is durable enough to justify a Buy. The tension is straightforward: the brand portfolio and shelf-space position are real, yet the numbers still show a -17.0% net margin and 4.5x net debt/EBITDA, so the stock is being asked to carry leverage before it has fully repaired earnings quality.
The bull case is that pricing, mix, and cost control finally line up and push net margin back into positive territory for two consecutive quarters. If that happens while FCF margin moves from 3.7% toward the mid-single digits, I would become more constructive because the current 6.3% FCF yield would look more durable and the balance sheet would have more room to improve. On a $11.2B revenue base, even a 2 percentage point EBITDA margin gain would add about $224M of annual EBITDA, which would matter for deleveraging and for dividend safety.
The bear case is that revenue stays flat to down and leverage does not come down, which would leave the stock stuck at a fair multiple while the balance sheet remains a constraint. I would move from Hold to Sell if net debt/EBITDA rose above 5.0x, meaning leverage would be increasing faster than cash generation and refinancing risk would be getting harder to ignore. A second warning sign would be FCF yield slipping below 5.0% while the dividend payout ratio stays near 80%, because that would tell me the current cash return is being stretched.
Weighing both sides, I think the market is already giving Conagra some credit for a recovery that still needs to prove itself in the numbers. That keeps me at Hold: the downside is not severe enough for a Sell, but the evidence is not strong enough yet to justify paying up for a cleaner earnings reset.
What to Watch Next
- Net margin turning positive for two straight quarters — would support a move toward Buy.
- FCF margin moving toward the mid-single digits — would make the cash yield look more durable.
- Net debt/EBITDA rising above 5.0x — would raise refinancing risk and argue for a lower rating.
- FCF yield falling below 5.0% while payout stays near 80% — would weaken dividend safety.
- Quarterly revenue growth re-accelerating from the recent flat pattern — would strengthen the recovery case.
What’s your take? I rated Conagra Brands (CAG) HOLD above — but the goal here is to get this right, not just to publish an opinion. What would you add to this analysis, or which risk or catalyst do you think I’m under- or over-weighting? Tell me in the comments.
Our track record: every directional call is tracked publicly on The Scorecard, and Stocks Covered lists every company we have rated and when.
Sources
- SEC 10-K Annual Report — filed 2024-07-11
- SEC 8-K Filing (2024-12-19)
- SEC 8-K Filing (2024-10-02)
- SEC 8-K Filing (2024-09-23)
- SEC 8-K Filing (2024-07-11)
- SEC 8-K Filing (2024-05-21)
- SEC 8-K Filing (2024-05-01)
- SEC Form 4 Insider Transaction (2026-06-03)
- SEC Form 4 Insider Transaction (2026-06-03)
- SEC Form 4 Insider Transaction (2026-06-03)
- SEC 10-K Annual Report — FY2024
- SEC 10-K Annual Report — FY2021
- SEC 10-K Annual Report — FY2020
Data sourced from Yahoo Finance and SEC EDGAR. Not investment advice.
Leave a Comment