Expected price range
Each range is set from the stock’s recent price history and our Hold rating, using its own 1-year realised volatility (30% annualised) as the width of a ~68% statistical band, and checked against that rating so the range leans the same way as our view. Starting price $33.25 (close 2026-10-27). The stock traded between $31.67 and $41.55 over the last 6 months and between $31.67 and $49.01 over the last year. This is an illustration of where our view and normal volatility point, not a forecast, price target or investment advice; the stock can move outside it.
| Company | Oct 25 | Nov 25 | Dec 25 | Jan 26 | Feb 26 | Mar 26 | Apr 26 | May 26 | Jun 26 | Jul 26 | Aug 26 | Sep 26 | 12-Mo |
|---|---|---|---|---|---|---|---|---|---|---|---|---|---|
| GIS | -6% | +2% | -2% | +1% | -2% | -18% | -4% | -4% | +3% | +5% | +15% | -22% | -32% |
| ADM | +1% | +1% | -5% | +17% | +3% | +5% | +3% | +8% | -4% | +4% | +3% | -2% | +37% |
| BG | +16% | +2% | -7% | +28% | +7% | +5% | -0% | -2% | -13% | -0% | +10% | -8% | +35% |
| TSN | -5% | +13% | +2% | +11% | +0% | -1% | +0% | -5% | -5% | +1% | -5% | -8% | -4% |
| INGR | -5% | -7% | +3% | +8% | -1% | -4% | -0% | -9% | -7% | +6% | +4% | -7% | -19% |
| ANDE | +17% | +11% | +3% | +17% | +5% | +10% | +10% | -10% | -3% | +4% | -8% | +1% | +67% |
Source: Yahoo Finance monthly adjusted close.
Quick Thesis
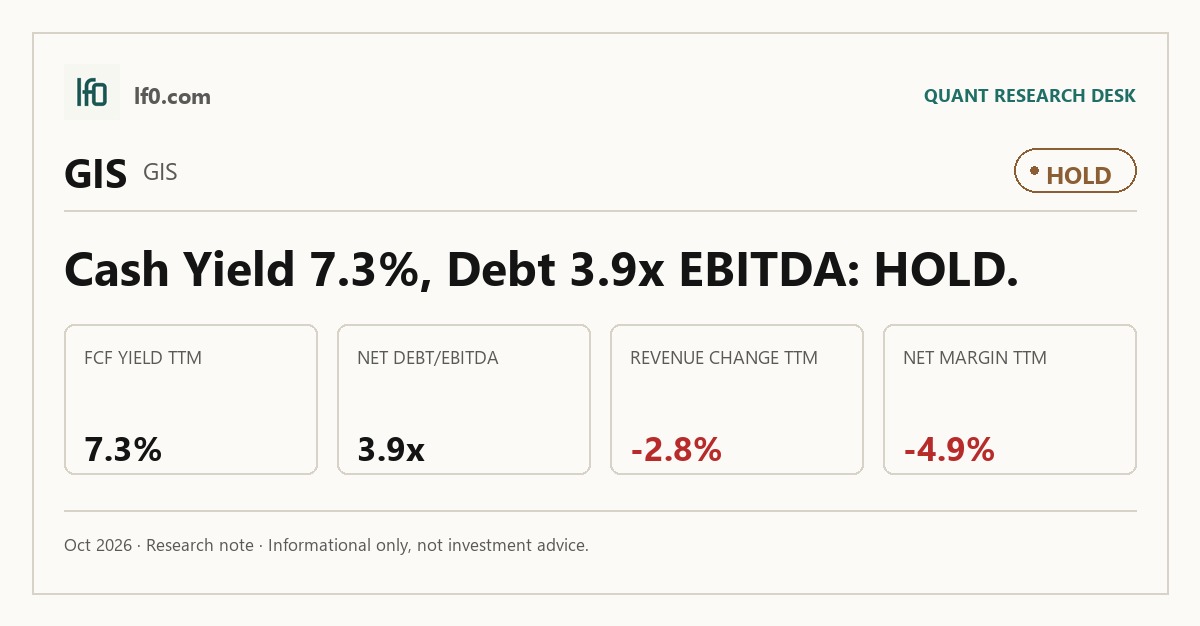
- Rated Hold — cash generation is solid, but growth is still weak.
- FCF yield is 7.3% TTM, which supports the current valuation.
- Net debt/EBITDA is 3.9x, and that leverage limits flexibility.
- GIS trades at 9.1x EV/EBITDA, which looks fair rather than cheap.
- I would raise the rating if organic sales turn positive and margin leverage improves.
Executive Summary
Rating: HOLD | GIS
Measured from adjusted close on 2026-10-27 to 2026-10-28. Sell ratings are correct when the stock falls; Hold is tracked as a +/-10% range. Daily-close data, not intraday. Calls are tracked for 182 days from publication, then frozen as a final record.
I would put my rating as a Hold because General Mills has enough cash generation to support the current price, but not enough growth or balance-sheet flexibility to justify a more aggressive call. The stock trades at 10.5x forward P/E and a 7.3% FCF yield, so investors are paying for steady cash conversion rather than earnings acceleration, while net debt/EBITDA of 3.9x and a current ratio of 0.7 show the balance sheet is serviceable but not roomy. I would raise my rating more toward a Buy if organic sales move back to positive growth for two consecutive quarters and adjusted operating profit starts rising faster than revenue, because that would show brand investment is finally translating into volume and margin leverage.
Company Profile
General Mills is a global branded food company with four reporting segments: North America Retail, International, Pet, and North America Foodservice. It sells cereal, snacks, meals, pet food, dough, yogurt, and ice cream through grocery stores, mass merchandisers, membership clubs, e-commerce, foodservice distributors, restaurants, and pet specialty stores. Walmart accounted for 22.0% of consolidated net sales in fiscal 2024, so shelf access and pricing terms with large retailers remain central to the model. The company also owns 50% interests in Cereal Partners Worldwide with Nestlé and Häagen-Dazs Japan, which extend the brand footprint beyond North America.
Economic Moat
Business Model
The moat is built on brand equity, distribution reach, and shelf presence. Brands such as Cheerios, Häagen-Dazs, Nature Valley, Pillsbury, Progresso, and Blue Buffalo are durable assets because they can be renewed as long as they remain in use, and I feel that this is the hardest part of the business for a competitor to copy quickly. The direct sales force and broad channel mix also matter: they give General Mills access to grocery, mass, club, e-commerce, foodservice, and pet channels, which reduces dependence on any one route to market. The Cereal Partners Worldwide and Häagen-Dazs Japan joint ventures add geographic reach without requiring full ownership of those markets.
Business & Operating Risks
The biggest disclosed risk is retailer concentration, especially Walmart, which accounted for 22.0% of consolidated net sales and 30.0% of North America Retail sales in fiscal 2024. That concentration can pressure both price and volume if a large customer pushes harder on private label or promotions, so the risk strikes directly at the shelf-access advantage described above. Commodity inflation is the second major risk because the company does not fully hedge input costs, and a branded portfolio only protects margins if pricing and productivity keep up. Supply chain concentration is also real: several product lines are made at a single location or sourced from a single supplier, which means an operational disruption could quickly become a service problem. Taken together, these risks do not break the moat, but they do cap how much pricing power I am willing to assign to it.
Management Discussion & Analysis
Management is responding to those risks by leaning on brand investment and cost savings rather than assuming pricing alone will do the work. According to management’s discussion in the 10-K, fiscal 2025 calls for increased brand-building investment, while HMM savings of roughly 4% to 5% of cost of goods sold are expected to exceed 3% to 4% input cost inflation. That tells me management is trying to defend margins while it works on volume, not simply cut its way through the cycle. The problem is that fiscal 2024 organic net sales still declined 1.0%, so the strategy has not yet produced a clean demand inflection. Capital returns remain strong, with $2.5B of free cash flow and $3.3B returned to shareholders in fiscal 2024, which supports the equity but does not by itself prove the moat is widening.
Recent Events
The most important recent event was the new $2.7B five-year revolving credit facility announced in October 2024, which replaced the prior facility and improves liquidity flexibility. That does not change the operating moat, but it does reduce near-term financing pressure. The November 2024 agreement to acquire Whitebridge Pet Brands’ North American premium cat feeding and pet treating business is a modest strategic positive because it adds a higher-growth pet niche and deepens the portfolio. The December 2024 earnings release was routine reporting, so the main takeaway from the recent 8-Ks is that General Mills is still managing the balance sheet and portfolio actively rather than making a transformative move.
Financial Analysis
Growth
GIS — Financial Growth (Quarterly, USD Mil)
| Metric | 2025-08-31 | 2025-11-30 | 2026-02-28 | 2026-05-31 | 2026-08-31 |
|---|---|---|---|---|---|
| REVENUE (USD Mil) | 4,517.5 | 4,860.8 | 4,436.7 | 4,609.6 | 4,389.5 |
| EBIT (USD Mil) | 687.7 | 743.7 | 539.9 | -2,049.4 | 655 |
| EBITDA (USD Mil) | 826.4 | 881.7 | 679.3 | -1,910.3 | 794.8 |
| NET INCOME (USD Mil) | 1,204.2 | 413 | 303.1 | -2,007.9 | 397 |
| DILUTED EPS | 2.2 | 0.8 | 0.6 | -3.7 | 0.7 |
Source: Yahoo Finance — Quarterly Financial Statements
Revenue was $4.4B in the latest quarter, down 1.8% year over year, after a choppy sequence that included $4.9B in the prior quarter and $4.4B two quarters earlier. That is not a growth reacceleration; it is a flat-to-down pattern that fits the company’s own 1.0% organic sales decline in fiscal 2024. EBITDA slipped to $794.8M from $826.4M a year earlier, so earnings are weakening slightly faster than sales, which tells me the top line is not yet giving the business enough operating leverage. The moat is still intact, but the growth profile is too soft to justify a premium multiple on its own.
Profitability
GIS — Profitability (TTM)
| Metric | TTM |
|---|---|
| Operating Margin (TTM) | 15.2% |
| Net Margin (TTM) | -4.9% |
| Return on Assets (TTM) | 5.6% |
| Return on Equity (TTM) | -10.5% |
| Gross Margin (TTM) | 33.7% |
| EBITDA Margin (TTM) | 18.7% |
Source: Yahoo Finance — Trailing Twelve Months (TTM)
TTM operating margin was 15.2%, gross margin was 33.7%, and EBITDA margin was 18.7%, which means the core business still converts a healthy share of sales into operating profit. The issue is below the line: net margin was -4.89% and return on equity was -10.5%, so leverage and other charges are still suppressing equity returns even though the operating engine remains profitable. Return on assets was 5.65%, which is the cleaner read on asset productivity and shows the business is not broken at the operating level. I would watch for net margin turning positive and moving closer to operating margin, because that would show the earnings bridge is improving rather than being held together by cost cuts.
Valuation
GIS — Valuation Multiples
| Metric | Value |
|---|---|
| Current Share Price (USD) | 33.3 |
| Market Cap (USD Mil) | 17,781 |
| Enterprise Value (USD Mil) | 31,215 |
| Trailing P/E | — |
| Forward P/E | 10.5 |
| Price/Sales (TTM) | 1 |
| Price/Book (mrq) | 2.4 |
| EV/Revenue | 1.7 |
| EV/EBITDA | 9.1 |
| Beta (5Y Monthly) | 0.02 |
| FCF Yield % (TTM) | 7.3% |
| Forward EPS (USD) | 3.2 |
| Analyst Target Price – Low (USD) | 30 |
| Analyst Target Price – Mean (USD) | 37 |
| Analyst Target Price – High (USD) | 45 |
| # Analyst Opinions | 18 |
Source: Yahoo Finance
General Mills trades at 1.7x EV/revenue, 9.1x EV/EBITDA, 10.5x forward P/E, and 7.3% FCF yield, so the market is pricing it as a mature cash generator rather than a growth name. On the analysis here, I would put fair value in a range of about $30-$37 per share, which sits around the current price and lines up with the analyst mean target of 37 across 18 opinions. That range is not a deep discount to consensus, and I think that is appropriate because the company’s cash yield and margins are solid but its growth is still negative. Forward EPS of 3.15 also implies the stock is not expensive on earnings, yet the leverage profile keeps me from treating that multiple as a bargain. In other words, the valuation is supported by cash flow, but the balance sheet and weak growth keep it from screening as clearly cheap.
Leverage
GIS — Leverage & Coverage (Quarterly)
| Metric | Value |
|---|---|
| Total Debt/Equity % (mrq) | 182.4 |
| Current Ratio (mrq) | 0.7 |
| Total Debt (mrq, USD Mil) | 13,615.6 |
| Operating Cash Flow (TTM, USD Mil) | 2,067 |
| Levered Free Cash Flow (TTM, USD Mil) | 1,302.6 |
| Net Debt/EBITDA (TTM) | 3.9 |
| FCF Margin % (TTM) | 7.1% |
Source: Yahoo Finance — Quarterly Financial Statements
Total debt/equity was 182.4%, current ratio was 0.704, and total debt was $13.62B, so the balance sheet is clearly levered and the liquidity cushion is thin. The offset is real cash generation: operating cash flow was $2.067B TTM, levered free cash flow was $1.303B, net debt/EBITDA was 3.9x, and FCF margin was 7.1%. That combination tells me the company can service its obligations, but it does not have much room for a weaker year or a refinancing shock. The leverage is manageable, yet it remains a constraint on how much upside the equity can deserve before growth improves.
Insider Activity
The insider record shows 5 open-market sales and 0 purchases over the period reviewed. Two of those sales came from Jacqueline Williams-Roll in May 2026, so the signal is not broad-based, but it is still one-sided. I do not put much weight on it by itself because insider ownership is only 0.291%, which makes the base small, but the absence of any buying does not help the case.
Comparable Analysis
LF0 has published standalone analyses of these peers: Archer-Daniels-Midland (ADM) (rated Hold); Bunge Global (BG) (rated Hold); Tyson Foods (TSN) (rated Hold).
Growth
| Company | Revenue TTM (USD Mil) | Revenue Growth YoY % | EBITDA TTM (USD Mil) | Diluted EPS TTM |
|---|---|---|---|---|
| GIS | 18,296.6 | -2.8% | 3,415 | -1.6 |
| ADM | 82,099 | 7.2% | 2,995 | 3.6 |
| BG | 91,819 | 88.3% | 3,126 | 5 |
| TSN | 55,694 | -0.1% | 2,772 | 1.6 |
| INGR | 7,215 | 0.9% | 1,154 | 9.2 |
| ANDE | 10,938.9 | -1.2% | 302.5 | 5.2 |
Source: Yahoo Finance
GIS’s revenue fell 2.8% TTM, while ADM grew 7.2%, BG surged 88.3%, TSN was flat at -0.1%, INGR rose 0.9%, and ANDE declined 1.2%. That puts GIS behind the growers and only slightly worse than TSN and ANDE, so I do not think the market should pay a growth premium here. The bigger point is that GIS is being valued more on stability and cash flow than on top-line expansion.
Valuation
| Company | Current Share Price (USD) | Trailing P/E | Forward P/E | EV/Revenue | EV/EBITDA | Price/Sales (TTM) | Price/Book (mrq) | Market Cap (USD Mil) | Enterprise Value (USD Mil) | Beta (5Y Monthly) | FCF Yield % (TTM) | Forward EPS | Analyst Target Price – Low | Analyst Target Price – Mean | Analyst Target Price – High | # Analyst Opinions |
|---|---|---|---|---|---|---|---|---|---|---|---|---|---|---|---|---|
| GIS | 33.3 | — | 10.5 | 1.7 | 9.1 | 1 | 2.4 | 17,781 | 31,215 | 0.02 | 7.3% | 3.2 | 30 | 37 | 45 | 18 |
| ADM | 78.4 | 21.5 | 13.8 | 0.6 | 15.6 | 0.5 | 1.6 | 37,766 | 46,628 | 0.63 | 3.1% | 5.7 | 60 | 80.3 | 95 | 10 |
| BG | 101.5 | 20.2 | 9.1 | 0.4 | 12 | 0.2 | 1.2 | 19,500 | 37,368 | 0.72 | -33.2% | 11.2 | 116 | 140.6 | 155 | 9 |
| TSN | 55.6 | 34.3 | 14.3 | 0.5 | 9.8 | 0.4 | 1.1 | 19,548 | 27,214 | 0.40 | 6.1% | 3.9 | 56 | 63 | 75 | 12 |
| INGR | 94.2 | 10.2 | 8.4 | 0.9 | 5.9 | 0.8 | 1.3 | 5,939 | 6,849 | 0.64 | 7.7% | 11.2 | 104 | 119.5 | 150 | 6 |
| ANDE | 64 | 12.4 | 10 | 0.3 | 10.1 | 0.2 | 1.6 | 2,180 | 3,047 | 0.66 | -5.0% | 6.4 | 80 | 86.7 | 90 | 3 |
Source: Yahoo Finance
GIS trades at 1.7x EV/revenue, 10.5x forward P/E, 1.0x price/sales, and a 7.3% FCF yield, versus ADM at 0.6x, 13.8x, 0.5x, and 3.1%, BG at 0.4x, 9.1x, 0.2x, and -33.2%, TSN at 0.5x, 14.3x, 0.4x, and 6.1%, INGR at 0.9x, 8.4x, 0.8x, and 7.7%, and ANDE at 0.3x, 10.0x, 0.2x, and -5.0%. GIS screens richer than the commodity processors on EV/revenue, but its FCF yield is near the top of the group, which is why the premium looks partly justified by cash conversion rather than growth. The market is also not paying a growth premium for GIS relative to the peers with better revenue momentum, which reinforces my view that the stock is fairly valued rather than cheap.
Profitability
| Company | Operating Margin (TTM) | Net Margin (TTM) | Return on Assets (TTM) | Return on Equity (TTM) | Gross Margin (TTM) | EBITDA Margin (TTM) |
|---|---|---|---|---|---|---|
| GIS | 15.2% | -4.9% | 5.6% | -10.5% | 33.7% | 18.7% |
| ADM | 4.0% | 2.2% | 2.3% | 7.6% | 6.9% | 3.6% |
| BG | 4.6% | 1.1% | 3.5% | 7.2% | 4.9% | 3.4% |
| TSN | 2.7% | 1.0% | 2.6% | 3.3% | 6.6% | 5.0% |
| INGR | 12.6% | 8.2% | 7.3% | 13.7% | 23.7% | 16.0% |
| ANDE | 1.6% | 1.6% | 3.0% | 12.2% | 7.2% | 2.8% |
Source: Yahoo Finance
GIS’s gross margin of 33.7% and EBITDA margin of 18.7% are well above ADM’s 6.9% and 3.6%, BG’s 4.9% and 3.4%, TSN’s 6.6% and 5.0%, INGR’s 23.7% and 16.0%, and ANDE’s 7.2% and 2.8%. That margin lead is consistent with a branded portfolio, but the fact that operating margin is only 15.2% shows some of the gross advantage is being absorbed by overhead and brand investment. GIS also has a -10.5% ROE versus positive ROE across the peer set, which tells me leverage and below-the-line items are still holding back equity returns.
Leverage
| Company | Total Debt/Equity % (mrq) | Current Ratio (mrq) | Total Debt (mrq, USD Mil) | Operating Cash Flow TTM (USD Mil) | Free Cash Flow TTM (USD Mil) | Net Debt/EBITDA (TTM) | FCF Margin % (TTM) |
|---|---|---|---|---|---|---|---|
| GIS | 182.4 | 0.7 | 13,615.6 | 2,067 | 1,302.6 | 3.9 | 7.1% |
| ADM | 39.1 | 1.4 | 9,342 | 2,795 | 1,164.6 | 2.8 | 1.4% |
| BG | 98 | 1.6 | 17,061 | 1,075 | -6,475.4 | 5.2 | -7.0% |
| TSN | 44 | 1.4 | 8,006 | 2,004 | 1,191.2 | 2.6 | 2.1% |
| INGR | 39.4 | 2.8 | 1,783 | 805 | 457.2 | 0.7 | 6.3% |
| ANDE | 66.3 | 1.5 | 900.8 | 321.9 | -109.1 | 2.8 | -1.0% |
Source: Yahoo Finance
GIS carries 182.4% debt/equity and 3.9x net debt/EBITDA, versus ADM at 39.1% and 2.8x, BG at 98.0% and 5.2x, TSN at 44.0% and 2.6x, INGR at 39.4% and 0.7x, and ANDE at 66.3% and 2.8x. GIS is more levered than every peer except BG on debt/equity, but its 7.1% FCF margin and $1.303B of free cash flow show the balance sheet is supported by real cash generation. That is why I read the leverage as a financing constraint rather than a distress signal. It also explains part of the valuation gap: investors are paying for cash flow, but they are not paying up for balance-sheet safety the way they would for INGR.
Conclusion
I would put my rating as a Hold because the key tension is between a durable branded-food franchise and a balance sheet that leaves little room for a misstep. The business still throws off real cash, but the latest numbers do not yet show the kind of volume recovery that would let me underwrite a higher multiple with confidence. The most important bull case is that organic sales turn positive for two consecutive quarters and adjusted operating profit grows faster than revenue, because that would show brand investment is finally translating into operating leverage. If that happens, I would move the rating more toward a Buy, especially if the margin improvement is large enough to add roughly $183M of annual EBITDA on the current revenue base, which would make deleveraging easier and the current forward P/E look more conservative.
The bear case is that retailer pressure and commodity inflation keep squeezing margins while sales stay flat to down. If net debt/EBITDA were to move above 4.5x, meaning leverage is clearly drifting away from the current support level, or if free cash flow margin slipped materially below 7.1%, I would move from Hold to Sell because the equity would be leaning on a weaker cash base without a growth offset. I think that downside path is the one to watch first, because the latest filing already shows 2.8% TTM revenue decline, one-sided insider selling, and a business that still depends heavily on retailer access. Until I see a cleaner volume inflection, I stay at Hold.
What to Watch Next
- Organic sales positive for two straight quarters — would support a move toward Buy.
- Adjusted operating profit growing faster than revenue — would confirm margin leverage.
- Net debt/EBITDA above 4.5x — would increase balance-sheet pressure.
- Free cash flow margin below 7.1% — would weaken the cash-support case.
- Revenue growth turning positive — would be the clearest sign the thesis is improving.
What’s your take? I rated General Mills (GIS) HOLD above — but the goal here is to get this right, not just to publish an opinion. What would you add to this analysis, or which risk or catalyst do you think I’m under- or over-weighting? Tell me in the comments.
Our track record: every directional call is tracked publicly on The Scorecard, and Stocks Covered lists every company we have rated and when.
Sources
- SEC 10-K Annual Report — filed 2024-06-26
- SEC 8-K Filing (2024-12-18)
- SEC 8-K Filing (2024-11-21)
- SEC 8-K Filing (2024-11-15)
- SEC 8-K Filing (2024-10-15)
- SEC 8-K Filing (2024-09-27)
- SEC 8-K Filing (2024-09-18)
- SEC Form 4 Insider Transaction (2026-06-02)
- SEC Form 4 Insider Transaction (2026-06-02)
- SEC Form 4 Insider Transaction (2026-06-02)
- SEC 10-K Annual Report — FY2024
- SEC 10-K Annual Report — FY2023
- SEC 10-K Annual Report — FY2022
- SEC 10-K Annual Report — FY2021
- SEC 10-K Annual Report — FY2020
Data sourced from Yahoo Finance and SEC EDGAR. Not investment advice.
Leave a Comment