Expected price range
Each range is set from the stock’s recent price history and our Hold rating, using its own 1-year realised volatility (27% annualised) as the width of a ~68% statistical band, and checked against that rating so the range leans the same way as our view. Starting price $55.62 (close 2026-10-27). The stock traded between $50.47 and $68.75 over the last 6 months and between $50.47 and $68.75 over the last year. This is an illustration of where our view and normal volatility point, not a forecast, price target or investment advice; the stock can move outside it.
| Company | Oct 25 | Nov 25 | Dec 25 | Jan 26 | Feb 26 | Mar 26 | Apr 26 | May 26 | Jun 26 | Jul 26 | Aug 26 | Sep 26 | 12-Mo |
|---|---|---|---|---|---|---|---|---|---|---|---|---|---|
| TSN | -5% | +13% | +2% | +11% | +0% | -1% | +0% | -5% | -5% | +1% | -5% | -8% | -4% |
| ADM | +1% | +1% | -5% | +17% | +3% | +5% | +3% | +8% | -4% | +4% | +3% | -2% | +37% |
| BG | +16% | +2% | -7% | +28% | +7% | +5% | -0% | -2% | -13% | -0% | +10% | -8% | +35% |
| GIS | -6% | +2% | -2% | +1% | -2% | -18% | -4% | -4% | +3% | +5% | +15% | -22% | -32% |
| INGR | -5% | -7% | +3% | +8% | -1% | -4% | -0% | -9% | -7% | +6% | +4% | -7% | -19% |
| ANDE | +17% | +11% | +3% | +17% | +5% | +10% | +10% | -10% | -3% | +4% | -8% | +1% | +67% |
Source: Yahoo Finance monthly adjusted close.
Quick Thesis
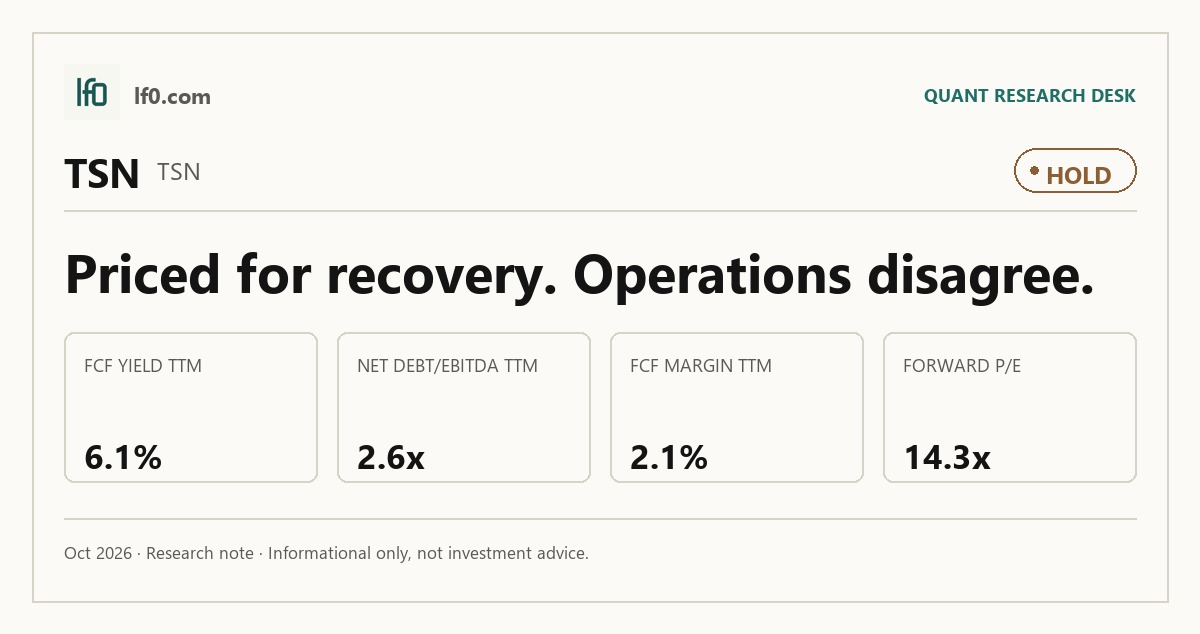
- Rated hold because Tyson’s margins are still thin despite stable revenue.
- TTM operating margin is 2.7%, showing only modest earnings power.
- Net debt/EBITDA is 2.6x, so leverage is manageable but not trivial.
- EV/EBITDA is 9.8x, which looks fair rather than cheap.
- I would turn more constructive if operating margin moves into the mid-single digits and holds.
Executive Summary
Rating: HOLD | TSN
Measured from adjusted close on 2026-10-27 to 2026-10-28. Sell ratings are correct when the stock falls; Hold is tracked as a +/-10% range. Daily-close data, not intraday. Calls are tracked for 182 days from publication, then frozen as a final record.
I would put my rating as a Hold because Tyson is still earning only a 1.0% net margin on $55.7B of TTM revenue, yet the market is already paying 14.3x forward P/E for 3.90 of forward EPS and 9.8x EV/EBITDA. The integrated chicken platform is the clearest structural support, but the current valuation already discounts a recovery that has not yet shown up in the trailing numbers. I would raise my rating more towards a Buy if operating margin moves into the mid-single digits and stays there for two to three quarters, because that would show the current 2.7% TTM operating margin is not just a cyclical trough.
Company Profile
Tyson Foods, Inc. is a protein company that processes live cattle, hogs, and chickens into fresh, frozen, refrigerated, and value-added products sold to retailers, foodservice operators, distributors, and export customers. It operates four segments: Beef, Pork, Chicken, and Prepared Foods. The chicken business is vertically integrated from breeding stock and feed mills through processing and logistics, which gives Tyson more control over supply and quality than a simple processor would have. Headquartered in Springdale, Arkansas, the company had about 138,000 employees as of September 28, 2024, and sold products in about 140 countries and regions in fiscal 2024.
Economic Moat
Business Model
The hardest part of Tyson’s model to replicate is its vertically integrated chicken system, which runs from breeding stock through contract farmers, feed production, processing, further-processing, marketing, and transportation. Cobb-Vantress, Tyson’s breeding-stock business, is one of the leading poultry genetics suppliers in the world, and that makes the system harder to copy quickly than a stand-alone processing network. I view that as the core moat because a new entrant would need to rebuild genetics, hatchery, feed, grow-out, processing, and logistics at scale before it could match the economics. Tyson’s brand portfolio and national distribution network add support, while the Discovery Center in Springdale, with more than 40,000 square feet of USDA and FDA pilot-plant space and 19 research kitchens, helps it refresh products faster than smaller rivals.
Business & Operating Risks
The most material disclosed risk is commodity and input-cost volatility, because corn, soybean meal, and other feed ingredients represented roughly 56.0% of the cost of growing a live chicken in fiscal 2024. Tyson does not fully hedge commodity prices, so a move in feed costs can still hit gross margin quickly. Customer concentration is another pressure point: Walmart accounted for 18.4% of sales in fiscal 2024, and large customers can push for lower pricing, more promotions, and tailored products. Labor disruption and animal disease are also real threats, especially Highly Pathogenic Avian Influenza, which can force culls and disrupt supply. Taken together, these risks do not break the moat, but they do keep the integrated chicken advantage from flowing cleanly through to earnings.
Management Discussion & Analysis
Management is responding to those risks by pruning assets, extending debt maturities, and keeping capex focused on maintenance and simplification rather than aggressive expansion. Fiscal 2024 cash from operating activities was $2.0B, capital expenditures were $1.1B, and Tyson issued $750M of term loan debt due May 2028 plus $600M of 5.40% 2029 notes and $900M of 5.70% 2034 notes, which pushes refinancing risk out but leaves the debt load elevated. The $174M of proceeds from the Vienna, Georgia facility sale and the decision to sell the Netherlands production facility show management is still cleaning up the portfolio, while $182M of plant closure and disposal charges and $174M of legal contingency accruals show the cleanup remains costly. In my view, management is stabilizing the business, but it has not yet turned the restructuring into a cleaner earnings base.
Management credibility is mixed, though better than it was in the prior two years. The company’s goodwill impairment warnings in fiscal 2023 were directionally right, and the current filing still shows Beef and Chicken close enough to impairment thresholds that the margin cushion is not wide. That said, the recurring legal accruals, plant closure charges, and asset sales tell me the narrative has been more reactive than predictive, even if leadership continuity has been strong.
Recent Events
The June 13, 2024 suspension of John R. Tyson as executive vice president and chief financial officer was the most important governance event in the period, because it put a new finance lead in place while capital allocation and margin repair were still front and center. Tyson then amended and restated its term loan agreement on June 26, 2024, lowering borrowing costs and leaving covenants unchanged, which modestly improved the financing backdrop. Routine earnings releases on August 5, 2024 and November 12, 2024, followed by Curt Calaway’s permanent appointment as CFO on August 29, 2024, point to a cleaner finance function after the disruption. The recent 8-Ks do not change the moat, but they do suggest management is trying to steady execution around it.
Financial Analysis
Growth
TSN — Financial Growth (Quarterly, USD Mil)
| Metric | 2025-06-30 | 2025-09-30 | 2025-12-31 | 2026-03-31 | 2026-06-30 |
|---|---|---|---|---|---|
| REVENUE (USD Mil) | 13,884 | 13,860 | 14,313 | 13,653 | 13,868 |
| EBIT (USD Mil) | 306 | 174 | 231 | 456 | 364 |
| EBITDA (USD Mil) | 635 | 506 | 607 | 806 | 693 |
| NET INCOME (USD Mil) | 61 | 47 | 85 | 260 | 182 |
| DILUTED EPS | 0.2 | 0.1 | 0.2 | 0.7 | 0.5 |
Source: Yahoo Finance — Quarterly Financial Statements
Revenue was $13.9B in Q2 2026, up slightly from $13.7B in Q2 2025, and the broader quarterly pattern has stayed range-bound between $13.7B and $14.3B rather than accelerating. EBITDA moved from $635M in Q2 2025 to $506M, $607M, $806M, and $693M across the next four quarters, so earnings are more volatile than sales and the latest quarter was solid without proving a new trend. The Q1 2026 spike in EBITDA and net income to $260M looks like a one-quarter jump rather than a step-change in demand, which is why I would not read the top line as a growth story.
Profitability
TSN — Profitability (TTM)
| Metric | TTM |
|---|---|
| Operating Margin (TTM) | 2.7% |
| Net Margin (TTM) | 1.0% |
| Return on Assets (TTM) | 2.6% |
| Return on Equity (TTM) | 3.3% |
| Gross Margin (TTM) | 6.6% |
| EBITDA Margin (TTM) | 5.0% |
Source: Yahoo Finance — Trailing Twelve Months (TTM)
Tyson’s TTM operating margin of 2.7%, gross margin of 6.6%, EBITDA margin of 5.0%, and net margin of 1.0% show a business that is still only barely clearing its cost base. The 3.9-point gap between gross margin and operating margin tells me overhead, plant costs, and other operating expenses are still absorbing most of the value created before interest and taxes. TTM ROA of 2.6% and ROE of 3.3% are modest, and the small gap between them suggests returns are not being heavily amplified by leverage. The key question is whether operating margin can move into the mid-single digits and stay there, because that would show the earnings base is becoming more durable rather than just bouncing around with commodity spreads.
Valuation
TSN — Valuation Multiples
| Metric | Value |
|---|---|
| Current Share Price (USD) | 55.6 |
| Market Cap (USD Mil) | 19,562 |
| Enterprise Value (USD Mil) | 27,214 |
| Trailing P/E | 34.3 |
| Forward P/E | 14.3 |
| Price/Sales (TTM) | 0.4 |
| Price/Book (mrq) | 1.1 |
| EV/Revenue | 0.5 |
| EV/EBITDA | 9.8 |
| Beta (5Y Monthly) | 0.40 |
| FCF Yield % (TTM) | 6.1% |
| Forward EPS (USD) | 3.9 |
| Analyst Target Price – Low (USD) | 56 |
| Analyst Target Price – Mean (USD) | 63 |
| Analyst Target Price – High (USD) | 75 |
| # Analyst Opinions | 12 |
Source: Yahoo Finance
Tyson trades at 0.5x EV/revenue, 34.3x trailing P/E, 14.3x forward P/E, 0.4x price/sales, and 9.8x EV/EBITDA, with a 6.1% FCF yield and a beta of 0.4. That mix says the market is paying for stability and cash generation, not for a high-growth rerating. Analyst coverage is real at 12 opinions, and the $56 low, $63 mean, and $75 target range sits close to the current $55.6 share price, so my own fair-value view is broadly in line with consensus rather than meaningfully above or below it. On the earnings side, 3.90 of forward EPS looks reasonable against the current multiple, but it is not rich enough to justify a premium unless margins keep improving. Relative to peers, Tyson’s earnings power is weaker than ADM’s $5.7 forward EPS and BG’s $11.2, yet its cash yield is better than ADM’s and close to GIS’s and INGR’s, which is why I see the stock as fairly valued rather than cheap.
Leverage
TSN — Leverage & Coverage (Quarterly)
| Metric | Value |
|---|---|
| Total Debt/Equity % (mrq) | 44 |
| Current Ratio (mrq) | 1.4 |
| Total Debt (mrq, USD Mil) | 8,006 |
| Operating Cash Flow (TTM, USD Mil) | 2,004 |
| Levered Free Cash Flow (TTM, USD Mil) | 1,191.2 |
| Net Debt/EBITDA (TTM) | 2.6 |
| FCF Margin % (TTM) | 2.1% |
Source: Yahoo Finance — Quarterly Financial Statements
Tyson’s total debt/equity was 44.0% mrq, current ratio was 1.4x, and total debt was $8B, so the balance sheet is serviceable but not a source of upside. Operating cash flow was $2.0B TTM and levered free cash flow was $1.2B TTM, which shows the business still produces cash after interest and capex. Net debt/EBITDA was 2.6x TTM, a level that leaves room for volatility but not enough to ignore refinancing discipline if earnings weaken. FCF margin was 2.1% TTM, which is thin for a company with this debt load and tells me most EBITDA is still being consumed by working capital and capital spending. That is why I see leverage as manageable rather than dangerous: it is not a distress case, but it does limit how quickly equity holders can benefit from any recovery.
Insider Activity
The insider record shows no open-market purchases or sales in the filing window, so there is no directional signal from trading activity. I read that as neutral rather than supportive: there is no insider buying to reinforce the thesis, but also no clustered selling that would undermine it.
Comparable Analysis
LF0 has published standalone analyses of these peers: Archer-Daniels-Midland (ADM) (rated Hold); Bunge Global (BG) (rated Hold).
Growth
| Company | Revenue TTM (USD Mil) | Revenue Growth YoY % | EBITDA TTM (USD Mil) | Diluted EPS TTM |
|---|---|---|---|---|
| TSN | 55,694 | -0.1% | 2,772 | 1.6 |
| ADM | 82,099 | 7.2% | 2,995 | 3.6 |
| BG | 91,819 | 88.3% | 3,126 | 5 |
| GIS | 18,296.6 | -2.8% | 3,415 | -1.6 |
| INGR | 7,215 | 0.9% | 1,154 | 9.2 |
| ANDE | 10,938.9 | -1.2% | 302.5 | 5.2 |
Source: Yahoo Finance
TSN’s revenue TTM was $55.7B, with growth of -0.1%, versus ADM at $82.1B and 7.2%, BG at $91.8B and 88.3%, GIS at $18.3B and -2.8%, INGR at $7.2B and 0.9%, and ANDE at $10.9B and -1.2%. Tyson is not being rewarded for top-line expansion, and that is fair because its growth is flat while ADM and BG are expanding faster. The $2.8B EBITDA base and $1.6 diluted EPS show Tyson is still converting scale into earnings, but the market is clearly valuing stability more than growth.
Valuation
| Company | Current Share Price (USD) | Trailing P/E | Forward P/E | EV/Revenue | EV/EBITDA | Price/Sales (TTM) | Price/Book (mrq) | Market Cap (USD Mil) | Enterprise Value (USD Mil) | Beta (5Y Monthly) | FCF Yield % (TTM) | Forward EPS | Analyst Target Price – Low | Analyst Target Price – Mean | Analyst Target Price – High | # Analyst Opinions |
|---|---|---|---|---|---|---|---|---|---|---|---|---|---|---|---|---|
| TSN | 55.6 | 34.3 | 14.3 | 0.5 | 9.8 | 0.4 | 1.1 | 19,562 | 27,214 | 0.40 | 6.1% | 3.9 | 56 | 63 | 75 | 12 |
| ADM | 78.4 | 21.5 | 13.8 | 0.6 | 15.6 | 0.5 | 1.6 | 37,766 | 46,628 | 0.63 | 3.1% | 5.7 | 60 | 80.3 | 95 | 10 |
| BG | 101.4 | 20.2 | 9.1 | 0.4 | 12 | 0.2 | 1.2 | 19,481 | 37,368 | 0.72 | -33.2% | 11.2 | 116 | 140.6 | 155 | 9 |
| GIS | 33.3 | — | 10.6 | 1.7 | 9.1 | 1 | 2.4 | 17,784 | 31,215 | 0.02 | 7.3% | 3.2 | 30 | 37 | 45 | 18 |
| INGR | 94.3 | 10.3 | 8.4 | 0.9 | 5.9 | 0.8 | 1.3 | 5,948 | 6,849 | 0.64 | 7.7% | 11.2 | 104 | 119.5 | 150 | 6 |
| ANDE | 63.9 | 12.3 | 10 | 0.3 | 10.1 | 0.2 | 1.6 | 2,175 | 3,047 | 0.66 | -5.0% | 6.4 | 80 | 86.7 | 90 | 3 |
Source: Yahoo Finance
Tyson trades at 0.5x EV/revenue, 34.3x trailing P/E, 14.3x forward P/E, 0.4x price/sales, and a 6.1% FCF yield, versus ADM at 0.6x, 21.5x, 13.8x, 0.5x, and 3.1%; BG at 0.4x, 20.2x, 9.1x, 0.2x, and -33.2%; GIS at 1.7x, no trailing P/E, 10.6x, 1.0x, and 7.3%; INGR at 0.9x, 10.3x, 8.4x, 0.8x, and 7.7%; and ANDE at 0.3x, 12.3x, 10.0x, 0.2x, and -5.0%. Tyson’s FCF yield is better than ADM’s and close to GIS’s and INGR’s, which supports a value lens, but its forward P/E is richer than BG, GIS, INGR, and ANDE, so the stock is not the cheapest on earnings. On a peer EV/revenue basis, Tyson’s implied equity value range is very wide, which tells me the market is already discounting a mid-cycle outcome rather than a distressed one. The key link is that Tyson’s lower growth does not justify a premium multiple, so the valuation only works if the margin recovery keeps progressing.
Profitability
| Company | Operating Margin (TTM) | Net Margin (TTM) | Return on Assets (TTM) | Return on Equity (TTM) | Gross Margin (TTM) | EBITDA Margin (TTM) |
|---|---|---|---|---|---|---|
| TSN | 2.7% | 1.0% | 2.6% | 3.3% | 6.6% | 5.0% |
| ADM | 4.0% | 2.2% | 2.3% | 7.6% | 6.9% | 3.6% |
| BG | 4.6% | 1.1% | 3.5% | 7.2% | 4.9% | 3.4% |
| GIS | 15.2% | -4.9% | 5.6% | -10.5% | 33.7% | 18.7% |
| INGR | 12.6% | 8.2% | 7.3% | 13.7% | 23.7% | 16.0% |
| ANDE | 1.6% | 1.6% | 3.0% | 12.2% | 7.2% | 2.8% |
Source: Yahoo Finance
TSN’s gross margin of 6.6%, EBITDA margin of 5.0%, operating margin of 2.7%, and net margin of 1.0% sit below ADM’s 6.9%, 3.6%, 4.0%, and 2.2%, BG’s 4.9%, 3.4%, 4.6%, and 1.1%, GIS’s 33.7%, 18.7%, 15.2%, and -4.9%, INGR’s 23.7%, 16.0%, 12.6%, and 8.2%, and ANDE’s 7.2%, 2.8%, 1.6%, and 1.6%. The pattern looks more like a cost-of-revenue gap than an opex problem because Tyson’s gross margin is already near the bottom of the group and its operating margin is only modestly lower than ADM and BG. That means the issue is mainly commodity input and processing economics, not a uniquely bloated overhead base.
Leverage
| Company | Total Debt/Equity % (mrq) | Current Ratio (mrq) | Total Debt (mrq, USD Mil) | Operating Cash Flow TTM (USD Mil) | Free Cash Flow TTM (USD Mil) | Net Debt/EBITDA (TTM) | FCF Margin % (TTM) |
|---|---|---|---|---|---|---|---|
| TSN | 44 | 1.4 | 8,006 | 2,004 | 1,191.2 | 2.6 | 2.1% |
| ADM | 39.1 | 1.4 | 9,342 | 2,795 | 1,164.6 | 2.8 | 1.4% |
| BG | 98 | 1.6 | 17,061 | 1,075 | -6,475.4 | 5.2 | -7.0% |
| GIS | 182.4 | 0.7 | 13,615.6 | 2,067 | 1,302.6 | 3.9 | 7.1% |
| INGR | 39.4 | 2.8 | 1,783 | 805 | 457.2 | 0.7 | 6.3% |
| ANDE | 66.3 | 1.5 | 900.8 | 321.9 | -109.1 | 2.8 | -1.0% |
Source: Yahoo Finance
Tyson’s debt/equity is 44.0% and net debt/EBITDA is 2.6x, versus ADM at 39.1% and 2.8x, BG at 98.0% and 5.2x, GIS at 182.4% and 3.9x, INGR at 39.4% and 0.7x, and ANDE at 66.3% and 2.8x. Tyson’s 2.1% FCF margin is weaker than GIS’s 7.1% and INGR’s 6.3%, but it is positive and comfortably above BG’s -7.0% and ANDE’s -1.0%, so leverage is a financing choice rather than a distress signal. The balance sheet is not a competitive advantage like INGR’s, but it is far from the stretched profile that would force a lower multiple.
Conclusion
I would put my rating as a Hold because Tyson is priced for a recovery that is visible in forward earnings but not yet in the operating trend. The most compelling strength is free cash flow yield of 6.1% TTM, which tells me the stock is already returning a respectable cash stream at $55.6 and limits downside if margins stay stable. The biggest risk is leverage plus thin cash conversion: net debt to EBITDA is 2.6x TTM and FCF margin is only 2.1% TTM, so a modest commodity setback could quickly squeeze equity value. Tyson looks fairly valued to me because the forward P/E of 14.3x on 3.90 of forward EPS is reasonable, but not cheap enough to ignore the earnings volatility.
I would raise my rating more towards a Buy if operating margin moves into the mid-single digits and stays there for two to three quarters, because that would show the current 2.7% TTM operating margin is not just a cyclical trough. On the current $55.7B revenue base, a move from 2.7% to 4.0% operating margin would add roughly $730M of annual operating profit, which would materially improve the deleveraging path and make the 2.6x net debt to EBITDA profile look safer.
I would move from Hold to Sell if Tyson cannot hold forward EPS near 3.90 while feed costs and customer pricing pressure stay elevated, because that would tell me the market is paying for earnings power that is not durable. A drop in EBITDA back toward the $500M to $600M quarterly range, rather than the $693M posted in Q2 2026, would also signal that the recent earnings rebound was too dependent on short-lived spread improvement.
Weighing both cases, I lean to the bull side first because Tyson already has the cash flow and balance sheet to absorb volatility, and the stock is not priced for distress. I am not more constructive yet because the margin base is still thin, so I want to see a few more quarters of operating margin stability before I move this to Buy.
What to Watch Next
- Operating margin above 2.7% and trending toward 4.0% — would support a move toward Buy.
- Net debt/EBITDA below 2.6x — would show deleveraging is actually taking hold.
- Quarterly EBITDA staying above $600M — would confirm the recent rebound is not a one-off.
- FCF margin above 2.1% — would show more earnings are converting into cash.
- Forward EPS holding near 3.90 — would support the current valuation and reduce downside risk.
What’s your take? I rated Tyson Foods (TSN) HOLD above — but the goal here is to get this right, not just to publish an opinion. What would you add to this analysis, or which risk or catalyst do you think I’m under- or over-weighting? Tell me in the comments.
Our track record: every directional call is tracked publicly on The Scorecard, and Stocks Covered lists every company we have rated and when.
Sources
- SEC 10-K Annual Report — filed 2024-11-12
- SEC 8-K Filing (2024-11-12)
- SEC 8-K Filing (2024-08-29)
- SEC 8-K Filing (2024-08-05)
- SEC 8-K Filing (2024-06-28)
- SEC 8-K Filing (2024-06-13)
- SEC 8-K Filing (2024-06-12)
- SEC Form 4 Insider Transaction (2026-05-11)
- SEC Form 4 Insider Transaction (2026-02-11)
- SEC Form 4 Insider Transaction (2026-02-11)
- SEC 10-K Annual Report — FY2024
- SEC 10-K Annual Report — FY2023
- SEC 10-K Annual Report — FY2022
- SEC 10-K Annual Report — FY2021
- SEC 10-K Annual Report — FY2020
Data sourced from Yahoo Finance and SEC EDGAR. Not investment advice.
Leave a Comment