
Expected price range
Each range is set from the stock’s recent price history and our Hold rating, using its own 1-year realised volatility (35% annualised) as the width of a ~68% statistical band, and checked against that rating so the range leans the same way as our view. Starting price $64.07 (close 2026-10-27). The stock traded between $63.73 and $80.87 over the last 6 months and between $46.31 and $80.87 over the last year. This is an illustration of where our view and normal volatility point, not a forecast, price target or investment advice; the stock can move outside it.
| Company | Oct 25 | Nov 25 | Dec 25 | Jan 26 | Feb 26 | Mar 26 | Apr 26 | May 26 | Jun 26 | Jul 26 | Aug 26 | Sep 26 | 12-Mo |
|---|---|---|---|---|---|---|---|---|---|---|---|---|---|
| ANDE | +17% | +11% | +3% | +17% | +5% | +10% | +10% | -10% | -3% | +4% | -8% | +1% | +67% |
| ADM | +1% | +1% | -5% | +17% | +3% | +5% | +3% | +8% | -4% | +4% | +3% | -2% | +37% |
| BG | +16% | +2% | -7% | +28% | +7% | +5% | -0% | -2% | -13% | -0% | +10% | -8% | +35% |
| TSN | -5% | +13% | +2% | +11% | +0% | -1% | +0% | -5% | -5% | +1% | -5% | -8% | -4% |
| GIS | -6% | +2% | -2% | +1% | -2% | -18% | -4% | -4% | +3% | +5% | +15% | -22% | -32% |
| INGR | -5% | -7% | +3% | +8% | -1% | -4% | -0% | -9% | -7% | +6% | +4% | -7% | -19% |
Source: Yahoo Finance monthly adjusted close.
Quick Thesis
- Rated hold — operating recovery is real, but cash conversion is still negative.
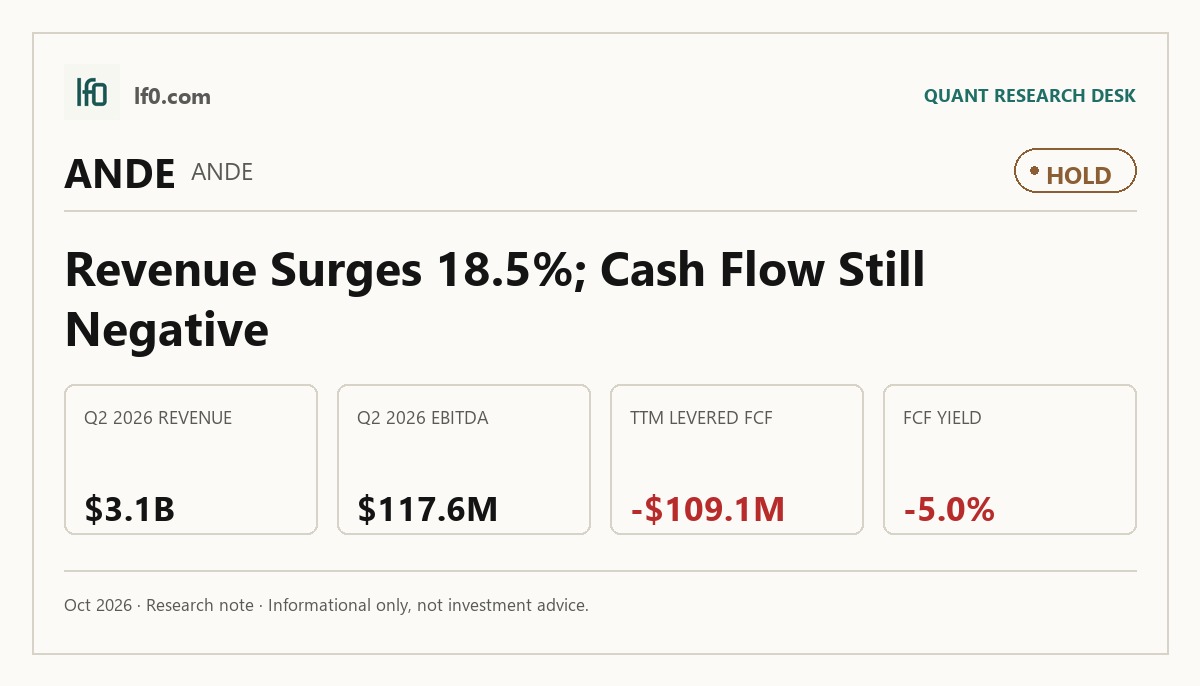
- Q2 2026 EBITDA reached $117.6M, showing better operating leverage.
- Levered free cash flow was -$109.1M TTM, the key risk to the thesis.
- Valuation is mixed: 12.4x trailing P/E and 10.1x EV/EBITDA, but -5.0% FCF yield.
- I would raise the rating if EBITDA stays above $117.6M and free cash flow turns positive.
Executive Summary
Rating: HOLD | ANDE
Measured from adjusted close on 2026-10-27 to 2026-10-28. Sell ratings are correct when the stock falls; Hold is tracked as a +/-10% range. Daily-close data, not intraday. Calls are tracked for 182 days from publication, then frozen as a final record.
I would put my rating as a Hold because The Andersons is showing a real operating rebound, but the market is already paying for it before cash conversion has caught up. Q2 2026 revenue rose 18.5% year over year to $3.1B, and EBITDA jumped to $117.6M from $69.4M in Q2 2025, which tells me the Agribusiness and Renewables mix is improving. The financial risk is still the negative free cash flow yield of -5.0% TTM, or levered free cash flow of -$109.1M TTM, because that means earnings are not yet translating into shareholder cash. I would become more constructive if management can hold EBITDA above $117.6M for several quarters and push free cash flow back above breakeven, which would show the recovery is self-funding rather than seasonal.
Company Profile
The Andersons, Inc. was founded in Maumee, Ohio in 1947 and is listed on Nasdaq under ANDE. It operates two segments: Agribusiness, which merchandises corn, wheat, soybeans, feed ingredients, fuel products, and fertilizers through grain elevators and logistics assets across the United States and Canada, and Renewables, which produces, purchases, and sells ethanol and co-products through four plants in Iowa, Indiana, Michigan, and Ohio with 405 million gallons of combined nameplate capacity. On July 31, 2025, it bought the remaining 49.9% of The Andersons Marathon Holdings LLC, a joint venture that was renamed The Andersons Renewables, LLC after the deal. As of December 31, 2025, it had 2,137 employees at about 180 locations across the United States, Canada, the United Kingdom, Switzerland, Mexico, Romania, and Singapore.
Economic Moat
Business Model
The Andersons’ edge comes from moving, storing, and marketing physical agricultural commodities across a broad North American footprint while also earning elevation margin from grain elevators across the United States and Canada. I feel a well-funded competitor would struggle to copy that within 3 years because it depends on location-specific assets, logistics relationships, and operating know-how rather than a single product or patent. The four ethanol plants in Iowa, Indiana, Michigan, and Ohio add a second layer of asset-based earnings power, and the company’s focus on leading the industry in margins per bushel points to operating discipline rather than pure volume chasing. That matters for the moat because the business wins by combining physical infrastructure with spread management, not by relying on one commodity cycle alone.
Business & Operating Risks
The most material disclosed risk is commodity price and margin volatility across Agribusiness and Renewables, because the company says it cannot hedge 100% of price risk and that large moves can force margin calls that hit liquidity. The filing is explicit that it is unable to offset all transaction risk, and its futures, options, and over-the-counter contracts are subject to margin calls, so a sharp grain or energy move can hurt earnings and cash at the same time. Corn is the clearest sub-risk: higher corn basis without a matching rise in petroleum-based fuel prices will typically reduce ethanol margins, which can quickly pressure Renewables if feedstock costs outrun fuel pricing. Section 45Z tax credit eligibility adds a second company-specific risk, since the credit runs through 2029 but depends on lifecycle emissions and labor standards, and the economic value remains uncertain as the transfer market develops. Trade policy is another live risk because tariffs can widen basis swings and raise raw material costs in nutrients. I do not think these risks break the moat itself, but they do threaten the spread-based earnings engine that the moat relies on, so the structural advantage is intact only if the company keeps managing volatility better than the market does.
Management Discussion & Analysis
Management is signaling that 2026 will be a capital-intensive year, not a balance-sheet repair year: it expects to invest $200M to $225M in property, plant and equipment, with roughly half of that split between growth and maintenance capital, while also having used $17.7M of the $100M share repurchase plan authorized on August 15, 2024. The $425M cash outlay to acquire the remaining interest in TAMH in 2025, together with the $35M of Section 45Z clean fuel production tax credits realized in 2025 and the nearly $40M of incremental plant income before income taxes from the July ethanol acquisition, shows a clear preference for owning more of the earnings stream and monetizing policy support rather than shrinking the balance sheet. That is a rational response to the risks above, but it also means cash is being directed first toward operating assets and growth initiatives, so investors should not expect aggressive deleveraging from free cash flow alone. Agribusiness still showed lower sales and merchandising revenues because of reduced commodity prices and volumes in the legacy footprint, so the growth narrative remains uneven even as Renewables benefits from stronger production and policy support.
Recent Events
The most important recent development is the March 20, 2026 credit amendment, which cut revolving capacity from $1.55B to $1.3B while pushing the revolver and the $114.3M term loan to March 20, 2031 and rolling the separate $170.1M and $86.3M term loans into a single $256.4M facility due March 20, 2034. I read that as a balance-sheet cleanup that extends runway, but the lower revolver cap also signals tighter lender discipline, so it supports the thesis only if operating cash flow keeps pace. The February 17, 2026 and May 5, 2026 8-Ks were routine earnings releases for Q4 2025 and Q1 2026, and the May 7, 2026 annual meeting was procedural, with the board slate re-elected, executive pay approved, and Deloitte retained. Those events leave governance unchanged rather than improved or impaired, so the recent filings reinforce stability more than they create a new catalyst.
Financial Analysis
Growth
ANDE — Financial Growth (Quarterly, USD Mil)
| Metric | 2025-03-31 | 2025-06-30 | 2025-09-30 | 2025-12-31 | 2026-03-31 | 2026-06-30 |
|---|---|---|---|---|---|---|
| REVENUE (USD Mil) | — | 3,135.9 | 2,677.7 | 2,536.2 | 2,627.3 | 3,097.7 |
| EBIT (USD Mil) | — | 36.3 | 36.3 | 99.7 | 50.7 | 83 |
| EBITDA (USD Mil) | — | 69.4 | 69 | 132.9 | 84.8 | 117.6 |
| NET INCOME (USD Mil) | — | 7.9 | 20.1 | 67.4 | 33.2 | 56.6 |
| DILUTED EPS | 0 | 0.2 | 0.6 | 2 | 1 | — |
Source: Yahoo Finance — Quarterly Financial Statements
Revenue has been choppy, but it is now re-accelerating. ANDE posted $2.5B in Q4 2025, then $2.6B in Q1 2026, and $3.1B in Q2 2026, so the latest quarter was up 18.5% year over year versus $2.6B in Q2 2025. EBITDA rose from $69.4M in Q2 2025 to $117.6M in Q2 2026, a faster gain than revenue, which means operating leverage improved as seasonal agribusiness volumes and export demand strengthened. That lines up with the MD&A discussion of stronger export and ethanol demand, so I read the growth trend as supportive of the moat described above, with durability still tied to whether the fall harvest and export support carry into 2026.
Profitability
ANDE — Profitability (TTM)
| Metric | TTM |
|---|---|
| Operating Margin (TTM) | 1.6% |
| Net Margin (TTM) | 1.6% |
| Return on Assets (TTM) | 3.0% |
| Return on Equity (TTM) | 12.2% |
| Gross Margin (TTM) | 7.2% |
| EBITDA Margin (TTM) | 2.8% |
Source: Yahoo Finance — Trailing Twelve Months (TTM)
TTM operating margin was 1.6%, TTM net margin was 1.6%, TTM gross margin was 7.2%, and TTM EBITDA margin was 2.8%. The spread between gross margin and operating margin is only 5.6 percentage points, which tells me the business is not losing most of its economics in overhead; the pressure comes from a low-margin commodity merchandising model where pricing and purchase costs move together. TTM ROA was 3.0% and TTM ROE was 12.2%, so returns are positive, but the ROE is much higher than ROA, which implies leverage is amplifying equity returns rather than the asset base itself generating exceptional profitability. For a company at this stage, the key signal to watch is operating margin moving meaningfully higher and staying there, because that would show the core business is earning through the cycle rather than just scraping by on spread capture.
Valuation
ANDE — Valuation Multiples
| Metric | Value |
|---|---|
| Current Share Price (USD) | 64.1 |
| Market Cap (USD Mil) | 2,182 |
| Enterprise Value (USD Mil) | 3,047 |
| Trailing P/E | 12.4 |
| Forward P/E | 10 |
| Price/Sales (TTM) | 0.2 |
| Price/Book (mrq) | 1.6 |
| EV/Revenue | 0.3 |
| EV/EBITDA | 10.1 |
| Beta (5Y Monthly) | 0.66 |
| FCF Yield % (TTM) | -5.0% |
| Forward EPS (USD) | 6.4 |
| Analyst Target Price – Low (USD) | 80 |
| Analyst Target Price – Mean (USD) | 86.7 |
| Analyst Target Price – High (USD) | 90 |
| # Analyst Opinions | 3 |
Source: Yahoo Finance
ANDE trades at 12.4x trailing P/E and 10.1x EV/EBITDA, with a 0.2x price-to-sales ratio, 0.3x EV/revenue, and a -5.0% FCF yield. That mix says the market is paying for earnings that are improving, but not for cash generation that is already proven. On the analysis here, I would put fair value in a range of $70–$85, which sits below the $80–$90 analyst target range and slightly below the $86.7 mean because I weight the negative free cash flow and commodity-cycle risk more heavily than the consensus appears to. The implied earnings power is better than the cash flow picture: forward EPS is $6.4, and at roughly 10x forward P/E that supports a mid-$60s stock, but the peer comparison shows ANDE’s cash conversion still lags the cleaner operators. I would not call the stock expensive on earnings alone, yet I also would not pay a premium until free cash flow turns positive and stays there.
Leverage
ANDE — Leverage & Coverage (Quarterly)
| Metric | Value |
|---|---|
| Total Debt/Equity % (mrq) | 66.3 |
| Current Ratio (mrq) | 1.5 |
| Total Debt (mrq, USD Mil) | 900.8 |
| Operating Cash Flow (TTM, USD Mil) | 321.9 |
| Levered Free Cash Flow (TTM, USD Mil) | -109.1 |
| Net Debt/EBITDA (TTM) | 2.8 |
| FCF Margin % (TTM) | -1.0% |
Source: Yahoo Finance — Quarterly Financial Statements
ANDE carries $900.8M of total debt against a current ratio of 1.5x and net debt to EBITDA of 2.8x. Operating cash flow was $321.9M TTM, but levered free cash flow was -$109.1M TTM and FCF margin was -1.0%, so EBITDA is not converting cleanly into cash. The gap points to working capital absorption and capital spending, which reduces financial flexibility even though near-term liquidity is still adequate. Total cash was $66.6M mrq, which leaves the balance sheet able to absorb some volatility but not enough to ignore refinancing or commodity-cycle risk if cash burn persists. The leverage profile is manageable, but it is not a source of upside on its own; the thesis depends on cash conversion improving faster than debt service pressure builds.
Insider Activity
The insider transaction record is one-sided selling: 17 open-market sales and 0 open-market purchases from 2025-01-02 to 2026-06-04. The pattern is concentrated, with Patrick E. Bowe accounting for most of the open-market activity, while the rest is limited to a single smaller sale by Rex Anne G. In my view, that is a bear signal because the selling is broad enough in dollar terms and there is no offsetting open-market buying to show insider alignment.
Comparable Analysis
LF0 has published standalone analyses of these peers: Archer-Daniels-Midland (ADM) (rated Hold); Bunge Global (BG) (rated Hold); Tyson Foods (TSN) (rated Hold); General Mills (GIS) (rated Hold); Ingredion (INGR) (rated Hold).
Growth
| Company | Revenue TTM (USD Mil) | Revenue Growth YoY % | EBITDA TTM (USD Mil) | Diluted EPS TTM |
|---|---|---|---|---|
| ANDE | 10,938.9 | -1.2% | 302.5 | 5.2 |
| ADM | 82,099 | 7.2% | 2,995 | 3.6 |
| BG | 91,819 | 88.3% | 3,126 | 5 |
| TSN | 55,694 | -0.1% | 2,772 | 1.6 |
| GIS | 18,296.6 | -2.8% | 3,415 | -1.6 |
| INGR | 7,215 | 0.9% | 1,154 | 9.2 |
Source: Yahoo Finance
Revenue growth is where ANDE trails the group: revenue fell 1.2% TTM, while ADM grew 7.2%, BG grew 88.3%, TSN was flat at -0.1%, GIS fell 2.8%, and INGR grew 0.9%. That puts ANDE behind the two growers and only slightly better than the two decliners, so the market is not paying for growth leadership here. On EBITDA, ANDE’s $302.5M TTM is far below ADM’s $3B and BG’s $3.1B, which reinforces that this is a smaller, more cyclical earnings base rather than a scale leader.
Valuation
| Company | Current Share Price (USD) | Trailing P/E | Forward P/E | EV/Revenue | EV/EBITDA | Price/Sales (TTM) | Price/Book (mrq) | Market Cap (USD Mil) | Enterprise Value (USD Mil) | Beta (5Y Monthly) | FCF Yield % (TTM) | Forward EPS | Analyst Target Price – Low | Analyst Target Price – Mean | Analyst Target Price – High | # Analyst Opinions |
|---|---|---|---|---|---|---|---|---|---|---|---|---|---|---|---|---|
| ANDE | 64.1 | 12.4 | 10 | 0.3 | 10.1 | 0.2 | 1.6 | 2,182 | 3,047 | 0.66 | -5.0% | 6.4 | 80 | 86.7 | 90 | 3 |
| ADM | 78.2 | 21.4 | 13.8 | 0.6 | 15.6 | 0.5 | 1.6 | 37,713 | 46,628 | 0.63 | 3.1% | 5.7 | 60 | 80.3 | 95 | 10 |
| BG | 101.5 | 20.2 | 9.1 | 0.4 | 12 | 0.2 | 1.2 | 19,502 | 37,368 | 0.72 | -33.2% | 11.2 | 116 | 140.6 | 155 | 9 |
| TSN | 55.6 | 34.3 | 14.3 | 0.5 | 9.8 | 0.4 | 1.1 | 19,548 | 27,214 | 0.40 | 6.1% | 3.9 | 56 | 63 | 75 | 12 |
| GIS | 33.2 | — | 10.5 | 1.7 | 9.1 | 1 | 2.4 | 17,778 | 31,215 | 0.02 | 7.3% | 3.2 | 30 | 37 | 45 | 18 |
| INGR | 94.2 | 10.3 | 8.4 | 0.9 | 5.9 | 0.8 | 1.3 | 5,942 | 6,849 | 0.64 | 7.7% | 11.2 | 104 | 119.5 | 150 | 6 |
Source: Yahoo Finance
ANDE’s 12.4x trailing P/E and 0.2x Price/Sales are cheaper than ADM’s 21.4x and 0.5x, but the stock is not obviously cheap once cash flow is included because its FCF yield is -5.0% versus positive yields for ADM, TSN, GIS, and INGR. The peer-implied valuation range is wide, but the key point is that ANDE’s lower sales multiple is offset by weaker cash conversion, so the discount is not a clean bargain signal. A $1 investment one year ago would be worth $1.40 in ANDE versus $1.31 in ADM, $1.35 in BG, $0.96 in TSN, $0.68 in GIS, and $0.81 in INGR, which tells me the market has already rewarded ANDE for the recovery before cash flow has fully caught up. That is why I think the stock screens as mixed rather than outright cheap.
Profitability
| Company | Operating Margin (TTM) | Net Margin (TTM) | Return on Assets (TTM) | Return on Equity (TTM) | Gross Margin (TTM) | EBITDA Margin (TTM) |
|---|---|---|---|---|---|---|
| ANDE | 1.6% | 1.6% | 3.0% | 12.2% | 7.2% | 2.8% |
| ADM | 4.0% | 2.2% | 2.3% | 7.6% | 6.9% | 3.6% |
| BG | 4.6% | 1.1% | 3.5% | 7.2% | 4.9% | 3.4% |
| TSN | 2.7% | 1.0% | 2.6% | 3.3% | 6.6% | 5.0% |
| GIS | 15.2% | -4.9% | 5.6% | -10.5% | 33.7% | 18.7% |
| INGR | 12.6% | 8.2% | 7.3% | 13.7% | 23.7% | 16.0% |
Source: Yahoo Finance
ANDE’s operating margin of 1.6%, net margin of 1.6%, gross margin of 7.2%, and EBITDA margin of 2.8% all sit below ADM’s 4.0%, 2.2%, 6.9%, and 3.6%, but above TSN’s 2.7%, 1.0%, 6.6%, and 5.0% only on gross margin and below GIS’s 15.2% and 18.7% by a wide gap. The pattern looks more like a scale and mix issue than a pure cost-of-revenue problem, because ANDE’s gross margin is not dramatically worse than ADM’s or TSN’s, yet its operating margin still lags, which points to weaker opex absorption rather than a broken product spread. ROE of 12.2% and ROA of 3.0% are respectable, but INGR still leads at 13.7% ROE and 7.3% ROA, so ANDE is solid rather than best-in-class.
Leverage
| Company | Total Debt/Equity % (mrq) | Current Ratio (mrq) | Total Debt (mrq, USD Mil) | Operating Cash Flow TTM (USD Mil) | Free Cash Flow TTM (USD Mil) | Net Debt/EBITDA (TTM) | FCF Margin % (TTM) |
|---|---|---|---|---|---|---|---|
| ANDE | 66.3 | 1.5 | 900.8 | 321.9 | -109.1 | 2.8 | -1.0% |
| ADM | 39.1 | 1.4 | 9,342 | 2,795 | 1,164.6 | 2.8 | 1.4% |
| BG | 98 | 1.6 | 17,061 | 1,075 | -6,475.4 | 5.2 | -7.0% |
| TSN | 44 | 1.4 | 8,006 | 2,004 | 1,191.2 | 2.6 | 2.1% |
| GIS | 182.4 | 0.7 | 13,615.6 | 2,067 | 1,302.6 | 3.9 | 7.1% |
| INGR | 39.4 | 2.8 | 1,783 | 805 | 457.2 | 0.7 | 6.3% |
Source: Yahoo Finance
ANDE’s debt/equity of 66.4% is above ADM’s 39.1% and INGR’s 39.4%, but below BG’s 98.0% and far below GIS’s 182.4%; its net debt/EBITDA of 2.8x is close to ADM’s 2.8x and TSN’s 2.6x, while GIS sits at 3.9x and BG at 5.2x. The more telling number is FCF margin at -1.0%, because ADM, TSN, GIS, and INGR all generate positive FCF margins of 1.4%, 2.1%, 7.1%, and 6.3%, so ANDE is financing its balance sheet from accounting earnings rather than cash. That is the main reason the valuation discount is not enough, by itself, to make the stock look obviously cheap.
Conclusion
I would put my rating as a Hold because the operating rebound is visible, but the cash flow profile still has not caught up. Q2 2026 EBITDA of $117.6M shows the business can earn through a better commodity backdrop, yet levered free cash flow remains -$109.1M TTM and FCF yield is -5.0%, so the recovery is not self-funding yet. That tension is the key issue for me: the moat is intact, but the numbers still show that the spread-based model has not fully translated into cash.
I would raise my rating more toward a Buy if ANDE can keep EBITDA above $117.6M for several quarters and turn free cash flow positive, because that would show the stronger export and ethanol backdrop is feeding through to cash rather than just accounting earnings. On the current revenue base, moving EBITDA margin from 2.8% TTM to 4.0% would add roughly $130M of annual EBITDA, which would materially improve deleveraging and make the 2.8x net debt to EBITDA profile look much safer. I would also want to see the credit amendment’s tighter revolver cap offset by stronger operating cash flow, since that would prove the company can live within a more disciplined liquidity structure.
I would move from Hold to Sell if the next two quarters show EBITDA slipping back toward the Q1 2026 level of $84.8M and levered free cash flow stays negative, because that would tell me the Q2 2026 rebound was seasonal rather than durable. The bear case gets stronger if commodity volatility forces another round of margin pressure while the company is still carrying $900.8M of debt, since that would leave the balance sheet exposed without the cash flow cushion needed to absorb a downturn. If that happens, the market would be paying for an earnings recovery that has not yet proven to me that it can survive a weaker spread environment.
Weighing both sides, I lean to the bull case on operations but not yet on valuation, and that is why I stop at Hold. The business is improving, but I want one more quarter of cash conversion before I pay up for the recovery.
What to Watch Next
- Q3 and Q4 2026 EBITDA above $117.6M — would support a move toward Buy.
- Free cash flow turning positive — would show the recovery is self-funding.
- EBITDA margin reaching 4.0% — would materially improve deleveraging.
- Net debt to EBITDA staying near 2.8x or lower — would keep refinancing risk contained.
- Revolver usage under the $1.3B cap — would confirm liquidity discipline.
What’s your take? I rated The Andersons (ANDE) HOLD above — but the goal here is to get this right, not just to publish an opinion. What would you add to this analysis, or which risk or catalyst do you think I’m under- or over-weighting? Tell me in the comments.
Our track record: every directional call is tracked publicly on The Scorecard, and Stocks Covered lists every company we have rated and when.
Sources
- SEC 10-K Annual Report — filed 2026-02-18
- SEC 8-K Filing (2026-05-07)
- SEC 8-K Filing (2026-05-05)
- SEC 8-K Filing (2026-03-25)
- SEC 8-K Filing (2026-02-17)
- SEC Form 4 Insider Transaction (2026-06-05)
- SEC Form 4 Insider Transaction (2026-05-08)
- SEC Form 4 Insider Transaction (2026-05-08)
- SEC 10-K Annual Report — FY2026
- SEC 10-K Annual Report — FY2025
- SEC 10-K Annual Report — FY2024
- SEC 10-K Annual Report — FY2023
- SEC 10-K Annual Report — FY2022
Data sourced from Yahoo Finance and SEC EDGAR. Not investment advice.
Leave a Comment