
| Company | Sep 25 | Oct 25 | Nov 25 | Dec 25 | Jan 26 | Feb 26 | Mar 26 | Apr 26 | May 26 | Jun 26 | Jul 26 | Aug 26 | 12-Mo |
|---|---|---|---|---|---|---|---|---|---|---|---|---|---|
| DOCN | +5% | +19% | +9% | +8% | +15% | +1% | +53% | +12% | +62% | +1% | -25% | -6% | +239% |
| RXT | +12% | +13% | -34% | -8% | -37% | +219% | -50% | +49% | +254% | +26% | -37% | -24% | +148% |
| DXC | -6% | +4% | -7% | +11% | -2% | -13% | -0% | -10% | -12% | -11% | +27% | +1% | -22% |
| CTSH | -7% | +9% | +7% | +7% | -1% | -21% | -5% | -14% | +6% | -31% | +43% | +17% | -9% |
| EPAM | -14% | +8% | +14% | +10% | +2% | -32% | -4% | -16% | -10% | -23% | +33% | +12% | -33% |
| KD | -6% | -4% | -11% | +3% | -13% | -46% | +6% | +5% | -10% | -9% | +20% | -1% | -58% |
Source: Yahoo Finance monthly adjusted close.
Quick Thesis
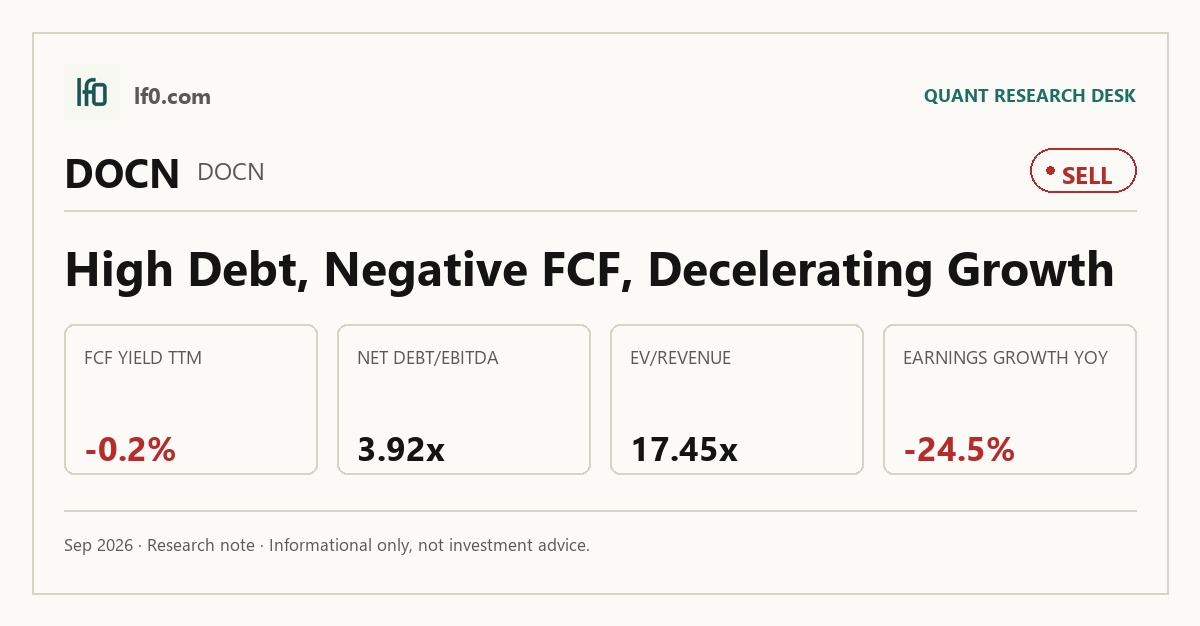
- Rated sell — cash conversion has not caught up with the valuation.
- Strongest point: revenue grew to 281.2M in Q2 2026, up 28.6% year over year.
- Biggest risk: levered free cash flow was -23.8M TTM, with net debt/EBITDA at 3.9x.
- Valuation is rich: 17.5x EV/revenue and 75.9x forward P/E.
- I would turn less negative if FCF turns positive and stays there for two to three quarters.
Executive Summary
Rating: SELL | DOCN
We’ll begin tracking this call’s performance since publication once sufficient adjusted-close data is available.
I would put my rating as a sell because DigitalOcean is priced for a cash conversion profile that has not arrived, even though revenue is still growing and the platform is broadening into higher-value AI workloads. The core issue is that the business is still consuming cash: levered free cash flow was -23.8M TTM and FCF margin was -2.4% TTM, so the current multiple is leaning on future execution rather than present proof. I also think the market is paying for a rerating that has already happened in the share price, not one that is still ahead.
I would become more constructive if levered free cash flow turns positive and stays there for two to three quarters, because that would show the 57.2% gross margin is finally flowing through to cash rather than being absorbed by capex and infrastructure spend. If operating margin also moves closer to EBITDA margin, I would read that as evidence that the business is converting scale into durable earnings, not just buying growth.
Company Profile
DigitalOcean Holdings Inc. provides cloud infrastructure and software for digital-native and AI-oriented businesses. Its platform includes Droplet virtual machines, storage, networking, managed databases, managed Kubernetes, managed hosting, and Gradient AI Agentic Cloud products such as GPU Droplets, Bare Metal GPUs, and model-first inference tools.
The company was incorporated in Delaware in 2012, completed its initial public offering in March 2021, and is listed on the New York Stock Exchange under DOCN. As of December 31, 2025, it served customers across nine geographic regions, leased data centers in the United States, Australia, Canada, Germany, India, the Netherlands, Singapore, and the United Kingdom, and planned new U.S. facilities in Memphis, Richmond, and Kansas City in 2026. It had 1,462 employees and 21,000 Digital Native Enterprise customers, which generated 60% of 2025 revenue.
Economic Moat
Business Model
I think the hardest-to-copy part of DigitalOcean’s model is the combination of simple cloud infrastructure, production-ready GPU capacity, and an agentic inference layer built for speed rather than enterprise complexity. That stack spans Droplet virtual machines, Managed Databases, Managed Kubernetes, Marketplace, GPU Droplets, Bare Metal GPUs, and the Gradient AI Agentic Cloud, so a rival would need to match both product breadth and the low-friction user experience at the same time.
A second advantage is distribution. The company’s self-service acquisition model is reinforced by 24/7 support and a large developer community, while its infrastructure footprint across nine geographic regions and a private backbone supports low-latency deployment. I also view the customer mix as supportive of the moat: the top 25 customers were 10% of revenue in 2025, so the platform is broad rather than dependent on a few accounts.
Business & Operating Risks
The main disclosed risk is customer churn and usage contraction, because most contracts can be terminated at will and customers can reduce usage without advance notice. That matters because the model depends on recurring consumption, so revenue can soften faster than management can replace it if usage trends weaken.
A second risk is third-party data center dependence. DigitalOcean leases space in multiple countries, and a facility failure could slow the network, reduce product functionality, and impair billing. Cybersecurity and customer-content liability remain another headwind because the business hosts customer workloads and user-generated content, which means a breach or misuse event would hit trust and retention at the same time. Taken together, these risks pressure the simplicity advantage in the moat, but they do not yet look like a structural break in the platform itself.
Management Discussion & Analysis
Management is responding to those risks by pushing harder into larger customers and higher-value workloads. ARR reached $970M in 2025 from $820M in 2024, and Digital Native Enterprise customers rose to 21,361 from 18,468, which tells me the company is trying to deepen usage rather than rely on smaller accounts. Revenue from those customers reached 60% of total revenue in 2025, up from 55% in 2024 and 53% in 2023, and net dollar retention improved to 100% from 98%, so the mix is moving in the right direction.
The financing side is more mixed. DigitalOcean issued $625M of 2030 Convertible Notes in August 2025 and drew $380M on Term Loan A under the 2025 Credit Facility, then used those proceeds to repurchase $1,187.7M of 2026 Convertible Notes. That pushes near-term maturity risk out, but it does not reduce the absolute debt burden, and the company is still funding a $100M buyback program while leverage remains elevated. In my view, management is supporting the moat with product and customer expansion, but it is not yet using cash generation to repair the balance sheet.
Recent Events
The most important recent event was the May 4, 2026 amendment to the credit agreement, which added $112.5M of revolver capacity and a $50M higher letter of credit sublimit while changing how capitalized leases are counted as indebtedness. That gives the company more flexibility for working capital, capex, and acquisitions, which supports the thesis that it is still investing behind cloud and AI demand.
The March 24, 2026 equity offering was also material. DigitalOcean sold 10.4M shares at $74.40 each, and the underwriters fully exercised the 1.6M-share option on March 25, 2026. Management said the proceeds would add infrastructure capacity, pay down Term Loan A, and fund general corporate purposes, so the event strengthens liquidity but also confirms that growth still requires external capital. The Barrick-style question here is whether financing flexibility is supporting the moat or masking it; at this point, I think it is doing both.
Financial Analysis
Growth
DOCN — Financial Growth (Quarterly, USD Mil)
| Metric | 2025-06-30 | 2025-09-30 | 2025-12-31 | 2026-03-31 | 2026-06-30 |
|---|---|---|---|---|---|
| REVENUE (USD Mil) | 218.7 | 229.6 | 242.4 | 257.9 | 281.2 |
| EBIT (USD Mil) | 44.7 | 95.4 | 41 | 35 | 34.6 |
| EBITDA (USD Mil) | 77.5 | 130.4 | 81.4 | 80.5 | 85.8 |
| NET INCOME (USD Mil) | 37 | 158.4 | 25.7 | 15.8 | 35.4 |
| DILUTED EPS | 0.4 | 1.5 | 0.2 | 0.1 | 0.3 |
Source: Yahoo Finance — Quarterly Financial Statements
Revenue rose from 218.7M in Q2 2025 to 281.2M in Q2 2026, a 28.6% increase, and the sequential path remained positive through the period. EBITDA also improved to 85.8M in Q2 2026, although it was choppier than revenue and peaked earlier at 130M in Q3 2025. I read that as healthy top-line momentum, but not yet as clean operating leverage.
The more important point is that growth is still being funded. Shares outstanding rose to 117.6M, so per-share progress is being diluted, and the company still needs to prove that the AI and cloud expansion described in the moat section can translate into durable cash generation.
Profitability
DOCN — Profitability (TTM)
| Metric | TTM |
|---|---|
| Operating Margin (TTM) | 10.4% |
| Net Margin (TTM) | 23.3% |
| Return on Assets (TTM) | 3.9% |
| Return on Equity (TTM) | 62.3% |
| Gross Margin (TTM) | 57.2% |
| EBITDA Margin (TTM) | 30.5% |
Source: Yahoo Finance — Trailing Twelve Months (TTM)
TTM gross margin of 57.2% shows the core platform still converts revenue into a healthy gross profit before overhead. The gap to EBITDA margin is wide, though: EBITDA margin was 30.5% TTM, operating margin was 10.4%, and net margin was 23.3%, which tells me a lot of the gross profit is still being consumed by sales, product, and infrastructure spending.
Return on assets was 3.86% TTM, while return on equity was 62.3% TTM. That spread is too wide to read as pure operating efficiency; leverage is doing a lot of the work. I would want to see operating margin move closer to EBITDA margin before I call the earnings quality fully durable.
Valuation
DOCN — Valuation Multiples
| Metric | Value |
|---|---|
| Current Share Price (USD) | 139.8 |
| Trailing P/E | 63.8 |
| Forward P/E | 75.9 |
| Price/Sales (TTM) | 16.2 |
| EV/Revenue | 17.4 |
| EV/EBITDA | 57.2 |
| Beta (5Y Monthly) | 1.57 |
| FCF Yield % (TTM) | -0.1% |
| Forward EPS (USD) | 1.8 |
| Analyst Target Price – Low (USD) | 140 |
| Analyst Target Price – Mean (USD) | 175.2 |
| Analyst Target Price – High (USD) | 200 |
| # Analyst Opinions | 15 |
Source: Yahoo Finance
DigitalOcean trades at 17.5x EV/revenue and 75.9x forward P/E on a current share price of 139.8. Those are rich multiples for a company with negative levered free cash flow, and the market is clearly paying for future cash conversion rather than current cash generation.
The analyst set is not thin, with 15 opinions, so the consensus matters. The stock sits just below the 140 low target, well under the 175.2 mean, and below the 200 high, which tells me the market is already discounting a fair amount of optimism but not the full consensus upside. On my read, fair value sits in a broad $120-$155 range, which is below the consensus mean because I weight negative FCF and 3.9x net debt/EBITDA more heavily than the growth rate alone. I would also frame the implied earnings power as roughly $1.6-$2.0 per share over the next year, which is close to the company’s 1.84 forward EPS and still expensive versus peers that already convert more of their revenue into cash.
That is why I stay cautious on the multiple. The valuation can work if growth keeps compounding and cash flow turns, but right now the stock is asking investors to pay up before that proof is visible.
Leverage
DOCN — Leverage & Coverage (Quarterly)
| Metric | Value |
|---|---|
| Total Debt/Equity % (mrq) | 212.5 |
| Current Ratio (mrq) | 1.3 |
| Net Debt/EBITDA (TTM) | 3.9 |
| FCF Margin % (TTM) | -2.4% |
Source: Yahoo Finance — Quarterly Financial Statements
Total debt was 1978 mrq, with total debt/equity at 212.5% and a current ratio of 1.311x. That is not a distress balance sheet, but it is levered enough that execution matters.
Operating cash flow was 310M TTM, yet levered free cash flow was -23.8M TTM and FCF margin was -2.4%. Net debt/EBITDA was 3.9x, so the company is still carrying meaningful leverage while cash conversion remains negative. I see that as the key tension in the thesis: the business can grow, but until cash flow turns, leverage limits how much of that growth belongs to equity holders.
Insider Activity
The insider transaction record is one-sided. The visible trades show sales by the CFO, two directors, and Access Industries Holdings LLC, with no open-market purchases in the period shown.
I would not overread the exact count, because the visible list is a sample rather than the full transaction history, but the direction is still useful. The pattern does not support a strong insider-confidence signal, and it fits the broader picture of a stock that has already rerated sharply.
Comparable Analysis
LF0 has published standalone analyses of these peers: Rackspace Technology (RXT) (rated Sell); EPAM Systems (EPAM) (rated Hold).
Growth
| Company | Revenue TTM (USD Mil) | Revenue Growth YoY % | Diluted EPS TTM |
|---|---|---|---|
| DOCN | 1,011.1 | 28.6% | 2.2 |
| RXT | 2,702.2 | 0.6% | -0.7 |
| DXC | 12,484 | -5.1% | 0.7 |
| CTSH | 21,642 | 4.5% | 4.7 |
| EPAM | 5,616.8 | 4.5% | 7.4 |
| KD | 14,967 | -3.3% | 0.4 |
Source: Yahoo Finance
DigitalOcean’s revenue growth was 28.6% TTM, well ahead of CTSH at 4.5%, EPAM at 4.5%, DXC at -5.1%, KD at -3.3%, and RXT at 0.6%. That is the main reason the stock commands a premium multiple, but the market is also asking for proof that this growth can keep translating into earnings and cash.
Valuation
| Company | Current Share Price (USD) | Trailing P/E | Forward P/E | EV/Revenue | EV/EBITDA | Price/Sales (TTM) | Price/Book (mrq) | Beta (5Y Monthly) | FCF Yield % (TTM) | Forward EPS | Analyst Target Price – Low | Analyst Target Price – Mean | Analyst Target Price – High | # Analyst Opinions |
|---|---|---|---|---|---|---|---|---|---|---|---|---|---|---|
| DOCN | 139.8 | 63.8 | 75.9 | 17.4 | 57.2 | 16.2 | 15.8 | 1.57 | -0.1% | 1.8 | 140 | 175.2 | 200 | 15 |
| RXT | 4 | — | 29.2 | 1.6 | 17 | 0.4 | -0.8 | 3.06 | 18.4% | 0.1 | 4 | 4.8 | 5.3 | 3 |
| DXC | 10.6 | 14.4 | 3.6 | 0.3 | 3.1 | 0.1 | 0.6 | 0.80 | 51.5% | 3 | 9 | 11.2 | 14 | 7 |
| CTSH | 57.3 | 12.3 | 9.1 | 1.2 | 6.7 | 1.3 | 1.8 | 0.83 | 8.6% | 6.3 | 47 | 65.1 | 84 | 25 |
| EPAM | 108.2 | 14.7 | 7.7 | 0.9 | 6.6 | 1 | 1.6 | 1.38 | 11.6% | 14.1 | 94 | 122.8 | 200 | 17 |
| KD | 11.6 | 31.4 | 4.7 | 0.4 | 4.2 | 0.2 | 2.4 | 1.71 | 105.0% | 2.5 | 13 | 14.2 | 16 | 5 |
Source: Yahoo Finance
DOCN trades at 17.5x EV/revenue, 63.8x trailing P/E, 75.9x forward P/E, and -0.2% FCF yield, versus CTSH at 1.2x, 12.3x, 9.1x, and 8.6%, EPAM at 0.9x, 14.7x, 7.7x, and 11.6%, DXC at 0.3x, 14.4x, 3.6x, and 51.5%, KD at 0.4x, 31.4x, 4.7x, and 105.0%, and RXT at 1.6x, no trailing P/E, 29.2x, and 18.4%. On a growth-adjusted basis, DOCN is expensive because the market is paying for a much faster top line without yet getting peer-leading cash conversion.
Profitability
| Company | Operating Margin (TTM) | Net Margin (TTM) | Return on Assets (TTM) | Return on Equity (TTM) | Gross Margin (TTM) | EBITDA Margin (TTM) |
|---|---|---|---|---|---|---|
| DOCN | 10.4% | 23.3% | 3.9% | 62.3% | 57.2% | 30.5% |
| RXT | -2.1% | -5.9% | -1.0% | — | 18.6% | 9.2% |
| DXC | 2.0% | 1.0% | 1.8% | 4.0% | 23.0% | 10.9% |
| CTSH | 17.5% | 10.3% | 10.7% | 14.9% | 33.4% | 18.6% |
| EPAM | 10.9% | 7.2% | 8.5% | 11.2% | 29.4% | 13.4% |
| KD | 2.9% | 0.6% | 3.0% | 6.9% | 21.8% | 8.8% |
Source: Yahoo Finance
DOCN’s gross margin of 57.2% and EBITDA margin of 30.5% are well above DXC, CTSH, EPAM, KD, and RXT, which confirms that the core platform is healthier than the valuation alone might suggest. The operating margin gap is smaller, though, at 10.4% versus 17.5% for CTSH and 10.9% for EPAM, so the company still spends more to turn gross profit into operating profit.
Leverage
| Company | Total Debt/Equity % (mrq) | Current Ratio (mrq) | Operating Cash Flow TTM (USD Mil) | Net Debt/EBITDA (TTM) | FCF Margin % (TTM) |
|---|---|---|---|---|---|
| DOCN | 212.5 | 1.3 | 310 | 3.9 | -2.4% |
| RXT | — | 0.8 | 104 | 12.9 | 6.9% |
| DXC | 125.4 | 1.4 | 1,480 | 1.6 | 7.0% |
| CTSH | 14.5 | 2.2 | 2,917 | 0.3 | 10.2% |
| EPAM | 4.3 | 2.8 | 538.8 | -0.8 | 11.6% |
| KD | 422.5 | 0.8 | 762 | 2.2 | 17.7% |
Source: Yahoo Finance
DOCN’s total debt/equity of 212.5% and net debt/EBITDA of 3.9x are heavier than CTSH’s 14.5% and 0.3x, EPAM’s 4.3% and -0.8x, and DXC’s 125.4% and 1.6x, while RXT is more stretched on net leverage at 12.9x. The key point is that DOCN’s leverage is not extreme in isolation, but it matters more because FCF margin is -2.4% and the company is not yet de-risking the balance sheet through cash generation.
Conclusion
I would put my rating as a sell because the stock already prices in a cash conversion profile that the business has not yet delivered. Revenue growth is still strong, gross margin is healthy, and the customer mix is improving, but the numbers that matter most for equity holders are still weak: levered free cash flow was -23.8M TTM, FCF margin was -2.4% TTM, and net debt/EBITDA was 3.9x.
The bull case is straightforward. If quarterly EBITDA stays around the current 85.8M level and levered free cash flow turns positive for two to three quarters, I would view that as evidence that the platform is finally converting scale into cash rather than just into more infrastructure spend. That would also make the current valuation easier to defend, because the market would be paying for growth that is beginning to self-fund.
The bear case is just as clear. If revenue growth slips below 20% year over year for two straight quarters, the premium multiple becomes much harder to justify, especially if FCF stays negative and net debt/EBITDA moves above 4.5x, meaning leverage is rising faster than cash generation. In that scenario, the stock would be priced for a growth rate that is fading before the cash flow inflection arrives.
My final view is that the negative cash flow and leverage profile are more likely to matter first than the upside from the AI platform. The market has already given DigitalOcean a lot of credit for the rerating, and I would want to see cash conversion prove itself before I move away from sell.
What to Watch Next
- Quarterly levered free cash flow turns positive — would support a move away from sell.
- EBITDA holds near 85.8M while revenue keeps growing — would show operating leverage is improving.
- Revenue growth stays above 20% year over year — would help defend the premium multiple.
- Net debt/EBITDA stays below 4.5x — would limit refinancing risk.
- FCF margin moves above zero — would show growth is funding itself.
What’s your take? I rated DigitalOcean (DOCN) SELL above — but the goal here is to get this right, not just to publish an opinion. What would you add to this analysis, or which risk or catalyst do you think I’m under- or over-weighting? Tell me in the comments.
Sources
- SEC 10-K Annual Report — filed 2026-02-24
- SEC 8-K Filing (2026-05-05)
- SEC 8-K Filing (2026-03-26)
- SEC 8-K Filing (2026-02-24)
- SEC Form 4 Insider Transaction (2026-06-03)
- SEC Form 4 Insider Transaction (2026-06-03)
- SEC Form 4 Insider Transaction (2026-06-03)
- SEC 10-K Annual Report — FY2026
- SEC 10-K Annual Report — FY2025
- SEC 10-K Annual Report — FY2024
- SEC 10-K Annual Report — FY2023
- SEC 10-K Annual Report — FY2022
Data sourced from Yahoo Finance and SEC EDGAR. Not investment advice.
Leave a Comment