
| Company | Aug 25 | Sep 25 | Oct 25 | Nov 25 | Dec 25 | Jan 26 | Feb 26 | Mar 26 | Apr 26 | May 26 | Jun 26 | Jul 26 | 12-Mo |
|---|---|---|---|---|---|---|---|---|---|---|---|---|---|
| WGS | +27% | -17% | +27% | +22% | -22% | -26% | -17% | -19% | -2% | -17% | +32% | -5% | -36% |
| VEEV | -5% | +11% | -2% | -17% | -7% | -9% | -11% | -3% | -11% | +12% | +2% | +15% | -28% |
| TEM | +34% | +6% | +11% | -13% | -24% | +1% | -11% | -15% | +23% | -9% | +15% | -24% | -22% |
| NTRA | +26% | -4% | +24% | +20% | -4% | +1% | -10% | -4% | +3% | +8% | +22% | -1% | +100% |
| GH | +65% | -7% | +49% | +17% | -6% | +12% | -18% | -2% | -6% | +49% | +16% | +8% | +295% |
| FLGT | +29% | +2% | -1% | +32% | -11% | -0% | -41% | +4% | -4% | +19% | +13% | -19% | -4% |
Source: Yahoo Finance monthly adjusted close.
Executive Summary
Rating: SELL | WGS
Measured from adjusted close on 2026-08-10 to 2026-09-25. Sell ratings are correct when the stock falls; Hold is tracked as a +/-10% range. Daily-close data, not intraday. Calls are tracked for 182 days from publication, then frozen as a final record.
I would put my rating as a Sell because the market is still pricing GeneDx for a clean earnings recovery that the latest cash flow and margin data do not support. The company has a real data and interpretation moat, but revenue growth of 11.4% TTM has not yet translated into positive free cash flow, and that gap is the core issue in my view. I would move from Sell to Hold only if revenue growth reaccelerates into the high teens and free cash flow turns positive, because that would show the exome and genome mix is finally funding itself rather than just scaling volume.
Company Profile
GeneDx Holdings Corp. develops clinical genetic tests, with revenue driven mainly by exome and genome sequencing reports and, increasingly, by data and interpretation services. Founded in 2000 by scientists from the National Institutes of Health, it launched the first commercially available next-generation sequencing panels in 2008, pioneered exome sequencing in 2012, acquired Legacy GeneDx on April 29, 2022, and bought Fabric Genomics on May 5, 2025 to support international expansion and AI-based interpretation. The company operates a clinical reference laboratory in Gaithersburg, Maryland, and holds state laboratory licenses in Maryland, New York, California, Pennsylvania, and Rhode Island. It serves U.S. and international referral sources, with about 15% of 2025 revenue from outside the United States. GeneDx trades on Nasdaq under WGS, and its public warrants trade under WGSWW.
Economic Moat
Business Model
GeneDx’s most defensible advantage is the GeneDx Infinity dataset, which includes more than 25 million tests, over 1 million exomes and genomes, more than 8 million phenotypic datapoints, and billions of longitudinal clinical and claims datapoints, according to its SEC filings. I feel that a well-funded competitor would struggle to recreate that depth within 3 years because the dataset compounds only as new patients are tested, reanalyzed, and linked to outcomes. The company also has a second layer of protection in its clinical interpretation stack, where more than 100 MDs and PhDs and 150 genetic counselors turn that data into faster and more actionable diagnoses, and in its regulatory position, including FDA Breakthrough Device Designation in October 2025 for ExomeDx and GenomeDx. That combination matters because the moat is not just data volume, but data plus interpretation plus regulatory credibility, which is harder to copy than a single test menu.
Business & Operating Risks
The most material risk is reimbursement, because GeneDx still depends on third-party payors for the majority of diagnostic test revenue and coverage depends on whether a test is medically necessary, cost-effective, and pre-authorized. In 2025, 345,235 of the company’s diagnostic test revenue came from patients with third-party insurance, and payors can deny payment, recoup amounts already paid, or force retroactive adjustments. A second risk is the company’s dependence on a limited supplier base for reagents and lab inputs: one supplier accounted for approximately 20.0% of purchases in FY2025, and another accounted for 13.0% in FY2024, so a disruption or price increase at a single vendor could quickly hit cost of services and test throughput. The third risk is revenue concentration in payor groups and billing mechanics, with Payor group B representing 39.0% of revenue in FY2025 and 35.0% of accounts receivable at December 31, 2025. Taken together, these risks pressure the cash conversion of the moat, but they do not negate the dataset advantage itself; they threaten how efficiently that advantage turns into cash.
Management Discussion & Analysis
Management is responding to those risks by pushing harder into exome and genome testing, and the mix shift is visible in the numbers: 97,271 resulted exome and genome tests in 2025, up from 74,547 in 2024 and 49,439 in 2023. The company also used the 2025 Fabric Genomics acquisition to deepen its AI-based interpretation platform, which is the right strategic answer to reimbursement pressure because it raises the clinical value of each test rather than relying only on volume. I do not read the cost base as fully under control yet. Research and development rose 58.0% to $72M in 2025, and general and administrative expense rose 44.0%, so management is still spending ahead of operating leverage. The refinancing and the cash balance show better liquidity discipline than in earlier years, but the business is still not self-funding, which means execution on collections and overhead remains central.
Recent Events
The most significant recent development is the February 27, 2026 refinancing, when GeneDx replaced its prior credit agreement with a $100M term loan from Blackstone, secured by a first lien on substantially all assets and carrying a five-year maturity plus a $50M minimum liquidity covenant. That improves flexibility, but the covenant also tells me lenders are still underwriting a business that needs discipline, not a blank check. The May 4, 2026 filing was more about presentation than strategy, yet it still matters because management combined selling and marketing with general and administrative into one line and revised adjusted net income to include non-core lease costs tied to vacant Connecticut facilities. In my view, that is a useful sign of cost cleanup, but it only helps the moat if those lease costs keep shrinking rather than becoming a recurring drag.
Financial Analysis
Growth
WGS — Financial Growth (Quarterly, USD Mil)
| Metric | 2025-03-31 | 2025-06-30 | 2025-09-30 | 2025-12-31 | 2026-03-31 | 2026-06-30 |
|---|---|---|---|---|---|---|
| REVENUE (USD Mil) | — | 102.7 | 116.7 | 121 | 102.3 | 114.4 |
| EBIT (USD Mil) | — | 11.4 | -3.3 | -14.2 | -61.7 | -17.1 |
| EBITDA (USD Mil) | — | 17.6 | 3.2 | -7.4 | -54.9 | -10.4 |
| NET INCOME (USD Mil) | — | 10.8 | -7.6 | -17.7 | -63.3 | -17.7 |
| DILUTED EPS | -0.2 | 0.4 | -0.3 | — | -2.2 | -0.6 |
Source: Yahoo Finance — Quarterly Financial Statements
Revenue was $102.7M in Q2 2025, $116.7M in Q3 2025, $121M in Q4 2025, $102.3M in Q1 2026, and $114.4M in Q2 2026, so the top line is volatile rather than steadily compounding. On a year-over-year basis, Q2 2026 revenue was up 11.4% versus $102.7M in Q2 2025, which is respectable but not enough to call the business an acceleration story. EBITDA moved much faster than revenue, swinging from $17.6M in Q2 2025 to -$54.9M in Q1 2026 and -$10.4M in Q2 2026, so earnings are still lagging the sales base. That gap matters because the moat described above only becomes investable if the sequencing mix can convert into durable cash generation.
Profitability
WGS — Profitability (TTM)
| Metric | TTM |
|---|---|
| Operating Margin (TTM) | -15.2% |
| Net Margin (TTM) | -23.4% |
| Return on Assets (TTM) | -7.9% |
| Return on Equity (TTM) | -40.8% |
| Gross Margin (TTM) | 69.4% |
| EBITDA Margin (TTM) | -7.4% |
Source: Yahoo Finance — Trailing Twelve Months (TTM)
TTM gross margin was 69.4%, which tells me the test itself still carries healthy unit economics before overhead. The problem is the gap to TTM EBITDA margin of -7.4% and TTM operating margin of -15.2%, which means selling, lab, and corporate costs are still absorbing more than the gross profit base can cover. TTM net margin of -23.4% goes further, so below-the-line items are still pushing losses deeper rather than narrowing them. TTM return on assets of -7.9% and TTM return on equity of -40.8% confirm the business is still destroying capital, and the much worse ROE than ROA suggests leverage is amplifying those losses rather than creating durable shareholder returns. Investors should watch for EBITDA margin turning positive first, because that would show the core operating model is finally scaling; until then, the profitability profile remains a bear signal.
Valuation
WGS — Valuation Multiples
| Metric | Value |
|---|---|
| Market Cap (USD Mil) | 2,299 |
| Enterprise Value (USD Mil) | 2,334 |
| Forward P/E | 68.7 |
| Price/Sales (TTM) | 5.1 |
| Price/Book (mrq) | 9 |
| EV/Revenue | 5.1 |
| EV/EBITDA | -69.3 |
| Beta (5Y Monthly) | 1.98 |
| FCF Yield % (TTM) | -2.1% |
| Forward EPS (USD) | 1.1 |
| Analyst Target Price – Low (USD) | 63 |
| Analyst Target Price – Mean (USD) | 85.9 |
| Analyst Target Price – High (USD) | 103 |
| # Analyst Opinions | 9 |
Source: Yahoo Finance
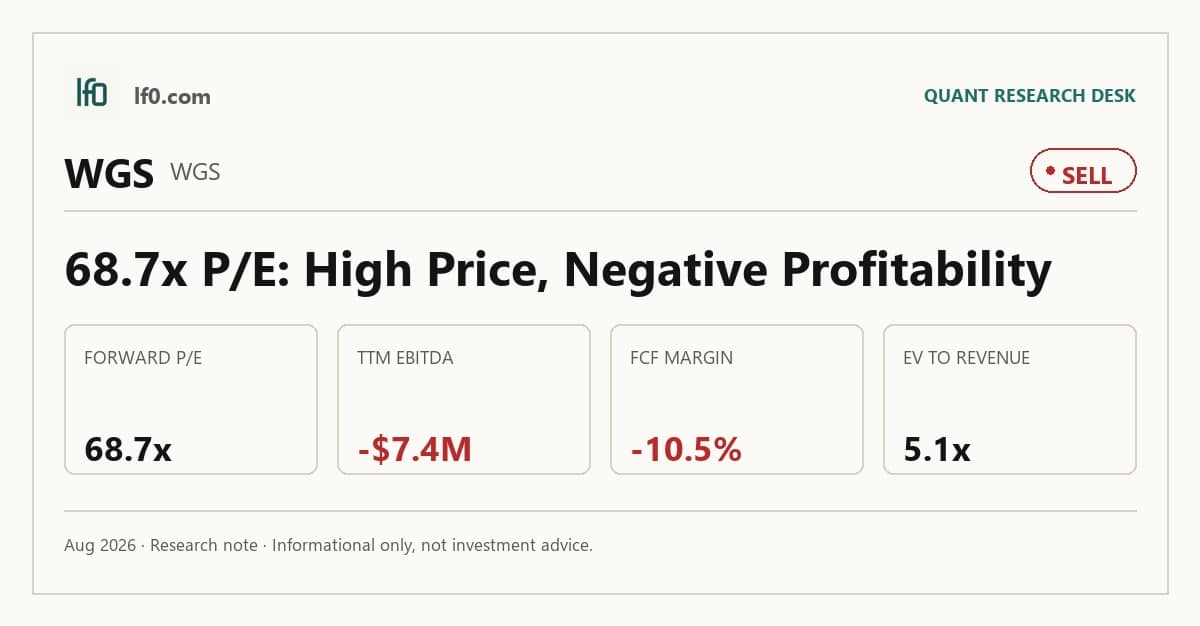
I would put fair value in a range of $35-$55 based on the current revenue base, the negative cash conversion, and the fact that the market is already paying for a much cleaner earnings path than the business has delivered. That range sits below the $63.0-$103.0 analyst target band, and in my view the gap reflects that consensus is giving more credit to margin recovery than the latest operating data justify. Forward EPS is 1.12, which implies a forward P/E of 68.7x; that is rich for a company still posting negative free cash flow, even if the gross margin profile is attractive. On a like-for-like basis, the implied earnings path is also less compelling than peers with stronger cash generation, so I would need to see positive free cash flow before I would treat the current multiple as justified.
WGS trades at 5.13x EV/Revenue, 5.06x Price/Sales, 68.7x forward P/E, and a -2.07% FCF yield, while EV/EBITDA is negative because trailing EBITDA is still below zero. Price/Book is 9x, which is rich for a business with $132.6M of cash and $167.4M of debt, so the stock is not being priced as a balance-sheet liquidation case. The valuation only makes sense if revenue growth and margin expansion move together; if they do not, the multiple leaves little room for error.
Leverage
WGS — Leverage & Coverage (Quarterly)
| Metric | Value |
|---|---|
| Total Debt/Equity % (mrq) | 68.5 |
| Current Ratio (mrq) | 3.3 |
| Total Debt (mrq, USD Mil) | 167.4 |
| Operating Cash Flow (TTM, USD Mil) | -48.7 |
| Levered Free Cash Flow (TTM, USD Mil) | -47.5 |
| Net Debt/EBITDA (TTM) | -1 |
| FCF Margin % (TTM) | -10.4% |
Source: Yahoo Finance — Quarterly Financial Statements
Total debt was $167.4M (mrq), while total debt/equity was 68.55% (mrq) and the current ratio was 3.301x (mrq), so the balance sheet has near-term liquidity but not a net-cash profile. Total cash was $132.5M (mrq), which leaves net debt modest and helps absorb a short downturn, but it does not eliminate refinancing risk if cash burn persists. Operating cash flow was -$48.71M (TTM) and levered free cash flow was -$47.5M (TTM), with FCF margin at -10.5% (TTM). EBITDA conversion is weak because the business is consuming cash rather than generating it, so reported operating scale is not yet funding itself. Net debt/EBITDA was -1.0x (TTM), which reflects cash exceeding EBITDA rather than a durable credit cushion. In my opinion, this is medium refinancing risk because current liquidity is solid, but negative operating cash flow and negative free cash flow mean that cushion erodes unless earnings improve.
Insider Activity
The insider transaction record I see here is clearly net buying, with 39 open-market purchases totaling $115.2M versus 111 open-market sales totaling $33.7M over 2025-01-02 to 2026-06-05. The activity is concentrated, led by repeated buying from Casdin Capital, LLC and Keith A. Meister, so the signal is not broad across many holders but it is still strongly aligned with shareholders. I would treat that as supportive, not decisive: insider buying helps when the operating data are improving, but it does not offset negative free cash flow on its own.
Comparable Analysis
Growth
| Company | Revenue TTM (USD Mil) | Revenue Growth YoY % | Diluted EPS TTM |
|---|---|---|---|
| WGS | 454.4 | 11.4% | -3.6 |
| VEEV | 3,319.2 | 16.3% | 5.7 |
| TEM | 1,432 | 21.6% | -1.4 |
| NTRA | 2,707.1 | 37.7% | -1.4 |
| GH | 1,183.1 | 44.3% | -3.5 |
| FLGT | 323.9 | 4.4% | -2.8 |
Source: Yahoo Finance
WGS revenue grew 11.4% TTM on $454.4M of revenue, which trails VEEV at 16.3%, TEM at 21.6%, NTRA at 37.7%, and GH at 44.3%, while FLGT was slower at 4.4%. That puts WGS in the middle of the pack only on absolute scale, not on growth leadership, so the market is not paying for the fastest grower here.
Valuation
| Company | Trailing P/E | Forward P/E | EV/Revenue | EV/EBITDA | Price/Sales (TTM) | Price/Book (mrq) | Market Cap (USD Mil) | Enterprise Value (USD Mil) | Beta (5Y Monthly) | FCF Yield % (TTM) | Forward EPS | Analyst Target Price – Low | Analyst Target Price – Mean | Analyst Target Price – High | # Analyst Opinions |
|---|---|---|---|---|---|---|---|---|---|---|---|---|---|---|---|
| WGS | — | 68.7 | 5.1 | -69.3 | 5.1 | 9 | 2,299 | 2,334 | 1.98 | -2.1% | 1.1 | 63 | 85.9 | 103 | 9 |
| VEEV | 40.8 | 23 | 9.1 | 29.5 | 11.3 | 5.1 | 37,438 | 30,229 | 0.92 | 3.4% | 10 | 165 | 244.1 | 350 | 28 |
| TEM | — | -3,424.3 | 7 | -49.5 | 6.6 | 21.1 | 9,392 | 10,020 | 3.58 | -1.1% | 0 | 35 | 62.6 | 100 | 14 |
| NTRA | — | -3,397.7 | 16.8 | -203.1 | 17.2 | 25.9 | 46,429 | 45,576 | 1.51 | 0.2% | -0.1 | 193 | 316.9 | 375 | 20 |
| GH | — | -374.3 | 19.7 | -54 | 19.1 | -101 | 22,609 | 23,253 | 1.59 | 0.1% | -0.5 | 105 | 194.3 | 225 | 24 |
| FLGT | — | -13.9 | 0.8 | -3.1 | 1.6 | 0.5 | 527 | 274 | 0.91 | -17.3% | -1.4 | 19 | 19 | 19 | 1 |
Source: Yahoo Finance
WGS trades at 5.1x EV/Revenue and 5.1x Price/Sales, which is below VEEV’s 9.1x EV/Revenue but above FLGT’s 0.8x and below NTRA’s 16.8x. The key point is that WGS’s 11.4% growth and negative 10.5% FCF margin do not support a premium multiple, especially when VEEV pairs a richer multiple with positive 38.0% FCF margin and 10.0 forward EPS. On a peer-adjusted basis, WGS looks expensive for a business that is still burning cash, and the stock performance reinforces that view: a $1 investment a year ago would be worth $0.73 in WGS versus $0.82 in VEEV, $0.86 in TEM, $2.12 in NTRA, $3.11 in GH, and $0.94 in FLGT.
Profitability
| Company | Operating Margin (TTM) | Net Margin (TTM) | Return on Assets (TTM) | Return on Equity (TTM) | Gross Margin (TTM) | EBITDA Margin (TTM) |
|---|---|---|---|---|---|---|
| WGS | -15.2% | -23.4% | -7.9% | -40.8% | 69.4% | -7.4% |
| VEEV | 30.9% | 28.4% | 7.3% | 13.9% | 75.0% | 30.9% |
| TEM | -19.8% | -17.8% | -8.8% | -67.4% | 64.0% | -14.1% |
| NTRA | -10.3% | -7.1% | -8.1% | -12.5% | 65.2% | -8.3% |
| GH | -38.2% | -38.3% | -18.1% | — | 65.0% | -36.4% |
| FLGT | -39.4% | -26.0% | -6.3% | -8.1% | 35.6% | -27.6% |
Source: Yahoo Finance
WGS has a 69.4% gross margin, a -15.2% operating margin, a -23.4% net margin, and a -7.4% EBITDA margin. That is better than TEM and FLGT on gross margin, but much weaker than VEEV’s 75.0% gross margin and 30.9% operating margin, which tells me WGS’s problem is overhead and scale efficiency rather than product economics. The gap between gross margin and operating margin is the real issue, and it is wide enough that the company still needs several quarters of execution before it can claim peer-level quality.
Leverage
| Company | Total Debt/Equity % (mrq) | Current Ratio (mrq) | Total Debt (mrq, USD Mil) | Operating Cash Flow TTM (USD Mil) | Free Cash Flow TTM (USD Mil) | Net Debt/EBITDA (TTM) | FCF Margin % (TTM) |
|---|---|---|---|---|---|---|---|
| WGS | 68.5 | 3.3 | 167.4 | -48.7 | -47.5 | -1 | -10.4% |
| VEEV | 1.4 | 4.7 | 103.1 | 1,665.2 | 1,259.5 | -7 | 38.0% |
| TEM | 324.6 | 3.3 | 1,444.2 | -237.4 | -99.1 | -3.1 | -6.9% |
| NTRA | 13.1 | 3 | 238.5 | 228.2 | 104 | 3.8 | 3.8% |
| GH | — | 4 | 1,697 | -185.2 | 26.6 | -1.5 | 2.2% |
| FLGT | 1 | 6.3 | 9.6 | -83.7 | -90.9 | 2.8 | -28.1% |
Source: Yahoo Finance
WGS’s debt/equity ratio of 68.6% is far below TEM’s 324.6%, but it is still meaningfully above VEEV’s 1.4% and FLGT’s 1.0%. Current ratio is 3.3x, which matches TEM and trails VEEV’s 4.7x, while WGS’s -10.5% FCF margin is weaker than NTRA’s 3.8% and GH’s 2.2%. The combination matters: WGS is not the most levered name in the group, but it also does not have the cash generation that would make its leverage a competitive advantage.
Conclusion
I would put my rating as a Sell because the key tension is now clear: GeneDx has a real data moat and a better balance sheet than it did a few years ago, but the latest numbers still show that revenue growth is not yet turning into self-funding earnings. Gross margin of 69.4% tells me the test economics are sound, yet TTM operating margin of -15.2% and free cash flow margin of -10.5% say overhead, collections, and reimbursement are still taking too much of the value out of the model.
I would raise my rating more towards a Hold if revenue growth reaccelerates into the high teens and free cash flow turns positive, because that would show the exome and genome mix is finally converting into cash rather than just volume. I would also want to see accounts receivable stop rising faster than revenue, since that would tell me reimbursement and collections are catching up to the top line. On the other side, I would move from Sell to Strong Sell if growth slips back toward the low single digits or if the company keeps burning cash at roughly the current pace, because then the 5.1x EV/Revenue multiple and 68.7x forward P/E would be pricing in a margin recovery that is not arriving.
Weighing both sides, I still lean bearish because the operating evidence has not yet caught up with the quality of the moat. The business is better than it was, but I would need to see positive free cash flow and a sustained margin inflection before I would say the stock deserves the current valuation.
What’s your take? I rated GeneDx (WGS) SELL above — but the goal here is to get this right, not just to publish an opinion. What would you add to this analysis, or which risk or catalyst do you think I’m under- or over-weighting? Tell me in the comments.
Sources
- SEC 10-K Annual Report — filed 2026-02-23
- SEC 8-K Filing (2026-05-04)
- SEC 8-K Filing (2026-03-02)
- SEC 8-K Filing (2026-02-23)
- SEC 8-K Filing (2026-01-12)
- SEC Form 4 Insider Transaction (2026-06-08)
- SEC Form 4 Insider Transaction (2026-06-03)
- SEC Form 4 Insider Transaction (2026-05-20)
- SEC 10-K Annual Report — FY2026
- SEC 10-K Annual Report — FY2025
- SEC 10-K Annual Report — FY2024
- SEC 10-K Annual Report — FY2023
- SEC 10-K Annual Report — FY2022
Data sourced from Yahoo Finance and SEC EDGAR. Not investment advice.
Leave a Comment