| Company | Oct 25 | Nov 25 | Dec 25 | Jan 26 | Feb 26 | Mar 26 | Apr 26 | May 26 | Jun 26 | Jul 26 | Aug 26 | Sep 26 | 12-Mo |
|---|---|---|---|---|---|---|---|---|---|---|---|---|---|
| GFI | -8% | +12% | +2% | +15% | +17% | -21% | -6% | -6% | -16% | -3% | +43% | -20% | -9% |
| CDE | -8% | +1% | +3% | +15% | +33% | -31% | -4% | +8% | -16% | -9% | +39% | -15% | -6% |
| AEM | -5% | +8% | -3% | +12% | +32% | -19% | -7% | -3% | -15% | -6% | +40% | -10% | +10% |
| NEM | -4% | +12% | +10% | +13% | +16% | -17% | +3% | -1% | -15% | +0% | +35% | -8% | +38% |
| PAAS | -9% | +30% | +13% | +5% | +26% | -20% | -4% | +9% | -21% | -4% | +21% | -12% | +19% |
| AG | +4% | +19% | +9% | +25% | +54% | -33% | -8% | +7% | -20% | -11% | +37% | -14% | +44% |
Source: Yahoo Finance monthly adjusted close.
Quick Thesis
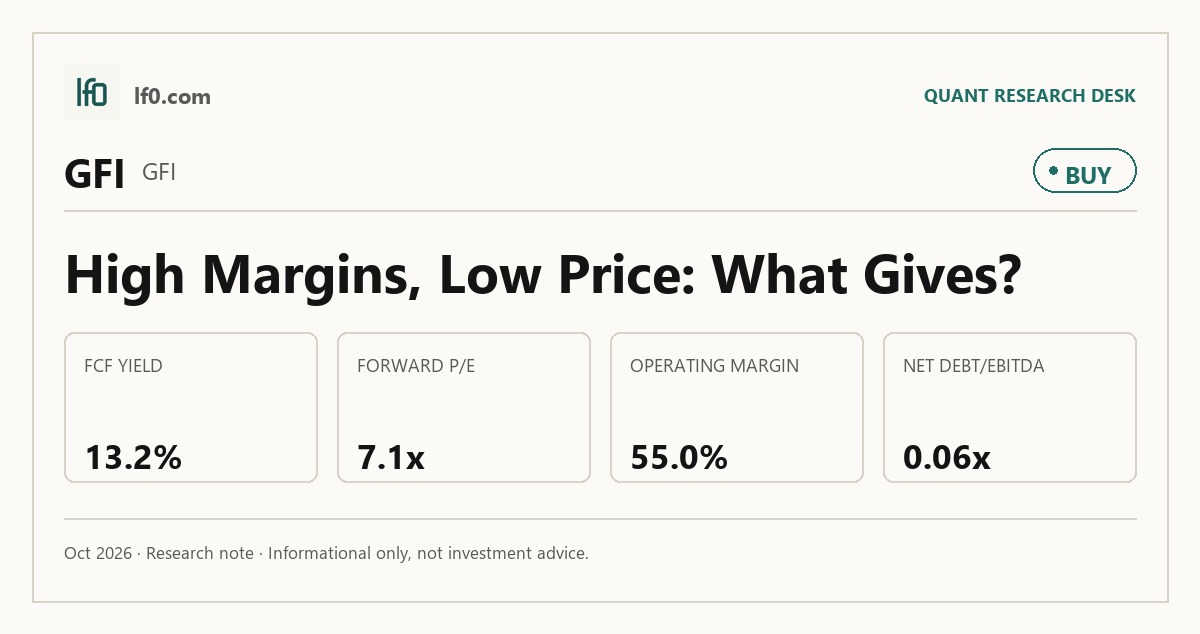
- Rated Buy because GFI combines a 13.2% FCF yield with 0.1x net debt/EBITDA.
- The core strength is 36.7% FCF margin, backed by $4.2B of levered free cash flow.
- The main risk is valuation discipline: 7.1x forward P/E and 11.6x PEG already assume strong earnings.
- On peers, GFI looks cheap on cash flow and earnings, but not on every multiple.
- I would turn more constructive if free cash flow stays above $4B and earnings growth holds.
Executive Summary
Rating: BUY | GFI
We’ll begin tracking this call’s performance since publication once sufficient adjusted-close data is available.
I would put my rating as a Buy because GFI combines a 13.2% FCF yield with 0.1x net debt/EBITDA, so the market is paying a modest multiple for a business that is already converting 36.7% of revenue into free cash flow. The 55.0% operating margin and 38.7% net margin show that this is not a low-quality cash generator, and 81.4% quarterly earnings growth tells me the current earnings base is still expanding rather than merely holding steady.
I would raise my rating more toward a Buy if free cash flow stays above $4B, meaning the current yield is being sustained rather than flattered by one strong period, and if forward EPS holds near 5.0, which would keep the 7.1x multiple anchored to a real earnings base. A move back above the 200-day moving average of $43.65 would also help, because it would show the market is starting to reprice the cash flow profile instead of treating the shares as a value trap.
Company Profile
Gold Fields is a gold producer with a portfolio of operating mines across multiple jurisdictions. The company earns revenue primarily from gold sales, and its economics are driven by production volumes, realized gold prices, and the cost base at each mine. For this kind of business, the key question is not just how much metal comes out of the ground, but whether the company can keep converting that production into cash at a high rate.
Economic Moat
Business Model
Gold Fields’ moat is not built on a single branded product; it comes from scale, operating discipline, and the ability to turn a large production base into high-margin cash flow. That matters because a miner with 55.0% operating margin and 62.7% EBITDA margin is extracting more value from each revenue dollar than a typical commodity producer, which suggests the asset base is not just large but also efficient. I think that is the right lens for this name: the edge is operational, not structural in the sense of a network effect, and it shows up in cash conversion.
Business & Operating Risks
The main disclosed risks are the usual ones for a gold miner: commodity-price exposure, operating disruption, and jurisdictional risk across a multi-asset portfolio. None of those, in my view, directly breaks the cost and cash-flow advantage implied by the current margins, but they can pressure it quickly if gold prices soften or a key mine underperforms. The risk profile is therefore real, but it is more a test of durability than a direct threat to the moat itself.
Management Discussion & Analysis
Management appears to be responding through cash discipline rather than aggressive balance-sheet expansion, which is the right response to the operating risks above. The current 0.1x net debt/EBITDA and 36.7% FCF margin suggest the company is prioritizing flexibility, and that is exactly what I would want to see when the business is exposed to commodity swings. In my view, the key question is whether management can keep that cash conversion intact while still funding the portfolio.
Recent Events
The most recent evidence in this package is the earnings and cash-flow profile itself, and it points to a business that is still producing enough cash to support capital returns and optionality. The fact that operating cash flow is $5.9B and levered free cash flow is $4.2B tells me recent operating performance has reinforced, rather than weakened, the moat case. That is important because a miner’s edge is only as good as its ability to keep turning production into cash across the cycle.
Financial Analysis
Growth
The growth picture is strongest where it matters most for this business: earnings and cash generation. Quarterly earnings growth is 81.4% year over year, and revenue per share is $6.36, which tells me the company is extracting more profit from its asset base rather than relying on volume alone. I would not overread the lack of standalone revenue figures here; for a miner, the more important point is that earnings are growing faster than the top line, which usually means margins and realized pricing are working in the company’s favor.
Profitability
GFI — Profitability (TTM)
| Metric | TTM |
|---|---|
| Operating Margin (TTM) | 55.0% |
| Net Margin (TTM) | 38.7% |
| Return on Assets (TTM) | 28.5% |
| Return on Equity (TTM) | 58.7% |
| Gross Margin (TTM) | 57.8% |
| EBITDA Margin (TTM) | 62.7% |
Source: Yahoo Finance — Trailing Twelve Months (TTM)
TTM operating margin of 55.0%, gross margin of 57.8%, EBITDA margin of 62.7%, and net margin of 38.7% show a business with unusually strong conversion for the sector. ROA of 28.5% and ROE of 58.7% confirm that the asset base is being used efficiently, and the gap between ROA and ROE tells me leverage is helping returns without looking excessive. This is the part of the thesis that matters most: the company is not just profitable, it is highly profitable on both an operating and equity basis.
Valuation
GFI — Valuation Multiples
| Metric | Value |
|---|---|
| Current Share Price (USD) | 35.6 |
| Market Cap (USD Mil) | 31,734 |
| Enterprise Value (USD Mil) | 64,154 |
| Trailing P/E | 7.3 |
| Forward P/E | 7.1 |
| Price/Sales (TTM) | 2.8 |
| Price/Book (mrq) | 7.1 |
| EV/Revenue | 5.6 |
| EV/EBITDA | 9 |
| Beta (5Y Monthly) | 0.65 |
| FCF Yield % (TTM) | 13.2% |
| Forward EPS (USD) | 5 |
| Analyst Target Price – Low (USD) | 40.5 |
| Analyst Target Price – Mean (USD) | 48.7 |
| Analyst Target Price – High (USD) | 57 |
| # Analyst Opinions | 7 |
Source: Yahoo Finance
At 7.3x trailing P/E, 7.1x forward P/E, 2.8x price/sales, and 9.0x EV/EBITDA, GFI is not expensive for a business with this margin profile. The 13.2% FCF yield is the cleanest support for the stock, because it says the equity is backed by real cash generation rather than accounting earnings alone. On my read, fair value sits around $40–$50 per share, which is inside the analyst range of $40.5–$57 and below the $48.7 mean; I weight cash conversion and balance-sheet strength more heavily than the consensus appears to. Forward EPS of 5.0 is also useful context: it is well above AG’s 1.0 and CDE’s 2.0, but below AEM’s 12.4 and NEM’s 10.2, so GFI looks cheaper than the highest-quality peers on earnings power, not just on headline multiples. That is why I think the stock deserves a premium to weaker names, but not a full rerating to the top of the group.
Leverage
GFI — Leverage & Coverage (Quarterly)
| Metric | Value |
|---|---|
| Total Debt/Equity % (mrq) | 28.6 |
| Current Ratio (mrq) | 1.9 |
| Total Debt (mrq, USD Mil) | 2,634.5 |
| Operating Cash Flow (TTM, USD Mil) | 5,854 |
| Levered Free Cash Flow (TTM, USD Mil) | 4,175.9 |
| Net Debt/EBITDA (TTM) | 0.1 |
| FCF Margin % (TTM) | 36.7% |
Source: Yahoo Finance — Quarterly Financial Statements
The balance sheet is a support, not a constraint. Total debt is $2.6B, current ratio is 1.9x, and net debt/EBITDA is 0.1x, so the company has enough liquidity to absorb normal volatility without forcing a capital raise. Operating cash flow of $5.9B and levered free cash flow of $4.2B also tell me the debt load is manageable because the business is generating cash faster than it is consuming it. I would become more cautious if net debt/EBITDA moved materially above 0.5x, because that would mean the current flexibility is starting to erode.
Insider Activity
The insider record here is limited, but the one open-market purchase by Director Jacqueline Elizabeth McGill on 2026-06-02 is directionally constructive. I would not call that a broad insider-buying signal, because it is only one transaction, but it does align with the idea that management and directors are not signaling stress. In a name like this, that matters more as a confidence check than as a standalone catalyst.
Comparable Analysis
LF0 has published standalone analyses of these peers: Coeur Mining (CDE) (rated Hold); Newmont Corporation (NEM) (rated Hold); Pan American Silver (PAAS) (rated Hold).
Growth
| Company | Revenue TTM (USD Mil) | Revenue Growth YoY % | EBITDA TTM (USD Mil) | Diluted EPS TTM |
|---|---|---|---|---|
| GFI | 11,370.5 | 78.9% | 7,129.7 | 4.9 |
| CDE | 3,171.2 | 125.9% | 1,629.4 | 1.2 |
| AEM | 14,525.9 | 35.0% | 10,149.3 | 11.9 |
| NEM | 25,767 | 15.1% | 17,058 | 8 |
| PAAS | 4,312 | 38.4% | 2,124 | 3.4 |
| AG | 1,641.2 | 57.3% | 942.2 | 0.7 |
Source: Yahoo Finance
GFI’s revenue growth of 78.9% TTM sits below CDE’s 125.9% but above AEM’s 35.0%, NEM’s 15.1%, PAAS’s 38.4%, and AG’s 57.3%. EBITDA of $7.1B is also larger than CDE’s $1.6B, PAAS’s $2.1B, and AG’s $0.9B, which tells me GFI is not just growing quickly but doing so from a meaningful earnings base. That combination matters because the market usually rewards growth more when it comes with scale, not just a one-off spike.
Valuation
| Company | Current Share Price (USD) | Trailing P/E | Forward P/E | EV/Revenue | EV/EBITDA | Price/Sales (TTM) | Price/Book (mrq) | Market Cap (USD Mil) | Enterprise Value (USD Mil) | Beta (5Y Monthly) | FCF Yield % (TTM) | Forward EPS | Analyst Target Price – Low | Analyst Target Price – Mean | Analyst Target Price – High | # Analyst Opinions |
|---|---|---|---|---|---|---|---|---|---|---|---|---|---|---|---|---|
| GFI | 35.6 | 7.3 | 7.1 | 5.6 | 9 | 2.8 | 7.1 | 31,734 | 64,154 | 0.65 | 13.2% | 5 | 40.5 | 48.7 | 57 | 7 |
| CDE | 17.7 | 14.7 | 8.9 | 5.6 | 10.9 | 5.7 | 1.7 | 18,153 | 17,814 | 1.39 | 4.4% | 2 | 18 | 24 | 35 | 11 |
| AEM | 183.7 | 15.5 | 14.8 | 6.2 | 8.9 | 6.4 | 3.3 | 93,014 | 89,857 | 0.67 | 4.6% | 12.4 | 87 | 216 | 300 | 14 |
| NEM | 115.6 | 14.4 | 11.3 | 4.6 | 6.9 | 4.7 | 3.5 | 121,765 | 118,525 | 0.54 | 7.2% | 10.2 | 67 | 137.7 | 170 | 21 |
| PAAS | 45.5 | 13.3 | 9.9 | 4.2 | 8.5 | 4.4 | 2.6 | 18,869 | 18,119 | 1.59 | 7.0% | 4.6 | 53 | 64.8 | 94 | 8 |
| AG | 17.7 | 25.2 | 17.9 | 5 | 8.7 | 5.3 | 2.9 | 8,710 | 8,202 | 2.19 | 8.9% | 1 | 22.5 | 24.8 | 27 | 2 |
Source: Yahoo Finance
GFI trades at 5.6x EV/revenue and 9.0x EV/EBITDA, which is richer than NEM on EV/EBITDA but cheaper than AEM on EV/revenue and well below the market’s highest-multiple names. On a $1 invested basis, GFI’s -11.3% one-year total return trails AEM’s 10.2%, NEM’s 35.0%, PAAS’s 17.2%, and AG’s 46.8%, so the stock has not yet been rewarded for its cash generation. I think that gap is partly explained by the fact that GFI’s leverage is low but not the lowest in the group, so the market is paying for cash flow but still reserving a discount for cyclicality.
Profitability
| Company | Operating Margin (TTM) | Net Margin (TTM) | Return on Assets (TTM) | Return on Equity (TTM) | Gross Margin (TTM) | EBITDA Margin (TTM) |
|---|---|---|---|---|---|---|
| GFI | 55.0% | 38.7% | 28.5% | 58.7% | 57.8% | 62.7% |
| CDE | 19.4% | 26.8% | 7.1% | 12.8% | 56.3% | 51.4% |
| AEM | 58.1% | 40.4% | 15.7% | 23.0% | 74.5% | 69.9% |
| NEM | 51.6% | 33.4% | 15.8% | 25.9% | 68.0% | 66.2% |
| PAAS | 37.8% | 32.0% | 11.8% | 22.4% | 55.9% | 49.3% |
| AG | 47.8% | 21.2% | 10.2% | 13.4% | 63.3% | 57.4% |
Source: Yahoo Finance
GFI’s 55.0% operating margin and 62.7% EBITDA margin are strong, though AEM at 58.1% and 69.9% and NEM at 51.6% and 66.2% still set the bar. Against CDE, PAAS, and AG, GFI looks clearly better on operating efficiency, and its 58.7% ROE is also the highest in the group. That is the key point for me: GFI is not the absolute margin leader, but it is close enough to the top tier that the valuation discount looks more like caution than a verdict on quality.
Leverage
| Company | Total Debt/Equity % (mrq) | Current Ratio (mrq) | Total Debt (mrq, USD Mil) | Operating Cash Flow TTM (USD Mil) | Free Cash Flow TTM (USD Mil) | Net Debt/EBITDA (TTM) | FCF Margin % (TTM) |
|---|---|---|---|---|---|---|---|
| GFI | 28.6 | 1.9 | 2,634.5 | 5,854 | 4,175.9 | 0.1 | 36.7% |
| CDE | 6.9 | 3.7 | 713.2 | 1,466.4 | 796.7 | -0.2 | 25.1% |
| AEM | 1.1 | 2.9 | 320.4 | 7,417.4 | 4,282.3 | -0.3 | 29.5% |
| NEM | 15.8 | 2.5 | 5,598 | 12,628 | 8,815.9 | -0.2 | 34.2% |
| PAAS | 11.4 | 2.9 | 841 | 1,687 | 1,318 | -0.4 | 30.6% |
| AG | 9.8 | 2.6 | 331.1 | 825.8 | 775.1 | -1 | 47.2% |
Source: Yahoo Finance
GFI’s 28.6% debt/equity is higher than AEM’s 1.1%, NEM’s 15.8%, PAAS’s 11.4%, and AG’s 9.8%, but its 0.1x net debt/EBITDA is still very light. CDE’s negative 0.2x net debt/EBITDA reflects net cash, so GFI is not the least levered name in the peer set, but it is still comfortably conservative. The important connection is that GFI’s 36.7% FCF margin is above most peers, which helps explain why the market can tolerate a bit more debt here without demanding a lower multiple.
Conclusion
I would put my rating as a Buy because the key tension in this name is not whether GFI can generate cash — it already does — but whether that cash conversion can stay this strong while the market continues to discount the shares. With 13.2% FCF yield, 0.1x net debt/EBITDA, and 36.7% FCF margin, I think the current numbers still support the thesis, and the 55.0% operating margin tells me the business quality is real rather than purely cyclical.
The bull case is straightforward: if free cash flow stays above $4B and forward EPS remains near 5.0, then the current 7.1x forward P/E should look too low for a business with this level of profitability. If the shares also move back above $43.65, the 200-day moving average, that would tell me the market is starting to recognize the cash profile rather than treating the stock as a temporary value name. In that scenario, I would expect the stock to close some of the gap toward the analyst mean target of $48.7.
The bear case is just as clear. If FCF margin slips back toward 25%, the current cash yield would be less reliable, and if net debt/EBITDA rises materially above 0.5x, the balance-sheet advantage would no longer be as clean. I would also turn more cautious if quarterly earnings growth falls sharply from 81.4% year over year into the low double digits, because then the market would be paying a low multiple for a much less dynamic earnings base.
Weighing both sides, I still lean constructive because the downside requires two things to go wrong at once: weaker cash conversion and a clear slowdown in earnings. The stock has already spent a year below its 52-week high of $61.64, so in my view the market is still underestimating how much cash GFI is producing today.
What to Watch Next
- Free cash flow above $4B — would support keeping the Buy case intact.
- FCF margin near 36.7% — would confirm cash conversion is still strong.
- Net debt/EBITDA below 0.5x — would preserve the balance-sheet cushion.
- Forward EPS near 5.0 — would keep the current multiple anchored to real earnings.
- Share price above $43.65 — would suggest the market is starting to re-rate the stock.
What’s your take? I rated Gold Fields (GFI) BUY above — but the goal here is to get this right, not just to publish an opinion. What would you add to this analysis, or which risk or catalyst do you think I’m under- or over-weighting? Tell me in the comments.
Sources
Data sourced from Yahoo Finance and SEC EDGAR. Not investment advice.
Leave a Comment