
| Company | Aug 25 | Sep 25 | Oct 25 | Nov 25 | Dec 25 | Jan 26 | Feb 26 | Mar 26 | Apr 26 | May 26 | Jun 26 | Jul 26 | 12-Mo |
|---|---|---|---|---|---|---|---|---|---|---|---|---|---|
| MAT | +8% | -8% | +9% | +15% | -6% | +5% | -19% | -14% | +4% | -1% | -7% | +9% | -11% |
| HAS | +9% | -7% | +1% | +9% | -1% | +9% | +12% | -6% | +2% | -10% | -3% | +14% | +29% |
| FUN | -24% | +0% | +1% | -34% | +1% | +17% | -5% | +4% | +6% | +12% | +1% | -19% | -42% |
| DIS | -1% | -3% | -2% | -7% | +10% | -1% | -6% | -9% | +8% | -2% | -5% | -0% | -18% |
| TOYOF | +10% | -2% | +6% | +2% | +4% | +6% | +6% | -10% | -10% | -1% | -11% | +11% | +7% |
| ANF | -3% | -9% | -15% | +35% | +29% | -22% | +0% | -7% | -7% | -10% | +17% | +11% | +4% |
Source: Yahoo Finance monthly adjusted close.
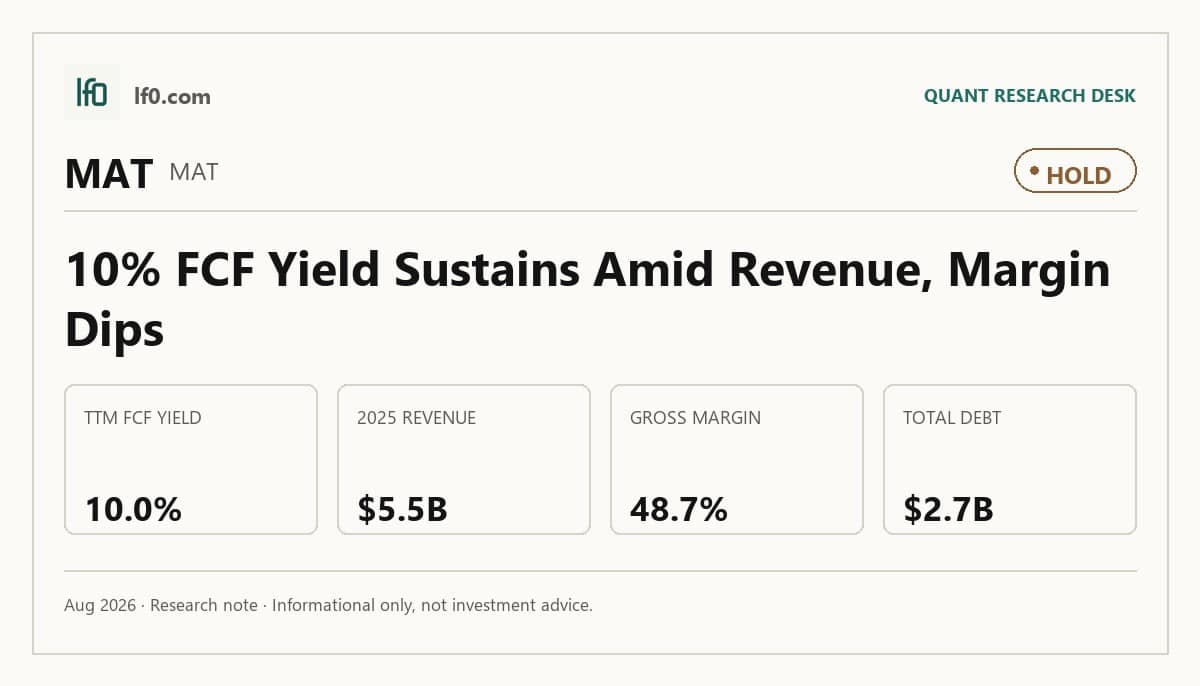
Quick Thesis
- Rated Hold — cash generation is solid, but retailer concentration and leverage cap upside.
- Strongest strength: $425.3M of levered free cash flow TTM.
- Biggest risk: $2.7B of debt and 3.4x net debt/EBITDA TTM.
- Valuation looks fair at 10.0x EV/EBITDA and a 10.0% FCF yield.
- I would turn more constructive if gross margin moves back above 50.0%.
Executive Summary
Rating: HOLD | MAT
Measured from adjusted close on 2026-08-12 to 2026-09-25. Sell ratings are correct when the stock falls; Hold is tracked as a +/-10% range. Daily-close data, not intraday. Calls are tracked for 182 days from publication, then frozen as a final record.
I would put my rating as a Hold because Mattel’s 10.0% free cash flow yield and 11.0x trailing P/E already reflect a business that is cash generative, but not yet clean enough in operating execution to justify a Buy. The latest numbers still show a company that depends heavily on holiday demand and a concentrated retail base, so the market is paying for resilience that has not fully shown up in the margin line.
The key strength is cash conversion: $425.3M of levered free cash flow TTM and $666.4M of operating cash flow TTM show the brand portfolio still turns into real money. The key risk is leverage, with $2.7B of total debt and 3.4x net debt/EBITDA TTM, which leaves less room for a demand miss or another round of tariff pressure.
I would raise my rating more towards a Buy if gross margin moves back above 50.0%, meaning pricing and mix are offsetting tariffs and discounts, and if operating margin follows through with a clear step-up rather than a one-quarter bounce.
Company Profile
Mattel, Inc. designs, manufactures, markets, and sells toys, games, and related products, while also extending its intellectual property into film, television, digital play, licensing, and location-based entertainment. Its core brands include Barbie, Hot Wheels, Fisher-Price, and UNO, and the company sells through retailers, wholesalers, and consumers in more than 30 countries.
The business is organized around two reportable segments, North America and International. Mattel also manufactures through owned and third-party plants in China, Vietnam, India, Malaysia, Mexico, and Thailand, which gives it scale but also exposes it to trade and supply-chain friction.
Economic Moat
Business Model
Mattel’s moat is built first on brand equity. Barbie, Hot Wheels, Fisher-Price, and UNO sit inside multi-generational demand pools, and I feel that is hard to replicate quickly because a new entrant would need consumer trust, retail shelf access, and content relevance at the same time. The company has also widened the moat by pushing those franchises across toys, film, television, short-form content, mobile games, publishing, and location-based entertainment, so the value of each brand is no longer tied to a single product cycle.
That matters for the moat because the same IP can be monetized in several formats, which makes the franchise more durable than a one-channel toy line. The license base with Disney Consumer Products, NBCUniversal, Warner Bros., Microsoft, WWE, Formula 1, Nintendo, and Paramount adds reach, although royalties also limit how much value Mattel keeps for itself.
Business & Operating Risks
The biggest disclosed risk is customer concentration: Walmart, Target, and Amazon accounted for about 42.0% of worldwide consolidated net sales in 2025, and the ten largest customers together represented 49.0% of sales. Because those customers buy on one-time purchase orders rather than binding volume commitments, a shelf-space reset or a change in promotional support can hit revenue quickly. Seasonal ordering is the second pressure point, since Mattel depends on a relatively brief holiday period and retailers have shifted more orders later in the year.
Tariffs and supply-chain disruption add a third layer of risk. The filing points to new tariffs on imports from all countries and the cost of shifting production away from China, which can raise costs and push customers toward domestic or non-U.S. sources. In my view, these risks do not break the moat itself, but they do threaten the managed-margin advantage that the brand portfolio is supposed to provide.
Management Discussion & Analysis
Management is responding, but not yet proving that the response fully offsets the risks above. The company raised its annual gross savings target under the OPG program to $225 million, bought time on the debt maturity wall by issuing $600 million of senior notes due 2030, and approved a new $1.5 billion share repurchase program in February 2026.
The issue is that execution still has to catch up with the strategy. 2025 net sales fell $1.0% to $5.5B, operating income dropped 21.0% to $546.4M, and gross margin slipped 210 basis points to 48.7%, so the savings program is helping but not yet overpowering tariffs, discounts, and mix pressure. I read that as active management, not a finished turnaround.
Recent Events
The February 2026 share repurchase authorization is the clearest capital-allocation signal in the recent 8-Ks. It tells me management sees enough cash generation to return capital, but it also means the board is willing to buy stock before the operating margin has fully repaired.
Leadership changes have been orderly rather than disruptive. Steve Totzke stepped down as President and Chief Commercial Officer in April 2026, and Sanjay Luthra took over in May while Totzke stayed on in an advisory role through year-end. That looks like continuity, not a reset.
The May 2026 approval of the 2026 Restatement of the 2010 Equity and Long-Term Compensation Plan added 2.2 million shares and extended the plan to 2036. I see that as supportive of retention, but it also adds a modest dilution overhang.
Financial Analysis
Growth
MAT — Financial Growth (Quarterly, USD Mil)
| Metric | 2025-06-30 | 2025-09-30 | 2025-12-31 | 2026-03-31 | 2026-06-30 |
|---|---|---|---|---|---|
| REVENUE (USD Mil) | 1,018.6 | 1,736 | 1,766.5 | 862.2 | 1,125.3 |
| EBIT (USD Mil) | 92.3 | 387.9 | 148 | 56.1 | 13.8 |
| EBITDA (USD Mil) | 152.6 | 438.8 | 194.7 | 104.1 | 65.7 |
| NET INCOME (USD Mil) | 53.4 | 278.4 | 106.2 | 61 | -18.2 |
| DILUTED EPS | 0.2 | 0.9 | 0.3 | 0.2 | -0.1 |
Source: Yahoo Finance — Quarterly Financial Statements
Revenue was $1.1B in Q2 2026, down from $1.8B in Q4 2025 and $1.7B in Q3 2025, which is the kind of post-holiday reset I would expect in this business rather than a clean growth trend. The more important point is that EBITDA fell to $65.7M in Q2 2026 from $104M in Q1 2026, so earnings power weakened faster than sales and the latest quarter did not show operating leverage.
That pattern fits the seasonality management has already disclosed. It also means the growth line alone is not enough to support a higher rating; I need to see the holiday build translate into better margin capture, not just a bigger fourth quarter.
Profitability
MAT — Profitability (TTM)
| Metric | TTM |
|---|---|
| Operating Margin (TTM) | 1.3% |
| Net Margin (TTM) | 7.8% |
| Return on Assets (TTM) | 4.7% |
| Return on Equity (TTM) | 20.5% |
| Gross Margin (TTM) | 47.6% |
| EBITDA Margin (TTM) | 11.9% |
Source: Yahoo Finance — Trailing Twelve Months (TTM)
TTM gross margin of 47.6% shows Mattel still keeps nearly half of revenue after product costs, so the core toy economics are intact. The problem sits below that line: EBITDA margin of 11.9% and operating margin of 1.3% leave only a thin layer of profit after marketing, logistics, and overhead, which tells me the business is still absorbing too much cost before it reaches operating income.
Net margin of 7.8% is helped by items below operating profit, so I weight operating margin more heavily here. Return on assets of 4.7% and return on equity of 20.5% show decent capital efficiency, but the wide gap between them tells me leverage is doing part of the work. I would watch for operating margin moving clearly above 5.0%, because that would show the company is converting gross profit into durable operating earnings rather than leaning on financial leverage.
Valuation
MAT — Valuation Multiples
| Metric | Value |
|---|---|
| Market Cap (USD Mil) | 4,246 |
| Enterprise Value (USD Mil) | 6,517 |
| Trailing P/E | 10.8 |
| Forward P/E | 9.3 |
| Price/Sales (TTM) | 0.8 |
| Price/Book (mrq) | 2.1 |
| EV/Revenue | 1.2 |
| EV/EBITDA | 10 |
| Beta (5Y Monthly) | 0.73 |
| FCF Yield % (TTM) | 10.0% |
| Forward EPS (USD) | 1.6 |
| Analyst Target Price – Low (USD) | 12 |
| Analyst Target Price – Mean (USD) | 18.2 |
| Analyst Target Price – High (USD) | 28 |
| # Analyst Opinions | 12 |
Source: Yahoo Finance
Mattel trades at 1.2x EV/Revenue, 10.0x EV/EBITDA, 11.0x trailing P/E, and 9.3x forward P/E, with a 10.0% FCF yield. I think EV/EBITDA is the cleaner anchor because the company is profitable and cash generative, while the FCF yield says the stock is not priced for aggressive growth.
On the analysis here, I would put fair value in a range of roughly $12–$28 per share, which lines up with the analyst target range of $12 to $28 and a $18.2 mean across 12 opinions. That tells me the market consensus is already close to my own read, so I do not see a large valuation gap to close. The stock looks fair rather than cheap, especially because the 3.4x net debt/EBITDA profile limits how much of the cash yield can be treated as excess equity value.
Leverage
MAT — Leverage & Coverage (Quarterly)
| Metric | Value |
|---|---|
| Total Debt/Equity % (mrq) | 137.4 |
| Current Ratio (mrq) | 1.9 |
| Net Debt/EBITDA (TTM) | 3.4 |
| FCF Margin % (TTM) | 7.8% |
Source: Yahoo Finance — Quarterly Financial Statements
Mattel’s leverage is manageable but not a strength. Total debt was $2.7B mrq, total debt/equity was 137.4%, and the current ratio was 1.9, which gives some near-term liquidity cushion but not a large one. Operating cash flow was $666.4M TTM and levered free cash flow was $425.3M TTM, so cash generation is solid and still leaves room after debt service and capital spending.
Net debt/EBITDA was 3.4x TTM, which is elevated enough to keep refinancing and rate sensitivity on the radar. That said, the balance sheet is serviceable rather than stressed, and the 7.8% FCF margin shows EBITDA is converting into real cash. In my view, the leverage profile supports the current equity case, but it does not leave much room for a sales miss.
Insider Activity
The insider record here is limited but directionally supportive. I see one open-market purchase and no open-market sales across 87 Form 4 filings from 2025-02-03 to 2026-05-29, with the only open-market trade being a large buy by Chief Financial Officer Ruh Paul.
That does not change the thesis on its own, but it does suggest management is not signaling distress through insider selling. I would treat it as a modest positive, not a decisive signal.
Comparable Analysis
Growth
| Company | Revenue TTM (USD Mil) | Revenue Growth YoY % | EBITDA TTM (USD Mil) | Diluted EPS TTM |
|---|---|---|---|---|
| MAT | 5,489.9 | 10.5% | 653.4 | 1.4 |
| HAS | 4,973.2 | 16.2% | 1,300.2 | 5.6 |
| FUN | 3,058.4 | -7.0% | 793.8 | -17.4 |
| DIS | 98,861 | 6.8% | 20,963 | 4.8 |
| TOYOF | 51,957,024.7 | 10.4% | 5,600,540.9 | 2.2 |
| ANF | 5,282.8 | 1.5% | 825.9 | 10.3 |
Source: Yahoo Finance
Mattel’s revenue growth of 10.5% TTM sits ahead of DIS at 6.8% and ANF at 1.5%, and just above TOYOF at 10.4%, but behind HAS at 16.2%. That puts MAT in the middle of the pack, so I do not think the market should pay a premium growth multiple for it; the growth rate is good enough to support the current valuation, but not strong enough to justify HAS-style pricing.
Valuation
| Company | Trailing P/E | Forward P/E | EV/Revenue | EV/EBITDA | Price/Sales (TTM) | Price/Book (mrq) | Beta (5Y Monthly) | FCF Yield % (TTM) | Forward EPS | Analyst Target Price – Low | Analyst Target Price – Mean | Analyst Target Price – High | # Analyst Opinions |
|---|---|---|---|---|---|---|---|---|---|---|---|---|---|
| MAT | 10.8 | 9.3 | 1.2 | 10 | 0.8 | 2.1 | 0.73 | 10.0% | 1.6 | 12 | 18.2 | 28 | 12 |
| HAS | 17.1 | 14.7 | 3.3 | 12.5 | 2.7 | 19.2 | 0.47 | 5.1% | 6.5 | 85 | 109.3 | 120 | 14 |
| FUN | — | 216.6 | 2.3 | 8.7 | 0.5 | 14.2 | 0.39 | 29.6% | 0.1 | 10 | 21.4 | 30 | 13 |
| DIS | 21.2 | 13.8 | 2.3 | 10.8 | 1.8 | 1.6 | 1.40 | 2.7% | 7.4 | 88 | 127.7 | 160 | 31 |
| TOYOF | 8.5 | 9 | 0.6 | 5.7 | 0 | 1 | 0.34 | -1,612.0% | 2.1 | — | — | — | — |
| ANF | 11.1 | 9.7 | 1.1 | 7.2 | 1 | 3.8 | 0.92 | 5.6% | 11.8 | 87 | 112.4 | 136 | 11 |
Source: Yahoo Finance
MAT trades at 1.2x EV/Revenue and 10.0x EV/EBITDA, versus HAS at 3.3x and 12.5x, DIS at 2.3x and 10.8x, ANF at 1.1x and 7.2x, and FUN at 2.3x and 8.7x. The 10.0% FCF yield is the cleanest anchor because it is richer than HAS, DIS, and ANF, while FUN’s yield is distorted by a weak earnings base.
Using peer EV/Revenue of 1.1x to 3.3x on MAT’s $5.5B TTM revenue gives an illustrative EV range of about 6.1B to 17.9B, which is wide enough to show the market is not paying up for the stock. I think that range is consistent with a fair-value view rather than a clear discount, especially once MAT’s leverage is folded in.
Profitability
| Company | Operating Margin (TTM) | Net Margin (TTM) | Return on Assets (TTM) | Return on Equity (TTM) | Gross Margin (TTM) | EBITDA Margin (TTM) |
|---|---|---|---|---|---|---|
| MAT | 1.3% | 7.8% | 4.7% | 20.5% | 47.6% | 11.9% |
| HAS | 22.2% | 16.0% | 13.1% | 159.6% | 63.8% | 26.1% |
| FUN | 13.0% | -57.3% | 2.4% | -143.2% | 38.2% | 26.0% |
| DIS | 19.3% | 8.7% | 4.8% | 8.0% | 37.6% | 21.2% |
| TOYOF | 7.9% | 8.6% | 2.3% | 12.4% | 16.8% | 10.8% |
| ANF | 8.0% | 9.3% | 12.7% | 39.2% | 61.7% | 15.6% |
Source: Yahoo Finance
MAT’s 47.6% gross margin is below HAS at 63.8% and ANF at 61.7%, but above DIS at 37.6% and FUN at 38.2%. Its 11.9% EBITDA margin trails HAS at 26.1% and FUN at 26.0%, yet it is ahead of DIS at 21.2% and close to ANF at 15.6%.
The gap between MAT’s gross margin and EBITDA margin is the key read. It tells me the issue is not product economics alone; it is the cost structure below gross profit, which is why the market is not awarding a premium multiple despite decent brand strength.
Leverage
| Company | Total Debt/Equity % (mrq) | Current Ratio (mrq) | Operating Cash Flow TTM (USD Mil) | Free Cash Flow TTM (USD Mil) | Net Debt/EBITDA (TTM) | FCF Margin % (TTM) |
|---|---|---|---|---|---|---|
| MAT | 137.4 | 1.9 | 666.4 | 425.3 | 3.4 | 7.8% |
| HAS | 531 | 1.7 | 1,288.2 | 688.1 | 1.9 | 13.8% |
| FUN | 1,455.3 | 0.4 | 471.2 | 483.4 | 6.3 | 15.8% |
| DIS | 39.4 | 0.7 | 16,989 | 4,860.4 | 1.9 | 4.9% |
| TOYOF | 115 | 1.2 | 4,132,990.1 | -3,599,962.5 | 5.5 | -6.9% |
| ANF | 95.5 | 1.4 | 667.4 | 283.4 | 0.8 | 5.4% |
Source: Yahoo Finance
MAT’s 137.4% debt/equity and 3.4x net debt/EBITDA are materially higher than ANF’s 95.5% and 0.8x, while HAS sits at 531.0% debt/equity but only 1.9x net debt/EBITDA. MAT’s 7.8% FCF margin is above DIS at 4.9% and below HAS at 13.8%, which puts it in the middle on cash conversion.
I think the net debt metric is the more useful read here because MAT’s $523.9M cash balance offsets part of the $2.7B debt load. That makes the balance sheet serviceable, but not a source of competitive advantage.
Conclusion
The tension in this name is simple: Mattel still throws off real cash, but the operating margin has not yet moved far enough to prove that the brand portfolio can absorb tariffs, discounts, and retailer concentration without leaning on buybacks. I would put my rating as a Hold because the 10.0% FCF yield already gives the stock credit for cash generation, while the 1.3% operating margin says the business is not yet converting that strength into enough durable earnings power.
I would raise my rating more towards a Buy if operating margin moves above 5.0% for two consecutive quarters, because that would show the company is turning gross profit into durable operating earnings rather than relying on holiday sell-in and cost cuts. I would also become more constructive if free cash flow stays above $400M over the next twelve months, roughly the current run rate, because that would support buybacks and debt reduction without stretching the balance sheet. If that happens while net debt/EBITDA trends closer to 3.0x, the equity rerating case becomes much cleaner.
The bear case is the mirror image. If the next two holiday cycles fail to lift operating margin above 3.0%, I would move from Hold toward Sell because the current cash yield would start to look like a mask over weak underlying conversion. A 5.0% decline in sales to the three largest customers would remove about $0.1B of annual revenue before margin pressure, and on a business with only 1.3% operating margin that would hit earnings disproportionately hard. If that coincides with another year of tariff or discount pressure, the current valuation would look less like fair value and more like a trap.
Weighing both sides, I still lean to Hold. The cash generation is real and the balance sheet is serviceable, but the operating margin has not yet proven to me that it can clear the level needed for a higher rating. I would want to see one more clean holiday season before paying up for the thesis.
What to Watch Next
- Operating margin above 5.0% for two quarters — would support a move toward Buy.
- Free cash flow above $400M over the next twelve months — would support buybacks and debt reduction.
- Net debt/EBITDA trending toward 3.0x — would improve balance-sheet flexibility.
- Operating margin staying below 3.0% through two holiday cycles — would push the rating toward Sell.
- Sales to the three largest customers falling 5.0% — would pressure earnings disproportionately.
What’s your take? I rated Mattel (MAT) HOLD above — but the goal here is to get this right, not just to publish an opinion. What would you add to this analysis, or which risk or catalyst do you think I’m under- or over-weighting? Tell me in the comments.
Sources
- SEC 10-K Annual Report — filed 2026-02-23
- SEC 8-K Filing (2026-06-02)
- SEC 8-K Filing (2026-04-29)
- SEC 8-K Filing (2026-04-07)
- SEC 8-K Filing (2026-02-10)
- SEC Form 4 Insider Transaction (2026-06-02)
- SEC Form 4 Insider Transaction (2026-06-02)
- SEC Form 4 Insider Transaction (2026-06-01)
- SEC 10-K Annual Report — FY2026
- SEC 10-K Annual Report — FY2025
- SEC 10-K Annual Report — FY2024
- SEC 10-K Annual Report — FY2023
- SEC 10-K Annual Report — FY2022
Data sourced from Yahoo Finance and SEC EDGAR. Not investment advice.
Leave a Comment