
| Company | Oct 25 | Nov 25 | Dec 25 | Jan 26 | Feb 26 | Mar 26 | Apr 26 | May 26 | Jun 26 | Jul 26 | Aug 26 | Sep 26 | 12-Mo |
|---|---|---|---|---|---|---|---|---|---|---|---|---|---|
| SNPS | -8% | -8% | +12% | -1% | -11% | -4% | +22% | -1% | -6% | -13% | +13% | -1% | -12% |
| CDNS | -4% | -8% | +0% | -5% | +2% | -8% | +19% | +14% | +0% | -9% | -0% | -3% | -6% |
| RMBS | -1% | -7% | -4% | +24% | -12% | -14% | +34% | +26% | -9% | -31% | -5% | +23% | +2% |
| MCHP | -3% | -13% | +19% | +19% | -1% | -13% | +44% | +2% | -4% | -19% | -1% | +6% | +24% |
| ADSK | -5% | +1% | -2% | -15% | -3% | -3% | -1% | -2% | -16% | +20% | +10% | -19% | -34% |
| TXN | -11% | +4% | +3% | +25% | -2% | -8% | +45% | +9% | -2% | -7% | -5% | +7% | +56% |
Source: Yahoo Finance monthly adjusted close.
Quick Thesis
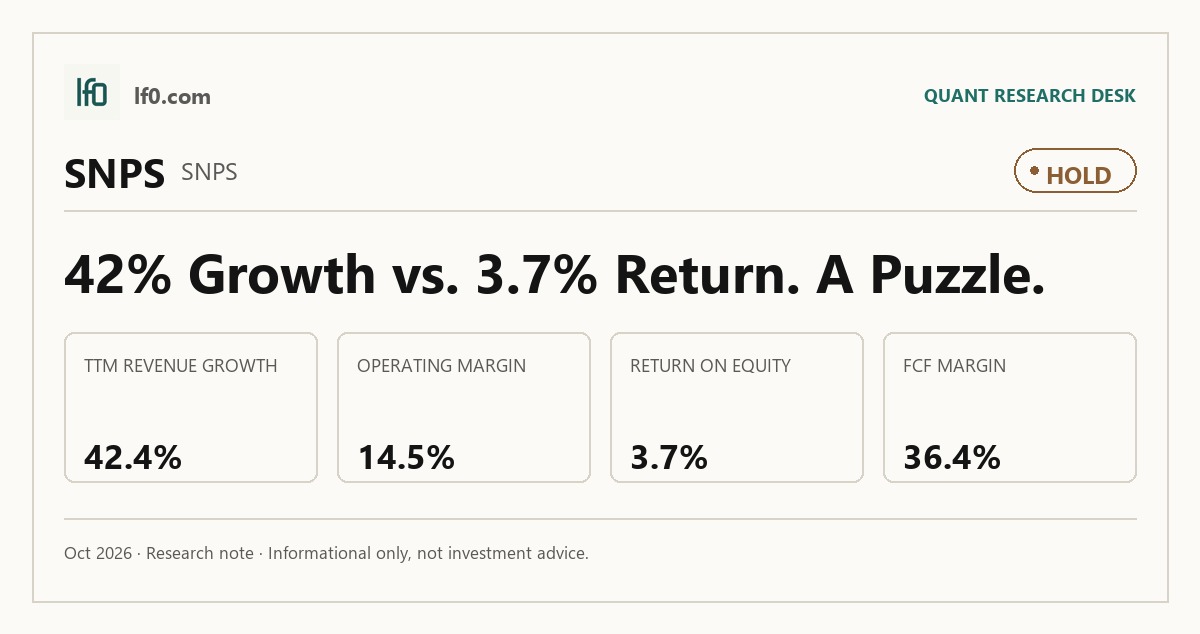
- Rated Hold — strong growth and cash generation, but the stock already prices in a lot of it.
- Best strength: 36.4% TTM FCF margin and $3.4B of levered free cash flow.
- Main risk: 3.5x net debt/EBITDA, with merger execution still unresolved.
- Valuation is rich versus peers at 43.6x EV/EBITDA and 9.6x EV/revenue.
- I would turn more constructive if the combined company lifts operating margin above 14.5%.
Executive Summary
Rating: HOLD | SNPS
We’ll begin tracking this call’s performance since publication once sufficient adjusted-close data is available.
I would put my rating as a Hold because Synopsys has excellent product economics, but the shares already discount a lot of that quality at 43.6x EV/EBITDA and 27.2x forward P/E. The business still converts only 14.5% of revenue into operating profit on a TTM basis, so the core question is not whether the model is good — it is — but whether the next leg of earnings growth can outrun the valuation and the added merger risk.
The strongest support for the thesis is cash generation. Synopsys posted a 36.4% TTM FCF margin and $3.4B of levered free cash flow, which gives it room to fund the Ansys transaction and still absorb some integration noise. The main risk is leverage: net debt/EBITDA is 3.5x, so the equity is no longer insulated if the deal slips or if operating momentum softens.
I would become more constructive if the combined company proves it can lift operating margin above 14.5%, meaning the merger is adding scale without eroding earnings quality. If that margin step-up does not show up, I think the current multiple leaves too little room for disappointment.
Company Profile
Synopsys designs electronic design automation software and semiconductor intellectual property used to create, verify, and manufacture chips and system-on-chip designs. It earns revenue mainly from software licenses, IP licenses, hardware sales or leases for emulation and prototyping systems, and consulting and support services. The company operates through two segments, Design Automation and Design IP, and is listed on Nasdaq under SNPS.
Headquartered in Sunnyvale, California, Synopsys has 116 offices worldwide and about 20,000 employees, roughly 87% of whom are engineers. Its tools are used across AI, 5G, automotive, and cloud infrastructure markets, which gives the company exposure to the most design-intensive parts of the semiconductor cycle.
Economic Moat
Business Model
The moat is built on workflow lock-in. Synopsys sits inside the chip design process from architecture through signoff, and I feel that a competitor would struggle to replicate that breadth of design, verification, manufacturing, and AI-driven workflow tools within 3 years. Its silicon-proven Design IP portfolio — including UCIe, USB, PCI Express, DDR, Ethernet, MIPI, and HDMI — adds another layer of stickiness because customers are not just buying software, they are buying integration speed and lower tape-out risk.
The patent estate, with more than 3,400 issued U.S. and foreign patents extending through 2044, helps protect the franchise, but I view the installed workflow position as the real advantage. The cloud-based EDA offering launched in fiscal 2022, including the first EDA SaaS solution developed with Microsoft Azure, deepens that lock-in by embedding Synopsys into customer engineering flows.
Business & Operating Risks
The Ansys merger is the biggest disclosed risk because it can change Synopsys’ capital structure, operating profile, and competitive position at the same time. According to the risk factors in their SEC 10-K, the deal still needs antitrust and foreign investment approvals, and failure to close could trigger a $1.5B termination fee. That is a direct cash cost, and it matters because the company is preparing to fund the cash portion with debt.
Customer concentration and industry cyclicality are the next major threats. Synopsys depends on a relatively small number of large customers, so a delay in tape-outs or a cut in R&D budgets can push revenue recognition out even when contracts are signed. Export controls and China exposure add another layer of risk, since restrictions on advanced computing and semiconductor manufacturing items could delay or block international sales.
Cybersecurity and AI execution also matter. The company stores sensitive customer and proprietary data, so a breach would hit both cost and credibility, while a miss in AI initiatives would weaken one of the main strategic narratives supporting the franchise. The disclosed risks do not threaten the moat itself, but they do threaten the pace at which that moat can be monetized, especially if the Ansys deal increases complexity before synergies arrive.
Management Discussion & Analysis
Management is clearly treating the Ansys acquisition as the central capital allocation priority. The company has a fully committed $14.9B debt package for the deal, including a $10.6B bridge commitment and a $4.3B term loan facility, while the stock repurchase program has been suspended until leverage comes down. That tells me the near-term equity story is about integration and financing, not capital return.
The company also preserved cash for the transaction rather than returning it to shareholders, and the sale of Software Integrity produced $1.4B of net cash proceeds that reduced the bridge commitment by $1.1B. That helps fund the deal, but it does not change the fact that leverage will rise materially if the merger closes. Management is still guiding to growth, yet it has also flagged a challenging near-term environment in China and slower recovery in industrial, automotive, and consumer electronics, so the tone is more cautious than the headline revenue growth suggests.
The key point is that management is responding to the risk set, but not eliminating it. The divestiture sharpens the portfolio around core design workflows, while the financing plan addresses deal funding; the unresolved issue is whether the merger can lift earnings quality fast enough to justify the added leverage.
Recent Events
The most important development is the Ansys acquisition moving into the regulatory phase. On July 10, 2024, Synopsys filed the transaction notification with China’s State Administration for Market Regulation after receiving a May 14 notice that the deal needed to be notified, which keeps the strategic logic intact but confirms that closing still depends on cross-border approvals.
The Software Integrity divestiture, completed on September 30, 2024 and disclosed on October 1, 2024, is thesis-positive because it sharpens Synopsys’ focus on core design automation and semiconductor IP. That makes the post-deal portfolio easier to underwrite, even if the transaction itself remains the main source of execution risk.
Synopsys also changed its fiscal year on November 25, 2024 to an October 31 year-end, with quarterly periods ending January 31, April 30, July 31, and October 31. That is an administrative change, but it improves reporting alignment and makes year-over-year comparisons cleaner. The December 4, 2024 8-K then confirmed fourth-quarter and full-year results, which was routine.
Financial Analysis
Growth
SNPS — Financial Growth (Quarterly, USD Mil)
| Metric | 2025-07-31 | 2025-10-31 | 2026-01-31 | 2026-04-30 | 2026-07-31 |
|---|---|---|---|---|---|
| REVENUE (USD Mil) | 1,739.7 | 2,254.9 | 2,408.8 | 2,276 | 2,476.8 |
| EBIT (USD Mil) | 335.8 | 711.3 | 241.8 | 152.6 | 817.2 |
| EBITDA (USD Mil) | 450.3 | 1,160.4 | 692.5 | 609.1 | 1,272 |
| NET INCOME (USD Mil) | 242.5 | 448.7 | 65 | 17.1 | 545.8 |
| DILUTED EPS | 1.5 | 2.4 | 0.3 | 0.1 | 2.8 |
Source: Yahoo Finance — Quarterly Financial Statements
Synopsys revenue rose from $1.7B in 2025-07-31 to $2.5B in 2026-07-31, and the latest quarter’s $2.5B was the strongest in the series. EBIT and EBITDA were more volatile, but the rebound to $817.2M of EBIT and $1.3B of EBITDA in 2026-07-31 shows the business can still convert top-line growth into operating leverage when timing normalizes.
The quarter-to-quarter noise matters less than the direction of travel. Revenue growth is still healthy, and the stronger EBITDA print tells me the model is not just growing — it is scaling, which is consistent with the workflow lock-in described above. The main watch item is whether the next few quarters hold that margin recovery instead of giving it back to integration costs or customer timing.
Profitability
SNPS — Profitability (TTM)
| Metric | TTM |
|---|---|
| Operating Margin (TTM) | 14.5% |
| Net Margin (TTM) | 11.4% |
| Return on Assets (TTM) | 1.4% |
| Return on Equity (TTM) | 3.7% |
| Gross Margin (TTM) | 82.9% |
| EBITDA Margin (TTM) | 22.0% |
Source: Yahoo Finance — Trailing Twelve Months (TTM)
Synopsys has a TTM gross margin of 82.9%, an EBITDA margin of 22.0%, an operating margin of 14.5%, and a net margin of 11.4%. That spread tells me the core product economics are excellent, but operating expense intensity still absorbs a large share of gross profit before it reaches the bottom line.
Returns are modest relative to the quality of the gross margin base. ROA is 1.4% and ROE is 3.7%, which means the company is not yet turning its strong product economics into peer-level capital efficiency. In my view, the key question is whether operating margin can move closer to the gross margin base over time; if it does, the earnings profile will look much better than the current return metrics suggest.
Valuation
SNPS — Valuation Multiples
| Metric | Value |
|---|---|
| Current Share Price (USD) | 480.4 |
| Market Cap (USD Mil) | 92,061 |
| Enterprise Value (USD Mil) | 90,583 |
| Forward P/E | 27.2 |
| Price/Sales (TTM) | 9.8 |
| Price/Book (mrq) | 3 |
| EV/Revenue | 9.6 |
| EV/EBITDA | 43.6 |
| Beta (5Y Monthly) | 1.23 |
| FCF Yield % (TTM) | 3.7% |
| Forward EPS (USD) | 17.7 |
| Analyst Target Price – Low (USD) | 414.8 |
| Analyst Target Price – Mean (USD) | 563.4 |
| Analyst Target Price – High (USD) | 700 |
| # Analyst Opinions | 26 |
Source: Yahoo Finance
Synopsys trades at $480.4 per share, or 43.6x EV/EBITDA, 9.6x EV/revenue, 9.8x price/sales, and 27.2x forward P/E. That is a premium multiple set, and I think it is justified only if the company keeps compounding revenue while also proving that operating margin can expand.
On the analysis here, I would put fair value in a range of roughly $257-$774 per share using the peer EV/revenue framework, which brackets the current price. The range sits inside the $415-$$700 analyst target band, so there is meaningful Street support for the stock, but my own range is narrower than the full consensus because I weight leverage and operating margin more heavily than the market appears to. Forward EPS of $17.7 also implies the stock is paying for durable earnings growth rather than just current sales momentum, and that is why the valuation still feels demanding.
I merged the rating view into this section because the stock is not cheap enough to ignore execution risk, even though the business quality is clearly above average. The valuation case is therefore not a simple “expensive” call; it is a premium price for a premium franchise that still has to prove it can absorb the Ansys deal without diluting returns.
Leverage
SNPS — Leverage & Coverage (Quarterly)
| Metric | Value |
|---|---|
| Total Debt/Equity % (mrq) | 34.8 |
| Current Ratio (mrq) | 1.3 |
| Total Debt (mrq, USD Mil) | 10,841.8 |
| Operating Cash Flow (TTM, USD Mil) | 2,938.3 |
| Levered Free Cash Flow (TTM, USD Mil) | 3,425.5 |
| Net Debt/EBITDA (TTM) | 3.5 |
| FCF Margin % (TTM) | 36.4% |
Source: Yahoo Finance — Quarterly Financial Statements
Synopsys has $10.8B of total debt, a 34.8% debt-to-equity ratio, and a current ratio of 1.3. That is levered, but not stretched, especially given $2.9B of operating cash flow and $3.4B of levered free cash flow over the trailing twelve months.
Net debt/EBITDA is 3.5x, which is the number I care about most because it captures how much debt sits against recurring earnings power. The 36.4% FCF margin is the offset: cash conversion is strong enough to support the balance sheet, but not so strong that leverage stops mattering. I would view this as manageable refinancing risk rather than distress risk, yet the margin for error is not wide if EBITDA weakens or if the merger takes longer than expected to close.
Insider Activity
The insider transaction record is one-sided: 8 open-market sales and 0 open-market purchases from 2025-01-14 to 2026-06-01. Sales came from the CEO, CFO, Executive Chair, and General Counsel, so the signal is broad rather than isolated.
I would not overread the absolute dollar size of those trades relative to a $92.1B market cap, but the direction still matters. The pattern does not change the thesis on its own, yet it does reinforce the idea that insiders are not using current prices to add exposure.
Comparable Analysis
LF0 has published standalone analyses of these peers: Texas Instruments (TXN) (rated Hold).
Growth
| Company | Revenue TTM (USD Mil) | Revenue Growth YoY % | Diluted EPS TTM |
|---|---|---|---|
| SNPS | 9,416.5 | 42.4% | 5.7 |
| CDNS | 5,837.6 | 24.2% | 5 |
| RMBS | 756.3 | 20.4% | 2.2 |
| MCHP | 5,122.3 | 38.0% | 0.7 |
| ADSK | 7,790 | 16.1% | 7.7 |
| TXN | 19,453 | 22.8% | 6.6 |
Source: Yahoo Finance
Synopsys is the fastest grower in the peer set, with $9.4B of revenue and 42.4% revenue growth TTM. That is well ahead of CDNS at 24.2%, RMBS at 20.4%, ADSK at 16.1%, and TXN at 22.8%, so the market is paying for the strongest top-line momentum in the group.
What keeps that from being a blank check is that MCHP still posted 38.0% growth, so Synopsys is leading, not alone. In other words, the growth premium is real, but it is not so unique that it can justify any multiple the market wants to assign.
Valuation
| Company | Current Share Price (USD) | Trailing P/E | Forward P/E | EV/Revenue | EV/EBITDA | Price/Sales (TTM) | Price/Book (mrq) | Market Cap (USD Mil) | Enterprise Value (USD Mil) | Beta (5Y Monthly) | FCF Yield % (TTM) | Forward EPS | Analyst Target Price – Low | Analyst Target Price – Mean | Analyst Target Price – High | # Analyst Opinions |
|---|---|---|---|---|---|---|---|---|---|---|---|---|---|---|---|---|
| SNPS | 480.4 | 83.7 | 27.2 | 9.6 | 43.6 | 9.8 | 3 | 92,061 | 90,583 | 1.23 | 3.7% | 17.7 | 414.8 | 563.4 | 700 | 26 |
| CDNS | 346 | 68.9 | 36.2 | 15.8 | 42.7 | 16.3 | 13.9 | 95,432 | 92,050 | 1.14 | 1.7% | 9.6 | 300 | 405.5 | 470 | 26 |
| RMBS | 107.3 | 49.2 | 28.8 | 14.2 | 34 | 15.3 | 7.9 | 11,600 | 10,776 | 1.87 | 1.7% | 3.7 | 100 | 147.9 | 180 | 7 |
| MCHP | 77.5 | 112.3 | 16.9 | 9.2 | 31.4 | 8.2 | 6.5 | 42,061 | 47,356 | 1.74 | 3.2% | 4.6 | 80 | 107.8 | 135 | 25 |
| ADSK | 210.9 | 27.3 | 14.9 | 5.5 | 18.9 | 5.7 | 13 | 44,072 | 43,231 | 1.31 | 7.2% | 14.2 | 215 | 307.5 | 375 | 34 |
| TXN | 280.2 | 42.6 | 26.3 | 13.5 | 27.6 | 13.2 | 14.2 | 255,865 | 262,843 | 1.31 | 1.4% | 10.6 | 225 | 324.7 | 400 | 31 |
Source: Yahoo Finance
Synopsys trades at 9.6x EV/revenue and 43.6x EV/EBITDA, which is above ADSK on EV/revenue but below CDNS and RMBS. Its 3.7% FCF yield is also lower than the better-cash-generating names in the group, so the stock is not cheap on cash flow either.
The peer-implied range from the valuation framework sits around $257-$774 per share, and that range is consistent with a stock that is priced for quality rather than distress. I also think the market is giving Synopsys more credit for growth than for returns, because its 42.4% revenue growth comes with weaker operating margins and lower ROE than CDNS, TXN, and ADSK.
Profitability
| Company | Operating Margin (TTM) | Net Margin (TTM) | Return on Assets (TTM) | Return on Equity (TTM) | Gross Margin (TTM) | EBITDA Margin (TTM) |
|---|---|---|---|---|---|---|
| SNPS | 14.5% | 11.4% | 1.4% | 3.7% | 82.9% | 22.0% |
| CDNS | 28.6% | 23.6% | 10.6% | 23.2% | 85.9% | 36.9% |
| RMBS | 36.7% | 31.7% | 11.0% | 17.8% | 80.4% | 41.9% |
| MCHP | 24.0% | 9.3% | 3.5% | 7.2% | 60.2% | 29.4% |
| ADSK | 29.2% | 21.1% | 11.5% | 53.9% | 92.5% | 29.3% |
| TXN | 42.6% | 31.1% | 13.1% | 35.2% | 58.3% | 48.9% |
Source: Yahoo Finance
Synopsys’ 82.9% gross margin is strong, but its 14.5% operating margin is well below CDNS at 28.6%, RMBS at 36.7%, ADSK at 29.2%, and TXN at 42.6%. That gap says the issue is not product economics; it is operating expense intensity.
ROE of 3.7% and ROA of 1.4% are also low versus peers, which means the company is not yet converting its revenue base into the kind of returns that usually support a sustained premium multiple. The margin profile is good enough to justify quality status, but not yet good enough to justify complacency.
Leverage
| Company | Total Debt/Equity % (mrq) | Current Ratio (mrq) | Total Debt (mrq, USD Mil) | Operating Cash Flow TTM (USD Mil) | Free Cash Flow TTM (USD Mil) | Net Debt/EBITDA (TTM) | FCF Margin % (TTM) |
|---|---|---|---|---|---|---|---|
| SNPS | 34.8 | 1.3 | 10,841.8 | 2,938.3 | 3,425.5 | 3.5 | 36.4% |
| CDNS | 38.7 | 1.7 | 2,651.4 | 1,854.9 | 1,609.7 | 0.5 | 27.6% |
| RMBS | 1.5 | 9.8 | 21.8 | 332.7 | 202.3 | -2.5 | 26.8% |
| MCHP | 83.7 | 1.9 | 5,398.7 | 1,198 | 1,364.8 | 3.4 | 26.6% |
| ADSK | 109.5 | 0.9 | 3,705 | 2,896 | 3,157.5 | -0.2 | 40.5% |
| TXN | 78 | 4.9 | 14,052 | 8,667 | 3,545.2 | 0.7 | 18.2% |
Source: Yahoo Finance
Synopsys’ 3.5x net debt/EBITDA is far above CDNS at 0.5x and ADSK at net cash of 0.2x, though it is still manageable because FCF margin is 36.4%. That combination matters: the company is not overlevered in a distress sense, but it is more levered than the best-in-class software names, so the equity has less room for execution error.
The leverage gap also helps explain part of the valuation gap. Investors are paying for growth, but they are not getting balance-sheet safety at the same time, which is why the premium multiple still feels demanding rather than obviously cheap.
Conclusion
I would put my rating as a Hold because the core business is strong, but the next leg of value creation depends on the Ansys deal improving earnings quality faster than it increases financial risk. Synopsys has the growth, the margins, and the cash generation to support a premium valuation, yet the current numbers still show only 14.5% operating margin and 3.5x net debt/EBITDA, so the stock is already discounting a lot of success.
The bull case is straightforward. If the merger closes without a material delay and the combined company can push operating margin above 14.5%, meaning the deal is adding scale without destroying profitability, I would move more toward Buy. On the current $9.4B revenue base, even a modest step-up in operating margin would create enough incremental operating profit to improve the deleveraging path and make the current multiple easier to defend.
The bear case is equally clear. If approvals slip, if the $1.5B termination fee becomes a real cash hit, or if net debt/EBITDA moves above 4.0x, meaning leverage is rising faster than the business can absorb it, I would move from Hold toward Sell. In that scenario, the 36.4% FCF margin would still be useful, but it would not be enough to offset a weaker balance-sheet setup and a slower path to synergy capture.
Weighing both sides, I think the market is more likely to see integration noise before it sees clean earnings upside. That is why I stay at Hold: the upside case is real, but it still needs proof that the merger lifts returns faster than it lifts risk.
What to Watch Next
- Operating margin above 14.5% — would support moving the rating toward Buy.
- Net debt/EBITDA below 3.0x — would show the balance sheet is healing.
- Ansys regulatory approvals — a clean close would reduce execution risk.
- FCF margin staying near 36.4% — would confirm cash conversion is still strong.
- Any move above 4.0x net debt/EBITDA — would raise leverage risk and pressure the rating.
What’s your take? I rated Synopsys (SNPS) HOLD above — but the goal here is to get this right, not just to publish an opinion. What would you add to this analysis, or which risk or catalyst do you think I’m under- or over-weighting? Tell me in the comments.
Sources
- SEC 10-K Annual Report — filed 2024-12-19
- SEC 8-K Filing (2024-12-04)
- SEC 8-K Filing (2024-11-25)
- SEC 8-K Filing (2024-10-01)
- SEC 8-K Filing (2024-08-21)
- SEC 8-K Filing (2024-07-12)
- SEC 8-K Filing (2024-05-22)
- SEC Form 4 Insider Transaction (2026-06-02)
- SEC Form 4 Insider Transaction (2026-06-02)
- SEC Form 4 Insider Transaction (2026-05-18)
- SEC 10-K Annual Report — FY2024
- SEC 10-K Annual Report — FY2023
- SEC 10-K Annual Report — FY2022
- SEC 10-K Annual Report — FY2021
- SEC 10-K Annual Report — FY2020
Data sourced from Yahoo Finance and SEC EDGAR. Not investment advice.
Leave a Comment