
| Company | Oct 25 | Nov 25 | Dec 25 | Jan 26 | Feb 26 | Mar 26 | Apr 26 | May 26 | Jun 26 | Jul 26 | Aug 26 | Sep 26 | 12-Mo |
|---|---|---|---|---|---|---|---|---|---|---|---|---|---|
| NLY | +5% | +8% | +1% | +3% | +1% | -6% | +8% | -5% | +6% | +2% | +1% | -8% | +15% |
| AGNC | +3% | +6% | +3% | +7% | -1% | -9% | +11% | -4% | +6% | -1% | +2% | -11% | +11% |
| ARR | +10% | +10% | +2% | -0% | +5% | -6% | +7% | -1% | +3% | -4% | -0% | -12% | +11% |
| DX | +9% | +7% | +0% | +1% | +2% | -8% | +8% | -3% | +1% | -2% | +3% | -10% | +8% |
| RITM | -2% | +5% | -3% | +0% | -8% | -6% | +6% | -5% | +1% | +8% | +2% | -9% | -12% |
| STWD | -6% | +1% | +1% | -0% | -1% | -1% | +7% | -7% | -1% | -2% | -2% | -5% | -17% |
Source: Yahoo Finance monthly adjusted close.
Quick Thesis
- Rated hold — high income and returns, but leverage and liquidity cap upside.
- Strongest financial point: TTM ROE is 19.6% with net margin at 90.7%.
- Biggest financial risk: total debt/equity is 737.5% and current ratio is 0.6x.
- Valuation is mixed: 4.9x trailing P/E and 0.9x price/book.
- I would raise the rating if current ratio moved above 0.8x and operating cash flow stayed above 800M.
Executive Summary
Rating: HOLD | NLY
We’ll begin tracking this call’s performance since publication once sufficient adjusted-close data is available.
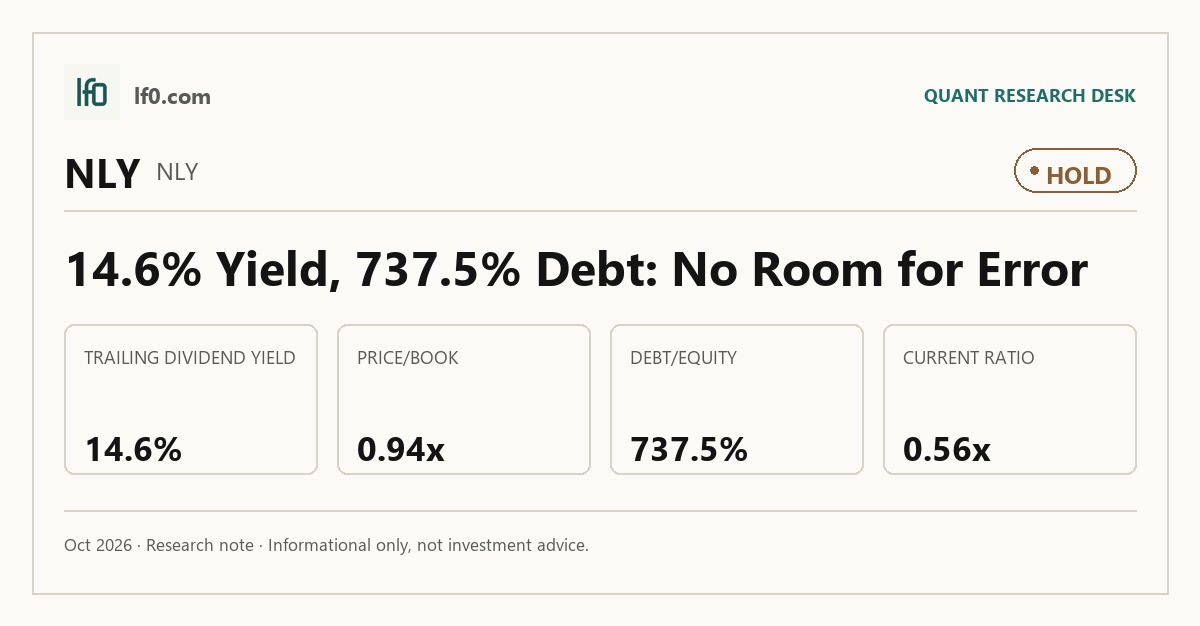
I would put my rating as a Hold because Annaly Capital Management still produces very high returns, but the stock already reflects that income profile and the balance sheet leaves little room for error. TTM return on equity was 19.6% and return on assets was 2.3%, which tells me the mortgage REIT model is working and supports the dividend. The risk is leverage: total debt was 125.2B mrq and total debt to equity was 737.5% mrq, so a small move in funding or asset values can hit book value quickly. The shares trade at 0.9x price to book and a 14.6% trailing dividend yield, which is why I do not see enough discount to call it a Buy. I would raise my rating more towards a Buy if book value per share moved back above 20.2 and the current ratio stayed above 0.8x, meaning near-term liquidity is clearly better, while the dividend remained intact.
Company Profile
Annaly Capital Management, Inc. is a real estate investment trust that invests primarily in mortgage assets and distributes taxable income to stockholders. It intends to pay at least 90% of REIT taxable income each year and often targets 100%, so the business is built around cash generation and dividend capacity rather than retained earnings. Founded in 1997, Annaly is headquartered in New York and listed on the New York Stock Exchange under NLY. Its financing model combines equity and debt tied to the mortgage portfolio, and capital is returned through dividends and, when appropriate, share repurchases.
Economic Moat
Business Model
The most durable advantage is the REIT structure that forces at least 90% of taxable income to be distributed each year, with management also intending to distribute 100% so the trust is not subject to tax, according to their SEC filings. In my view, that structure is hard for a well-funded competitor to replicate within 3 years because it is embedded in the entity form, not in a product, patent, or operating process. Annaly also has capital return flexibility: it can return capital through dividends or repurchases when new investments do not clear its cost of capital, which lets management recycle capital rather than hoard it. That structure is consistent with the very high TTM margins later in the article, so the moat shows up in both the business model and the numbers.
Business & Operating Risks
Sales of a substantial number of shares of common stock or other equity-related securities remain the clearest disclosed risk because they can depress the market price and impair capital raising. For Annaly, that is not abstract boilerplate: the company has 1,531.8M authorized shares of capital stock, so equity issuance is a standing part of the financing toolkit, and heavier use of that tool would likely pressure per-share value even if portfolio performance held up. The second current risk is policy discretion, since the board and management can amend investment, financing, capital allocation, and distribution policies at any time without a vote of stockholders, which means dividend policy and asset mix can change quickly. I do not think these risks threaten the structural REIT advantage itself, but they do threaten how much of that advantage reaches common shareholders.
Management Discussion & Analysis
Management is signaling a defensive posture rather than a growth push, with the MD&A focused on risk management language around mortgage-backed securities, variation margin, and weighted average life. For a mortgage REIT like Annaly, that reads as balance-sheet management first and asset growth second. The filing does not disclose a new buyback, dividend change, or financing transaction, so there is no fresh capital deployment signal to offset that caution. The current tone suggests management is responding to the funding and dilution risks above, but it has not yet shown me a new catalyst that would change the thesis on its own.
Recent Events
The April 21, 2026 earnings release and investor presentation show that Annaly is still actively managing the portfolio through the rate cycle rather than standing still. That does not point to a strategic pivot, but it does reinforce the idea that funding mix and hedging discipline matter more here than headline growth. The January 28, 2026 fourth-quarter 2025 presentation and financial supplement point in the same direction: management continues to keep the market focused on book value, leverage, and preferred stock positioning. In my view, those disclosures support continuity in the moat, but they do not yet show a new source of edge.
Financial Analysis
Growth
NLY — Financial Growth (Quarterly, USD Mil)
| Metric | 2025-06-30 | 2025-09-30 | 2025-12-31 | 2026-03-31 | 2026-06-30 |
|---|---|---|---|---|---|
| REVENUE (USD Mil) | 110.8 | 885.6 | 1,061.4 | 332.2 | 892.9 |
| NET INCOME (USD Mil) | 57.1 | 832.4 | 1,013.5 | 282.7 | 822.7 |
| DILUTED EPS | 0 | 1.2 | 1.4 | 0.3 | 1.1 |
Source: Yahoo Finance — Quarterly Financial Statements
Revenue was $332.2M in Q1 2026 and $892.9M in Q2 2026, while net income was $282.7M and $822.7M in those same quarters. The jump is large, but for a mortgage REIT I read it as rate and portfolio mix sensitivity rather than a classic operating growth engine. Diluted EPS moved from 0.3 to 1.1 over that span, which confirms the earnings leverage but also reminds me that this business can swing quickly with funding conditions. Growth is supportive, yet it is not the main reason to own the stock.
Profitability
NLY — Profitability (TTM)
| Metric | TTM |
|---|---|
| Operating Margin (TTM) | 91.7% |
| Net Margin (TTM) | 90.7% |
| Return on Assets (TTM) | 2.3% |
| Return on Equity (TTM) | 19.6% |
| Gross Margin (TTM) | 98.0% |
Source: Yahoo Finance — Trailing Twelve Months (TTM)
TTM operating margin was 91.7%, net margin was 90.7%, and gross margin was 98.0%, which is exactly what I would expect from a spread-income model rather than a manufacturing or software business. The 6.3 percentage point gap between gross margin and operating margin shows overhead is still modest relative to revenue, so the core earnings engine is intact. TTM ROA was 2.3% and ROE was 19.6%, which means returns are strong but clearly amplified by leverage. That combination supports the dividend, but it also means the equity is more sensitive to funding and asset marks than the headline margins alone suggest.
Valuation
NLY — Valuation Multiples
| Metric | Value |
|---|---|
| Current Share Price (USD) | 18.9 |
| Market Cap (USD Mil) | 14,238 |
| Enterprise Value (USD Mil) | 140,836 |
| Trailing P/E | 4.9 |
| Forward P/E | 6.1 |
| Price/Sales (TTM) | 4.4 |
| Price/Book (mrq) | 0.9 |
| EV/Revenue | 43.3 |
| Beta (5Y Monthly) | 1.24 |
| Forward EPS (USD) | 3.1 |
| Analyst Target Price – Low (USD) | 22.5 |
| Analyst Target Price – Mean (USD) | 24.2 |
| Analyst Target Price – High (USD) | 25 |
| # Analyst Opinions | 11 |
Source: Yahoo Finance
Annaly’s primary valuation anchor is 0.9x price/book, because the earnings-based multiples are not the cleanest lens for a mortgage REIT. At the current share price of 18.9, the stock trades at 4.4x price/sales, 4.9x trailing P/E, and 6.1x forward P/E, while the market is also paying 43.3x EV/revenue on a capital-intensive balance sheet. That mix tells me the market is paying for income stability and book value preservation, not for a growth rerating. With 11 analyst opinions, the target range of 22.5 to 25.0 implies upside from here, and my own fair-value range is roughly 19 to 23. That sits below the analyst mean of 24.2, because I weight leverage and liquidity more heavily than the consensus appears to. On an EPS basis, my range implies about 3.0 to 3.2 of forward earnings per share, which is close to the company’s own 3.1 forward EPS and broadly in line with peers on a like-for-like basis. The stock is not expensive, but it is not cheap enough for me to call it a Buy given the balance-sheet profile.
Leverage
NLY — Leverage & Coverage (Quarterly)
| Metric | Value |
|---|---|
| Total Debt/Equity % (mrq) | 737.5 |
| Current Ratio (mrq) | 0.6 |
| Total Debt (mrq, USD Mil) | 125,222.9 |
| Operating Cash Flow (TTM, USD Mil) | 886.4 |
Source: Yahoo Finance — Quarterly Financial Statements
Total debt was 125.2B mrq, and total debt/equity was 737.5%, so the capital structure is heavily debt funded. Current ratio was 0.6x mrq, which means near-term liquid assets do not fully cover current liabilities. Operating cash flow was 886.5M TTM, but levered free cash flow and net debt/EBITDA were not provided. I read that as manageable in a normal funding environment, but tight enough that a small shock to spreads or collateral values could matter quickly. The leverage profile is the main reason I stay at Hold rather than moving more constructive.
Insider Activity
The insider transaction record is one-sided: 10 open-market sales and 0 open-market purchases over the 2025-02-01 to 2026-05-14 window, so insiders are net sellers. The selling is broad rather than concentrated, with the CEO, CFO, and President and COO all transacting, which suggests weak alignment with outside shareholders at current prices. That does not prove the stock is mispriced, but it does tell me management is not signaling conviction through open-market buying.
Comparable Analysis
Growth
| Company | Revenue TTM (USD Mil) | Revenue Growth YoY % | Diluted EPS TTM |
|---|---|---|---|
| NLY | 3,254.6 | 479.4% | 3.9 |
| AGNC | 2,401 | — | 2 |
| ARR | 490.7 | — | 4.3 |
| DX | 502.3 | — | 3.1 |
| RITM | 4,316.5 | 9.7% | 0.6 |
| STWD | 597.3 | 13.4% | 0.6 |
Source: Yahoo Finance
NLY’s revenue TTM was 3,254.6M, up 479.4% year over year, versus 9.7% for RITM and 13.4% for STWD. AGNC, ARR, and DX do not show a comparable growth rate in the table, which makes NLY’s growth look unusually strong on the surface. I would not overread that edge, though, because this is a mortgage REIT and the growth is more about portfolio and rate effects than a durable operating expansion.
Valuation
| Company | Current Share Price (USD) | Trailing P/E | Forward P/E | EV/Revenue | EV/EBITDA | Price/Sales (TTM) | Price/Book (mrq) | Market Cap (USD Mil) | Enterprise Value (USD Mil) | Beta (5Y Monthly) | Forward EPS | Analyst Target Price – Low | Analyst Target Price – Mean | Analyst Target Price – High | # Analyst Opinions |
|---|---|---|---|---|---|---|---|---|---|---|---|---|---|---|---|
| NLY | 18.9 | 4.9 | 6.1 | 43.3 | — | 4.4 | 0.9 | 14,238 | 140,836 | 1.24 | 3.1 | 22.5 | 24.2 | 25 | 11 |
| AGNC | 9.1 | 4.5 | 6 | 34.8 | — | 4.5 | 1 | 10,752 | 83,515 | 1.30 | 1.5 | 10 | 11.1 | 12 | 9 |
| ARR | 13.8 | 3.2 | 4.7 | 40.4 | — | 4 | 0.7 | 1,958 | 19,838 | 1.34 | 2.9 | 18 | 18.4 | 19 | 4 |
| DX | 11.1 | 3.6 | 7.1 | 49.6 | — | 5.5 | 0.9 | 2,756 | 24,902 | 0.94 | 1.6 | 14.5 | 14.8 | 15 | 5 |
| RITM | 8.9 | 15.1 | 3.8 | 9.8 | — | 1.2 | 0.7 | 4,987 | 42,446 | 1.11 | 2.4 | 12.5 | 13.2 | 14 | 10 |
| STWD | 13.5 | 22.9 | 7.1 | 48.7 | — | 8.6 | 0.8 | 5,127 | 29,075 | 1.03 | 1.9 | 17 | 19.9 | 24 | 8 |
Source: Yahoo Finance
NLY trades at 4.9x trailing P/E, 6.1x forward P/E, 4.4x price/sales, and 0.9x price/book. AGNC is at 4.5x trailing P/E and 1.0x price/book, ARR at 3.2x and 0.7x, DX at 3.6x and 0.9x, RITM at 15.1x and 0.7x, and STWD at 22.9x and 0.8x. On a peer basis, NLY is not the cheapest name, but it is also not being priced like a premium compounder. The 1-year total return of 7.0% is ahead of AGNC’s 6.1% and DX’s 5.8%, but below ARR’s 9.7%, so the market has rewarded NLY without assigning a clear growth premium.
Profitability
| Company | Operating Margin (TTM) | Net Margin (TTM) | Return on Assets (TTM) | Return on Equity (TTM) | Gross Margin (TTM) |
|---|---|---|---|---|---|
| NLY | 91.7% | 90.7% | 2.3% | 19.6% | 98.0% |
| AGNC | 95.6% | 94.4% | 2.0% | 19.8% | 100.0% |
| ARR | 87.0% | 87.8% | 2.2% | 20.3% | 100.0% |
| DX | 91.8% | 86.8% | 2.3% | 18.2% | 100.0% |
| RITM | 7.9% | 10.8% | 1.0% | 5.6% | 95.6% |
| STWD | -5.9% | 38.2% | 0.4% | 3.7% | 86.5% |
Source: Yahoo Finance
NLY’s operating margin of 91.7%, net margin of 90.7%, gross margin of 98.0%, ROE of 19.6%, and ROA of 2.3% sit close to AGNC’s 95.6%, 94.4%, 100.0%, 19.8%, and 2.0%. ARR is similar on ROE at 20.3% and slightly higher on ROA at 2.2%, while RITM and STWD are much lower on both return measures. That tells me NLY is earning peer-like returns, not superior returns, and the leverage profile is doing most of the work.
Leverage
| Company | Total Debt/Equity % (mrq) | Current Ratio (mrq) | Total Debt (mrq, USD Mil) | Operating Cash Flow TTM (USD Mil) |
|---|---|---|---|---|
| NLY | 737.5 | 0.6 | 125,222.9 | 886.5 |
| AGNC | 717.1 | 0.2 | 89,945 | 886 |
| ARR | 756.7 | 1.1 | 19,516.6 | 319.5 |
| DX | 713.5 | 0.1 | 22,653.9 | 236.6 |
| RITM | 387.6 | 1.1 | 36,627.3 | -1,881.5 |
| STWD | 331.1 | 12.9 | 23,785.7 | 1,090.6 |
Source: Yahoo Finance
NLY’s debt/equity is 737.5%, above RITM’s 387.6% and STWD’s 331.1%, but close to AGNC’s 717.1% and ARR’s 756.7%. The current ratio of 0.6x is better than AGNC’s 0.2x and DX’s 0.1x, though still tight in absolute terms. In other words, NLY is aggressive, but it is not obviously worse than the core agency peers on liquidity, which helps explain why its valuation is not collapsing relative to the group.
Conclusion
The key tension is that Annaly is still generating strong returns and paying a large dividend, but the leverage and liquidity profile are already tight enough that the income stream has to be funded carefully. I would put my rating as a Hold because the stock already reflects much of that income case at 0.9x price/book and a 14.6% dividend yield, while the balance sheet leaves little room for error.
What would move me higher is not just better earnings, but evidence that the funding profile is safer: current ratio above 0.8x, meaning near-term liquidity is clearly stronger, and operating cash flow staying above 800M while the payout ratio remains below 70.0%, showing the dividend is still covered without leaning harder on leverage. If that happens, I would be more willing to move toward a Buy because the yield would look less fragile and the book-value discount would be easier to trust.
What would push me lower is the opposite: current ratio below 0.5x, meaning current liabilities are even less covered by liquid assets, or debt/equity moving materially above 737.5% while the dividend stays unchanged. That would tell me the distribution is being preserved by stretching the balance sheet rather than by earning power, and the discount to book would start to look like a warning instead of a cushion.
Weighing both sides, I stay at Hold. The income case is real, but the next meaningful move is more likely to come from funding conditions and book-value stability than from a fresh operating catalyst, so I would wait for either better liquidity or a cheaper entry before getting more constructive.
What to Watch Next
- Current ratio above 0.8x — would support a move toward Buy.
- Operating cash flow above 800M — would help confirm dividend coverage.
- Debt/equity above 737.5% — would increase balance-sheet risk.
- Payout ratio below 70.0% — would support the dividend thesis.
- Book value per share above 20.2 — would make the discount more credible.
What’s your take? I rated Annaly Capital Management (NLY) HOLD above — but the goal here is to get this right, not just to publish an opinion. What would you add to this analysis, or which risk or catalyst do you think I’m under- or over-weighting? Tell me in the comments.
Sources
- SEC 10-K Annual Report — filed 2026-02-12
- SEC 8-K Filing (2026-04-21)
- SEC 8-K Filing (2026-04-21)
- SEC 8-K Filing (2026-04-21)
- SEC 8-K Filing (2026-01-28)
- SEC 8-K Filing (2026-01-28)
- SEC 8-K Filing (2026-01-28)
- SEC Form 4 Insider Transaction (2026-05-18)
- SEC Form 4 Insider Transaction (2026-05-05)
- SEC Form 4 Insider Transaction (2026-04-30)
- SEC 10-K Annual Report — FY2026
- SEC 10-K Annual Report — FY2025
- SEC 10-K Annual Report — FY2024
- SEC 10-K Annual Report — FY2023
- SEC 10-K Annual Report — FY2022
Data sourced from Yahoo Finance and SEC EDGAR. Not investment advice.
Leave a Comment