
| Company | Oct 25 | Nov 25 | Dec 25 | Jan 26 | Feb 26 | Mar 26 | Apr 26 | May 26 | Jun 26 | Jul 26 | Aug 26 | Sep 26 | 12-Mo |
|---|---|---|---|---|---|---|---|---|---|---|---|---|---|
| MSTR | -16% | -34% | -14% | -1% | -13% | -4% | +33% | -4% | -45% | +7% | +43% | +15% | -52% |
| BMNR | -10% | -29% | -18% | -8% | -24% | +4% | +8% | -10% | -31% | +30% | +47% | +4% | -49% |
| HUT | +46% | -11% | +2% | +22% | -5% | -12% | +62% | +65% | -8% | -7% | -27% | +9% | +147% |
| BTDR | +30% | -40% | -16% | +16% | -41% | +12% | +31% | +55% | -9% | -34% | +3% | -3% | -39% |
| CIFR | +48% | +9% | -27% | +8% | -2% | -18% | +38% | +33% | +4% | -9% | -31% | +2% | +26% |
| MARA | +0% | -35% | -24% | +6% | -6% | -9% | +47% | +20% | -3% | -19% | -5% | +5% | -38% |
Source: Yahoo Finance monthly adjusted close.
Quick Thesis
- Rated sell — valuation assumes bitcoin optionality the operating business has not earned.
- Strongest support is the treasury: 717,131 bitcoins as of February 13, 2026.
- Biggest risk is cash strain: levered free cash flow was -$22.6B TTM.
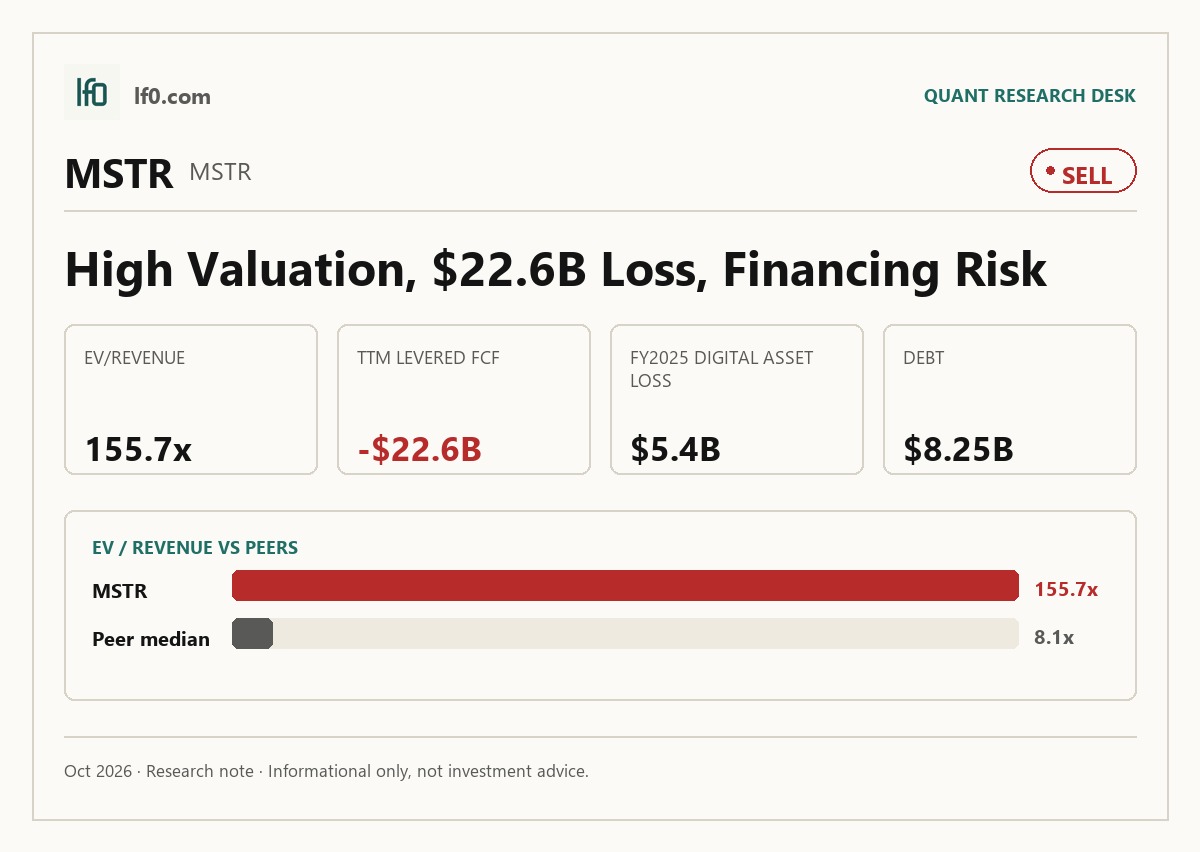
- The stock trades at 155.7x EV/revenue and 124.7x price/sales.
- I would turn more constructive only if operating margin turns positive and the reserve keeps covering preferred payouts.
Executive Summary
Rating: SELL | MSTR
We’ll begin tracking this call’s performance since publication once sufficient adjusted-close data is available.
I would put my rating as a sell because Strategy Inc. is priced for bitcoin treasury optionality that the operating business and cash flow do not yet support. Revenue grew 6.9% year over year in Q2 2026 to $122.4M, but that is a modest base for a $155.84 share price and it does not offset the valuation stretch. The most compelling strength is the treasury itself: 717,131 bitcoins as of February 13, 2026 give the equity real asset backing, yet the most important risk is equally clear, with $5.4B of unrealized digital-asset losses in FY2025 and negative levered free cash flow of -$22.6B TTM, which means the model still depends on external funding. I would turn more constructive if operating margin moved to a positive operating margin and if the USD Reserve, which was $2.25B on February 13, 2026, kept covering preferred dividends without more dilution.
Company Profile
Strategy Inc. combines enterprise analytics software with a bitcoin treasury strategy. The software business sells cloud subscriptions and support, on-premises licenses, consulting, education, and partner services, while the treasury side uses equity, preferred stock, convertible notes, and other debt to accumulate bitcoin and support digital credit instruments. The company was founded in 1989, went public in 1998, changed its name from MicroStrategy Incorporated to Strategy Inc. on August 11, 2025, and is headquartered in Tysons Corner, Virginia. It had 1,539 employees as of December 31, 2025 and sells globally through direct sales offices and channel partners.
Economic Moat
Business Model
The bitcoin treasury is the clearest structural advantage because 717,131 bitcoins, acquired at an aggregate purchase price of $54.5B as of February 13, 2026, are not something a smaller competitor can replicate quickly without moving the market against itself. In my view, that scale matters more than the software brand because the balance sheet now backs the equity and preferred stack directly. The financing toolkit built in 2025, including five classes of preferred stock and a $2.25B USD Reserve, gives Strategy more ways to fund dividends and interest than a plain bitcoin holder would have. That treasury advantage is hard to copy in the near term, and it is the real moat I see in the filing.
Business & Operating Risks
The main disclosed risk is that bitcoin volatility now runs straight through earnings and liquidity. According to the risk factors in their SEC 10-K, the company expects to keep buying bitcoin, and FY2025 already showed a $5.4B unrealized loss on digital assets. That matters because a sharp drawdown can hit reported net income, reduce financing capacity, and force bitcoin sales at poor prices if the reserve is depleted. A second risk is the capital structure itself: as of December 31, 2025, debt was $8.25B and annual contractual interest expense was $36.2M, while preferred obligations also sit ahead of common equity. The disclosed risks do threaten the moat, but they threaten the financing engine around the moat more than the bitcoin pile itself.
Management Discussion & Analysis
Management is responding to those risks by keeping the reserve and financing stack in place, but it is not reducing dependence on external capital. The company raised $23.2B of net proceeds in 2025, used $22.5B to buy bitcoin, and maintained a $2.25B USD Reserve as of February 13, 2026 to support preferred dividends and interest. That tells me management is protecting liquidity while continuing to accumulate bitcoin, which addresses the reserve risk but does not solve the underlying cash-generation problem. On the software side, subscription services revenue rose $68.9M in 2025 while product license revenue fell $8.9M and product support revenue fell $39.6M, yet operating cash flow was still negative -$67.2M in 2025. The software transition is real, but it has not yet become a self-funding engine.
Recent Events
The May 18 and June 8 capital-markets activity matters because it shows the treasury machine is still active. Strategy sold 19.5M STRC shares and 430,344 MSTR shares in the week ended May 17, then another 1.4M MSTR shares in the week ended June 7, and used the proceeds to buy 24,869 bitcoin and then 1,550 bitcoin. That reinforces the core thesis: management is still using market access to expand the bitcoin reserve rather than shrinking the balance sheet. The June 1 and June 8 updates also showed the USD Reserve at $900M and then $1B, which tells me management is keeping a liquidity buffer in place even as it keeps buying bitcoin. The reserve is a backstop, but it is not a substitute for operating cash flow.
Financial Analysis
Growth
MSTR — Financial Growth (Quarterly, USD Mil)
| Metric | 2025-06-30 | 2025-09-30 | 2025-12-31 | 2026-03-31 | 2026-06-30 |
|---|---|---|---|---|---|
| REVENUE (USD Mil) | 114.5 | 128.7 | 123 | 124.3 | 122.4 |
| EBIT (USD Mil) | 14,023.8 | 3,890.1 | -17,449.5 | -14.9 | -8,202.4 |
| EBITDA (USD Mil) | 14,032.9 | 3,894.3 | -17,443.9 | -6.2 | -8,190.1 |
| NET INCOME (USD Mil) | 10,020.8 | 2,785 | -12,436.7 | -12,542.7 | -8,219.6 |
| DILUTED EPS | 32.6 | 8.4 | -42.9 | -38.2 | -24.4 |
Source: Yahoo Finance — Quarterly Financial Statements
Revenue was $122.4M in Q2 2026 versus $114.5M in Q2 2025, up 6.9% year over year, but the path was uneven: $128.7M in Q3 2025, $123M in Q4 2025, and $124.3M in Q1 2026 before easing again. EBITDA and net income moved far more violently than sales, which tells me the earnings line is being driven by treasury marks and financing effects rather than by stable operating momentum. That is important because the business can show modest top-line growth while still producing very large swings in reported profit.
Profitability
MSTR — Profitability (TTM)
| Metric | TTM |
|---|---|
| Operating Margin (TTM) | -6,808.1% |
| Net Margin (TTM) | 0.0% |
| Return on Assets (TTM) | -38.7% |
| Return on Equity (TTM) | -63.6% |
| Gross Margin (TTM) | 67.6% |
| EBITDA Margin (TTM) | -7,295.1% |
Source: Yahoo Finance — Trailing Twelve Months (TTM)
TTM gross margin was 67.6%, but TTM operating margin was -6,808.1% and TTM EBITDA margin was -7,295.1%, so the company is converting a healthy gross profit layer into very large losses below the line. TTM ROA was -38.7% and TTM ROE was -63.6%, which means capital is still being deployed at deeply negative returns. The gap between gross margin and the rest of the income statement is the key point: the software franchise has some economic value, but it is not yet strong enough to offset the treasury-related cost structure. I would need to see operating margin turn positive before I would treat the core business as a real earnings engine.
Valuation
MSTR — Valuation Multiples
| Metric | Value |
|---|---|
| Current Share Price (USD) | 155.8 |
| Market Cap (USD Mil) | 62,143 |
| Enterprise Value (USD Mil) | 77,585 |
| Trailing P/E | — |
| Forward P/E | 3.1 |
| Price/Sales (TTM) | 124.7 |
| Price/Book (mrq) | 1.9 |
| EV/Revenue | 155.7 |
| EV/EBITDA | -2.1 |
| Beta (5Y Monthly) | 3.60 |
| FCF Yield % (TTM) | -36.4% |
| Forward EPS (USD) | 49.5 |
| Analyst Target Price – Low (USD) | 136 |
| Analyst Target Price – Mean (USD) | 229.9 |
| Analyst Target Price – High (USD) | 435 |
| # Analyst Opinions | 15 |
Source: Yahoo Finance
MSTR trades at 155.7x EV/revenue and 124.7x price/sales on a current share price of $155.84, which tells me the market is paying for bitcoin treasury optionality and software exposure rather than near-term operating earnings. The 3.15x forward P/E is the only earnings multiple that is still usable, but it sits beside a 2.85 PEG ratio, so the market is already assigning a premium to future growth. FCF yield was -36.4% TTM, and levered free cash flow was -$22.6B TTM, so the valuation is not being supported by cash conversion. On the analysis here, I would put fair value in a wide range of roughly $0-$68 per share if I anchor to peer EV/revenue and then net debt and cash, which is far below the current price. That range sits well below the $136-$435 analyst target band, and I think the gap reflects how much more heavily I weight cash burn and financing dependence than the consensus appears to. Forward EPS of $49.5 is much higher than BMNR’s $0.9, BTDR’s -$0.4, and MARA’s -$0.2, but that only matters if the market keeps assigning a very high multiple to the balance sheet and crypto exposure. In other words, the earnings power looks rich on paper, but the equity still trades as a treasury asset rather than a normal operating company. The rating justification is the same point in different form: the stock is expensive because the operating business does not yet justify the capital structure.
Leverage
MSTR — Leverage & Coverage (Quarterly)
| Metric | Value |
|---|---|
| Total Debt/Equity % (mrq) | 14.9 |
| Current Ratio (mrq) | 5.4 |
| Total Debt (mrq, USD Mil) | 6,770.8 |
| Operating Cash Flow (TTM, USD Mil) | -20.1 |
| Levered Free Cash Flow (TTM, USD Mil) | -22,587.5 |
| Net Debt/EBITDA (TTM) | -0.1 |
| FCF Margin % (TTM) | -4,532.5% |
Source: Yahoo Finance — Quarterly Financial Statements
Total debt was $6.8B mrq and total debt/equity was 14.9%, which is not a balance-sheet strain by itself. The current ratio was 5.4x, so near-term liquidity is ample. Cash flow is the weak point: operating cash flow was -$20.1M TTM, levered free cash flow was -$22.6B TTM, and FCF margin was -4,532.5% TTM, so the business is consuming liquidity rather than building it. Net debt/EBITDA was -0.1x TTM, which reflects net cash rather than net debt and gives the company room to absorb a downturn today. The leverage profile is manageable now, but the cash burn makes that cushion temporary if operating cash flow does not turn positive.
Insider Activity
The insider record is clearly net selling: 142 open-market sales for $71.3M versus 10 purchases for $2.8M over 2025-03-20 to 2026-06-05. The pattern is concentrated in the President & CEO and EVP & CFO, both of whom sold repeatedly on 2026-06-05. I do not read that as a thesis breaker on its own, but it does not help confidence when the stock already trades at a premium and the company is still dependent on external funding.
Comparable Analysis
LF0 has published standalone analyses of these peers: BitMine Immersion Technologies (BMNR) (rated Sell); Hut 8 (HUT) (rated Sell); Cipher Digital (CIFR) (rated Sell); MARA Holdings (MARA) (rated Sell).
Growth
| Company | Revenue TTM (USD Mil) | Revenue Growth YoY % | EBITDA TTM (USD Mil) | Diluted EPS TTM |
|---|---|---|---|---|
| MSTR | 498.4 | 6.9% | -36,355 | -99.2 |
| BMNR | 61.2 | 2,167.8% | -294.1 | -4.5 |
| HUT | 317.9 | 81.4% | -789.3 | -5.4 |
| BTDR | 812.3 | 47.1% | 484.8 | -1.9 |
| CIFR | 191.1 | -43.0% | 96.1 | -2.9 |
| MARA | 804.2 | -26.7% | -1,878.7 | -9.4 |
Source: Yahoo Finance
MSTR’s revenue grew 6.9% TTM to $498.4M, which is far slower than BMNR’s 2,167.8% and HUT’s 81.4%, but better than CIFR’s -43.0% and MARA’s -26.7%. That gap says MSTR is not the fastest top-line compounder in the group, so its premium has to come from something other than revenue acceleration.
Valuation
| Company | Current Share Price (USD) | Trailing P/E | Forward P/E | EV/Revenue | EV/EBITDA | Price/Sales (TTM) | Price/Book (mrq) | Market Cap (USD Mil) | Enterprise Value (USD Mil) | Beta (5Y Monthly) | FCF Yield % (TTM) | Forward EPS | Analyst Target Price – Low | Analyst Target Price – Mean | Analyst Target Price – High | # Analyst Opinions |
|---|---|---|---|---|---|---|---|---|---|---|---|---|---|---|---|---|
| MSTR | 155.8 | — | 3.1 | 155.7 | -2.1 | 124.7 | 1.9 | 62,143 | 77,585 | 3.60 | -36.4% | 49.5 | 136 | 229.9 | 435 | 15 |
| BMNR | 26.6 | — | 28.3 | 255 | -53.1 | 262.1 | 1.3 | 16,040 | 15,605 | 1.35 | -3.2% | 0.9 | 34 | 45.9 | 63.6 | 3 |
| HUT | 82.4 | — | -15.5 | 57.7 | -23.3 | 31.9 | 7 | 10,158 | 18,359 | 5.98 | -76.2% | -5.3 | 96 | 157.1 | 273 | 22 |
| BTDR | 10.1 | — | -27.1 | 5.3 | 9 | 3.4 | 2.5 | 2,741 | 4,342 | 2.50 | 0.6% | -0.4 | 10 | 21.8 | 35 | 14 |
| CIFR | 14.9 | — | 113.3 | 59.4 | 118.1 | 32.4 | 11 | 6,196 | 11,349 | 3.17 | -46.8% | 0.1 | 18 | 30.9 | 69 | 22 |
| MARA | 11 | — | -52.3 | 8.1 | -3.5 | 5.3 | 2.5 | 4,244 | 6,520 | 5.34 | -27.5% | -0.2 | 11 | 18.7 | 30 | 13 |
Source: Yahoo Finance
MSTR trades at 155.7x EV/revenue and 124.7x price/sales, versus BTDR at 5.3x and 3.4x, MARA at 8.1x and 5.3x, and HUT at 57.7x and 31.9x. On a peer multiple range, MSTR’s $498.4M of revenue would imply roughly $2.7B to $28.8B of enterprise value using BTDR’s 5.3x to HUT’s 57.7x EV/revenue, or about $0 to $68 per share after netting MSTR’s $6.8B of debt and $2.4B of cash and dividing by 379.1M shares; that is far below the actual $155.8 share price. The market is therefore paying for bitcoin-linked optionality, not for the operating business alone. MSTR’s 1-year total return of -52.5% also lags HUT’s 147.3% and CIFR’s 25.7%, so the premium valuation has not translated into better stock performance. The combination of rich multiples and weak one-year returns makes the valuation gap harder to defend.
Profitability
| Company | Operating Margin (TTM) | Net Margin (TTM) | Return on Assets (TTM) | Return on Equity (TTM) | Gross Margin (TTM) | EBITDA Margin (TTM) |
|---|---|---|---|---|---|---|
| MSTR | -6,808.1% | 0.0% | -38.7% | -63.6% | 67.6% | -7,295.1% |
| BMNR | 8.4% | 0.0% | -3.2% | -150.9% | 84.4% | -480.5% |
| HUT | -275.4% | -188.6% | -9.7% | -43.4% | 62.3% | -248.2% |
| BTDR | -42.7% | -28.1% | 3.9% | -25.3% | 0.7% | 59.7% |
| CIFR | -301.7% | 0.0% | -0.8% | -167.5% | -10.0% | 50.3% |
| MARA | -265.2% | 0.0% | -26.3% | -105.6% | 40.1% | -233.6% |
Source: Yahoo Finance
MSTR’s gross margin is 67.6%, above MARA’s 40.1% and below BMNR’s 84.4%, but the real issue is the rest of the income statement: operating margin is -6,808.1% and EBITDA margin is -7,295.1%, far worse than BMNR’s 8.4% operating margin and BTDR’s 59.7% EBITDA margin. The gap is not a cost-of-revenue problem, because gross margin is healthy; it is a scale and non-operating expense problem. That is why the equity case depends on financial assets and capital structure rather than core operating efficiency.
Leverage
| Company | Total Debt/Equity % (mrq) | Current Ratio (mrq) | Total Debt (mrq, USD Mil) | Operating Cash Flow TTM (USD Mil) | Free Cash Flow TTM (USD Mil) | Net Debt/EBITDA (TTM) | FCF Margin % (TTM) |
|---|---|---|---|---|---|---|---|
| MSTR | 14.9 | 5.4 | 6,770.8 | -20.1 | -22,587.5 | -0.1 | -4,532.5% |
| BMNR | 0 | 36.7 | 1.3 | -293.1 | -518.1 | 1.2 | -846.6% |
| HUT | 437.2 | 19.3 | 7,668.8 | -89.4 | -7,739.3 | -9.4 | -2,434.1% |
| BTDR | 177 | 1 | 1,952.3 | -1,622.1 | 15.8 | 3.1 | 1.9% |
| CIFR | 950.6 | 3 | 5,586.8 | -256.5 | -2,897.6 | 49.5 | -1,516.3% |
| MARA | 140.2 | 0.9 | 2,466 | -895 | -1,168.1 | -1.1 | -145.2% |
Source: Yahoo Finance
MSTR’s debt/equity is 14.9%, far below HUT’s 437.2% and MARA’s 140.2%, and its net debt/EBITDA is -0.1x because cash exceeds debt, unlike BTDR at 3.1x and CIFR at 49.5x. The catch is free cash flow margin of -4,532.5% and free cash flow of -$22.6B TTM, or about -$59.6 per share, so the balance sheet looks liquid on paper but the cash burn is severe enough that leverage is not the binding constraint. That also explains part of the valuation premium: investors are paying for balance-sheet optionality, but the cash profile still looks much weaker than the peer set.
Conclusion
I would put my rating as a sell because the treasury asset base is real, but the operating business and cash flow still do not support the price. The key tension is whether bitcoin appreciation and market access can keep funding the structure faster than dilution and cash burn erode the equity value. Right now, the answer is no: revenue is only $122.4M in Q2 2026, TTM operating margin is still -6,808.1%, and levered free cash flow is -$22.6B, so the stock is being carried by financing capacity rather than by self-funding earnings.
I would raise my rating more towards a hold if bitcoin strength and capital-market access both stay intact long enough for the treasury model to keep compounding without further dilution. A sustained move in bitcoin that keeps the USD Reserve above $1B, meaning preferred dividends and interest remain comfortably covered, would help. If operating cash flow also moved back above zero, the software business would finally stop being a drag on the capital structure and the market would have a cleaner earnings base to underwrite.
I would move from sell to strong sell if bitcoin weakness forces the financing stack to do more of the work while the software business stays cash negative. A drawdown that pushes the reserve toward the point where it no longer comfortably covers preferred dividends and interest would make the current structure much more fragile, and the FY2025 unrealized loss of $5.4B shows how quickly reported equity can be hit. If operating cash flow remains negative and the company has to lean harder on equity issuance to fund bitcoin purchases, dilution would compound the downside instead of cushioning it.
Weighing those paths, I lean to the bear case first because the company is still dependent on external funding and mark-to-market bitcoin gains to justify the equity. The software business has not yet shown enough cash generation to matter on its own, so I think the market is still paying ahead of the operating evidence.
What to Watch Next
- Operating margin turning positive — would show the software base is finally scaling.
- Operating cash flow above zero — would reduce dependence on external funding.
- USD Reserve staying above $1B — would keep preferred dividends and interest covered.
- Further bitcoin purchases funded by ATM issuance — would confirm the treasury model is still the main engine.
- Levered free cash flow improving from -$22.6B — would make the valuation easier to defend.
What’s your take? I rated Strategy (MSTR) SELL above — but the goal here is to get this right, not just to publish an opinion. What would you add to this analysis, or which risk or catalyst do you think I’m under- or over-weighting? Tell me in the comments.
Sources
- SEC 10-K Annual Report — filed 2026-02-19
- SEC 8-K Filing (2026-06-08)
- SEC 8-K Filing (2026-06-08)
- SEC 8-K Filing (2026-06-01)
- SEC 8-K Filing (2026-05-26)
- SEC 8-K Filing (2026-05-18)
- SEC 8-K Filing (2026-05-15)
- SEC Form 4 Insider Transaction (2026-06-05)
- SEC Form 4 Insider Transaction (2026-06-05)
- SEC Form 4 Insider Transaction (2026-06-02)
- SEC 10-K Annual Report — FY2026
- SEC 10-K Annual Report — FY2025
- SEC 10-K Annual Report — FY2024
- SEC 10-K Annual Report — FY2023
- SEC 10-K Annual Report — FY2022
Data sourced from Yahoo Finance and SEC EDGAR. Not investment advice.
Leave a Comment