| Company | Sep 25 | Oct 25 | Nov 25 | Dec 25 | Jan 26 | Feb 26 | Mar 26 | Apr 26 | May 26 | Jun 26 | Jul 26 | Aug 26 | 12-Mo |
|---|---|---|---|---|---|---|---|---|---|---|---|---|---|
| CEG | +7% | +15% | -3% | -3% | -21% | +18% | -15% | +12% | -8% | -14% | +6% | +5% | -10% |
| NRG | +11% | +6% | -1% | -6% | -4% | +18% | -18% | +6% | -14% | +9% | -8% | -18% | -23% |
| TLN | +12% | -6% | -1% | -5% | -7% | +6% | -14% | +17% | +4% | -1% | -13% | -11% | -22% |
| VST | +4% | -4% | -5% | -10% | -2% | +10% | -13% | +5% | +2% | -1% | -7% | -7% | -27% |
| EXC | +3% | +2% | +3% | -7% | +3% | +10% | -0% | -6% | -1% | +3% | -2% | -5% | +3% |
| DUK | +1% | +0% | +1% | -5% | +4% | +9% | +0% | -1% | -4% | +3% | -1% | -4% | +1% |
Source: Yahoo Finance monthly adjusted close.
Quick Thesis
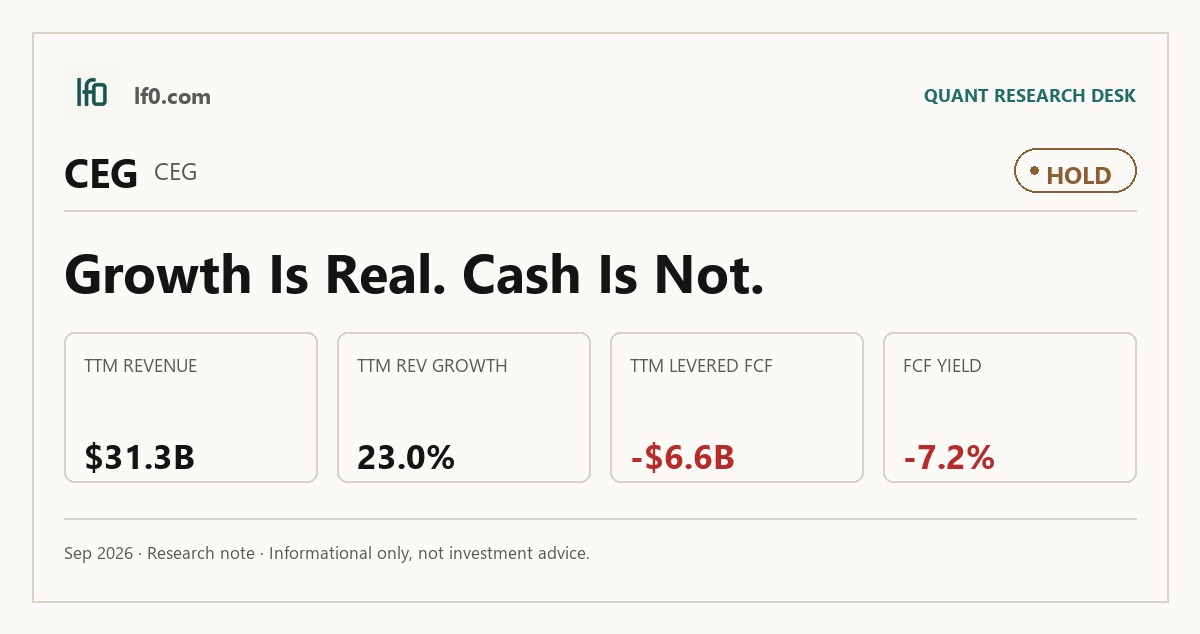
- Rated Hold — scale and growth improved, but cash conversion is still negative.
- Strongest strength: $31.3B TTM revenue with 23.0% growth.
- Biggest risk: levered free cash flow of -$6.6B TTM.
- Valuation is mixed: 14.8x EV/EBITDA and -7.2% FCF yield.
- I would raise my rating if levered free cash flow turns positive.
Executive Summary
Rating: HOLD | CEG
We’ll begin tracking this call’s performance since publication once sufficient adjusted-close data is available.
I would put my rating as a Hold because Constellation Energy has real scale and growth after Calpine, but the market is already paying for that improvement while levered free cash flow remains -$6.6B TTM and net debt sits at 3.0x EBITDA. The company’s largest U.S. nuclear fleet, 94.7% nuclear capacity factor in 2025, and 23.0% TTM revenue growth are genuine strengths, yet the current 3.8x EV/Revenue and 19.4x forward P/E already assume that the enlarged platform converts those assets into steadier earnings. I would turn more constructive if post-Calpine operating cash flow stays above $4.2B TTM and levered free cash flow turns positive, because that would show the larger fleet is funding itself rather than just expanding the top line.
Company Profile
Constellation Energy Corp. is a power producer and retail energy supplier that sells electricity, natural gas, and related energy products to utilities, municipalities, commercial and industrial customers, and households. After the January 2026 Calpine acquisition, it added a broader dispatchable generation and retail platform, with about 2.5 million customer accounts nationwide and a mix of nuclear, natural gas, geothermal, hydro, wind, and solar assets. The business is listed on Nasdaq under CEG and earns revenue from generation, retail supply, and long-term power contracts.
Economic Moat
Business Model
I feel the clearest structural edge here is the nuclear fleet. Constellation owns 14 nuclear generating stations and 25 units, and the 94.7% capacity factor in 2025 tells me that this is not just a large fleet but a highly reliable one. That matters because it gives the company a dependable block of zero-emissions output that can be sold into both wholesale and retail channels, and the 2025 nuclear fleet produced 183 TWh of electricity while supplying 68% of total electric supply. The customer-facing platform adds another layer: Constellation served approximately 2 million total customer accounts in 2025, including three-fourths of Fortune 100 companies, and held over 32% of the C&I market share of direct customer business. In my view, that combination of generation scale and customer reach is hard to replicate quickly because it rests on licensed assets, operating history, and long-dated relationships rather than a single product cycle.
Business & Operating Risks
The biggest disclosed risk is the Calpine integration, which the 10-K describes as complex, costly, and time-consuming and ties to potential unknown liabilities, possible loss of key employees and customers, and substantial litigation costs. That is not generic boilerplate, because the merger also issued 50 million newly issued shares, so any slippage can hit EPS through both integration drag and dilution. Wholesale power market design is the second major risk: PJM covers approximately 70% of generating resources, and rule changes there could pressure merchant pricing or even force premature retirements if they favor new supply too aggressively. Fuel and nuclear supply risk also remains central, especially given the exposure to price fluctuations, availability restrictions, tariffs, counterparty default, and geopolitical risk. Taken together, these risks do not break the moat, but they do test whether the nuclear and customer-platform advantage can keep translating into cash rather than just revenue.
Management Discussion & Analysis
Management is clearly leaning into scale rather than balance-sheet repair, and I think that is the right read on the filing. The January 7, 2026 Calpine acquisition cost approximately $22B, was funded with 50 million newly issued shares and approximately $4.5B in cash on hand, and brought in approximately 23 GW of generation capacity plus a retail platform serving approximately 62 TWh of load annually. The financing structure reinforces the point: the company assumed approximately $12.6B of Calpine debt, issued senior unsecured notes totaling $2.75B in January 2026, and expanded the revolving credit facility from $4.5B to $7.0B. That tells me management is willing to trade near-term flexibility for a broader earnings base, but the burden of proof now sits on cash conversion, not strategic ambition. The 2026 capital plan is also heavy, with approximately $5.7B of capex expected in 2026 and approximately $4.7B in 2027, including $3.9B of growth capex. The company is still funding long-duration nuclear and generation projects, but it is doing so with a much larger capital commitment than before.
Recent Events
The June 1, 2026 secondary offering tied to Calpine stockholders, followed by Constellation’s $558M repurchase of 2.0M shares on June 2, 2026, suggests management is still willing to return capital even after the deal. I read that as a positive signal on discipline, although it also means the company is not conserving every dollar for deleveraging. The March 23, 2026 board resignation by Alan Armstrong looks more like governance clean-up than a strategic shift, and the April 28, 2026 annual meeting left the board intact, approved pay, and reappointed PricewaterhouseCoopers LLP. The March 31, 2026 business and earnings outlook call, followed by the May 11, 2026 first-quarter results release, kept the market focused on Calpine integration and the promised EPS and free cash flow accretion. In my view, management is actively responding to the integration risk, but the cash-flow proof is still ahead of it.
Financial Analysis
Growth
CEG — Financial Growth (Quarterly, USD Mil)
| Metric | 2025-06-30 | 2025-09-30 | 2025-12-31 | 2026-03-31 | 2026-06-30 |
|---|---|---|---|---|---|
| REVENUE (USD Mil) | 6,101 | 6,570 | 6,074 | 11,122 | 7,504 |
| EBIT (USD Mil) | 1,391 | 1,529 | 805 | 2,378 | 1,183 |
| EBITDA (USD Mil) | 1,881 | 2,014 | 1,287 | 3,050 | 1,878 |
| NET INCOME (USD Mil) | 839 | 930 | 432 | 1,590 | 513 |
| DILUTED EPS | 2.7 | 3 | 1.4 | 4.5 | 1.4 |
Source: Yahoo Finance — Quarterly Financial Statements
Revenue jumped from $6.1B in Q2 2025 to $6.6B in Q3 2025, then slipped to $6.1B in Q4 2025 before surging to $11.1B in Q1 2026 and easing to $7.5B in Q2 2026. The Q1 2026 spike was the clear outlier, and the Calpine acquisition explains why I would not annualize it. EBITDA moved faster than revenue in Q1 2026, rising to $3.1B versus $2.4B EBIT, but the drop to $1.9B in Q2 2026 shows the step-up was not linear. Diluted EPS also swung from $2.97 in Q3 2025 to $1.38 in Q4 2025, then $4.49 in Q1 2026 and $1.42 in Q2 2026. Growth is a bull signal, but only if investors separate acquisition-driven scale from the underlying run rate.
Profitability
CEG — Profitability (TTM)
| Metric | TTM |
|---|---|
| Operating Margin (TTM) | 8.7% |
| Net Margin (TTM) | 11.1% |
| Return on Assets (TTM) | 3.9% |
| Return on Equity (TTM) | 15.1% |
| Gross Margin (TTM) | 22.1% |
| EBITDA Margin (TTM) | 25.4% |
Source: Yahoo Finance — Trailing Twelve Months (TTM)
TTM gross margin was 22.1%, EBITDA margin was 25.4%, operating margin was 8.7%, and net margin was 11.1%. The spread between gross margin and operating margin is wide, which tells me the business is still carrying heavy operating costs even after covering direct generation costs. EBITDA margin sits 16.8 percentage points above operating margin, so depreciation and amortisation remain a major drag on reported earnings, which is normal for a capital-intensive power fleet but still important for cash conversion. ROA was 3.9% and ROE was 15.1%, so returns are being amplified by leverage rather than by unusually high asset productivity. I would watch operating margin more than EBITDA margin from here, because a wider gap between the two would mean the larger platform is not absorbing overhead efficiently.
Valuation
CEG — Valuation Multiples
| Metric | Value |
|---|---|
| Current Share Price (USD) | 258.3 |
| Market Cap (USD Mil) | 91,509 |
| Enterprise Value (USD Mil) | 117,627 |
| Trailing P/E | 25.2 |
| Forward P/E | 19.4 |
| Price/Sales (TTM) | 2.9 |
| Price/Book (mrq) | 2.9 |
| EV/Revenue | 3.8 |
| EV/EBITDA | 14.8 |
| Beta (5Y Monthly) | 1.12 |
| FCF Yield % (TTM) | -7.2% |
| Forward EPS (USD) | 13.3 |
| Analyst Target Price – Low (USD) | 290 |
| Analyst Target Price – Mean (USD) | 347.3 |
| Analyst Target Price – High (USD) | 441 |
| # Analyst Opinions | 20 |
Source: Yahoo Finance
Constellation trades at 3.8x EV/Revenue, 2.9x price/sales, 14.8x EV/EBITDA, 25.2x trailing P/E, and 19.4x forward P/E, while FCF yield is -7.2% and levered free cash flow is -$6.6B TTM. At a current share price of $258, the market is paying for a utility-like cash generator plus a larger, more diversified fleet after the $22B Calpine deal, so the multiple implies confidence that the combined platform can convert scale into steadier earnings rather than just more revenue. The analyst set is meaningful at 20 opinions, with a low/mean/high target range of $290/$347/$441. On my read, fair value sits in a broad $250-$330 range: that is below the $347 consensus mean because I weight the negative free cash flow and integration burden more heavily than the sell-side appears to. Forward EPS of $13.3 is above NRG’s $11.2 and VST’s $10.4, but below TLN’s $30.8, so CEG is not priced like the highest-growth peer even though it carries a richer revenue multiple than NRG. That leaves the stock neither obviously cheap nor obviously expensive, which fits a Hold.
Leverage
CEG — Leverage & Coverage (Quarterly)
| Metric | Value |
|---|---|
| Total Debt/Equity % (mrq) | 76.4 |
| Current Ratio (mrq) | 1.5 |
| Total Debt (mrq, USD Mil) | 24,700 |
| Operating Cash Flow (TTM, USD Mil) | 4,206 |
| Levered Free Cash Flow (TTM, USD Mil) | -6,625.1 |
| Net Debt/EBITDA (TTM) | 3 |
| FCF Margin % (TTM) | -21.2% |
Source: Yahoo Finance — Quarterly Financial Statements
Total debt was $24.7B, with a total debt/equity ratio of 76.4% and a current ratio of 1.5x. Operating cash flow was $4.2B TTM, while levered free cash flow was -$6.6B TTM and FCF margin was -21.2% TTM. Net debt/EBITDA was 3.0x, which tells me the balance sheet is levered but not stretched for a utility-scale asset owner. The cash-flow gap is the bigger issue: EBITDA is not converting into free cash flow because capital spending and financing needs are absorbing more than the business generates, so reported earnings quality is weaker than the operating line suggests. In my view, that is manageable only if the company keeps converting operating cash flow into a lower capex burden over time.
Insider Activity
The insider transaction record I see is clearly net selling: 2 open-market sales and 0 open-market purchases in the 2024-12-31 to 2026-04-28 window, with $1.2M of sales and no offsetting buys. The pattern is concentrated rather than broad, because the only open-market activity comes from two insiders, and that leaves alignment looking weaker than it would with even modest insider buying. I would not overread two sales on their own, but they do not help the case for near-term upside.
Comparable Analysis
LF0 has published standalone analyses of these peers: Talen Energy (TLN) (rated Sell).
Growth
| Company | Revenue TTM (USD Mil) | Revenue Growth YoY % | EBITDA TTM (USD Mil) | Diluted EPS TTM |
|---|---|---|---|---|
| CEG | 31,270 | 23.0% | 7,952 | 10.2 |
| NRG | 33,125 | 11.0% | 3,253 | 3.8 |
| TLN | 3,741 | 111.2% | 582 | -4 |
| VST | 19,212 | -5.5% | 6,646 | 5.9 |
| EXC | 25,326 | 9.9% | 8,355 | 2.7 |
| DUK | 32,803 | 1.1% | 16,617 | 6.6 |
Source: Yahoo Finance
CEG’s revenue grew 23.0% TTM, faster than NRG at 11.0%, EXC at 9.9%, DUK at 1.1%, and VST at -5.5%, while TLN was the clear outlier at 111.2% because of a much smaller base and acquisition-driven expansion. That premium is partly justified because CEG also posted $31.3B of TTM revenue and $8B of EBITDA, so its growth is coming from a much larger earnings base than TLN’s $3.7B of revenue and -$4.0 diluted EPS TTM. In other words, CEG’s growth is more investable than TLN’s, but it is less explosive.
Valuation
| Company | Current Share Price (USD) | Trailing P/E | Forward P/E | EV/Revenue | EV/EBITDA | Price/Sales (TTM) | Price/Book (mrq) | Market Cap (USD Mil) | Enterprise Value (USD Mil) | Beta (5Y Monthly) | FCF Yield % (TTM) | Forward EPS | Analyst Target Price – Low | Analyst Target Price – Mean | Analyst Target Price – High | # Analyst Opinions |
|---|---|---|---|---|---|---|---|---|---|---|---|---|---|---|---|---|
| CEG | 258.3 | 25.2 | 19.4 | 3.8 | 14.8 | 2.9 | 2.9 | 91,509 | 117,626 | 1.12 | -7.2% | 13.3 | 290 | 347.3 | 441 | 20 |
| NRG | 98.1 | 25.5 | 8.8 | 1.4 | 13.8 | 0.6 | 4.9 | 20,618 | 45,054 | 1.17 | 3.8% | 11.2 | 104 | 188.6 | 270 | 16 |
| TLN | 298.1 | — | 9.7 | 6.4 | 41.2 | 3.8 | 8.8 | 14,282 | 23,951 | 1.63 | 8.8% | 30.8 | 307 | 460.6 | 560 | 17 |
| VST | 136.3 | 23 | 13.1 | 3.6 | 10.4 | 2.4 | 15.2 | 45,737 | 69,033 | 1.41 | 0.1% | 10.4 | 106 | 217.6 | 305 | 19 |
| EXC | 40.2 | 14.8 | 13.2 | 3.7 | 11.1 | 1.6 | 1.4 | 41,365 | 92,501 | 0.39 | -6.5% | 3 | 41 | 48.7 | 58 | 17 |
| DUK | 113 | 17 | 15.8 | 5.6 | 11 | 2.7 | 1.6 | 88,091 | 182,997 | 0.36 | -5.1% | 7.2 | 127 | 136.9 | 147 | 18 |
Source: Yahoo Finance
CEG trades at 3.8x EV/Revenue, 25.2x trailing P/E, 19.4x forward P/E, 2.9x price/sales, and a -7.2% FCF yield TTM, versus NRG at 1.4x EV/Revenue and 3.8% FCF yield, TLN at 6.4x and 8.8%, VST at 3.6x and 0.1%, EXC at 3.7x and -6.5%, and DUK at 5.6x and -5.1%. On a cash basis CEG screens weaker than NRG and TLN, so the multiple is not cheap, but the negative FCF yield is distorted by heavy investment and working capital, which means the market is paying for growth and balance-sheet optionality rather than current cash conversion. Using the peer EV/Revenue range of 1.4x to 6.4x on CEG’s $31.3B revenue gives an implied enterprise value of $42.5B to $200.3B; netting CEG’s $24.7B debt and $697M cash and dividing by 354.3M shares implies roughly $50.1 to $495.1 per share, a very wide peer-based range that shows the stock is not obviously cheap or expensive on revenue alone. Forward EPS of $13.3 sits above NRG’s $11.2 and VST’s $10.4, but below TLN’s $30.8, so the market is paying for a steadier utility-like earnings base than TLN’s higher but more volatile run-rate.
Profitability
| Company | Operating Margin (TTM) | Net Margin (TTM) | Return on Assets (TTM) | Return on Equity (TTM) | Gross Margin (TTM) | EBITDA Margin (TTM) |
|---|---|---|---|---|---|---|
| CEG | 8.7% | 11.1% | 3.9% | 15.1% | 22.1% | 25.4% |
| NRG | 12.8% | 2.6% | 4.1% | 23.8% | 18.8% | 9.8% |
| TLN | -4.8% | -4.9% | 0.9% | -12.8% | 42.1% | 15.6% |
| VST | 13.8% | 11.6% | 5.9% | 43.0% | 38.3% | 34.6% |
| EXC | 16.6% | 11.0% | 2.8% | 9.7% | 42.4% | 33.0% |
| DUK | 27.5% | 16.0% | 2.8% | 9.9% | 52.0% | 50.7% |
Source: Yahoo Finance
CEG’s gross margin of 22.1%, EBITDA margin of 25.4%, operating margin of 8.7%, and net margin of 11.1% sit below DUK’s 52.0%, 50.7%, 27.5%, and 16.0%, and below VST’s 38.3%, 34.6%, 13.8%, and 11.6%, while it is ahead of NRG on gross margin at 18.8% but behind on EBITDA margin at 9.8%. That pattern points to a scale and cost-of-revenue gap rather than a pure opex issue, because CEG’s gross margin is already well below the best peers before operating expenses are layered on. ROE of 15.1% and ROA of 3.9% are better than EXC’s 9.7% and 2.8%, but still below VST’s 43.0% and 5.9%, which tells me CEG is solid rather than exceptional on capital efficiency.
Leverage
| Company | Total Debt/Equity % (mrq) | Current Ratio (mrq) | Total Debt (mrq, USD Mil) | Operating Cash Flow TTM (USD Mil) | Free Cash Flow TTM (USD Mil) | Net Debt/EBITDA (TTM) | FCF Margin % (TTM) |
|---|---|---|---|---|---|---|---|
| CEG | 76.4 | 1.5 | 24,700 | 4,206 | -6,625.1 | 3 | -21.2% |
| NRG | 483.4 | 1 | 23,467 | 1,555 | 772.4 | 7.2 | 2.3% |
| TLN | 584.1 | 0.8 | 9,574 | 796 | 1,261.8 | 16.1 | 33.7% |
| VST | 373.3 | 1 | 20,508 | 5,121 | 37.1 | 3 | 0.2% |
| EXC | 177.4 | 1.1 | 52,673 | 7,212 | -2,685.1 | 6.1 | -10.6% |
| DUK | 162.2 | 0.7 | 92,206 | 11,562 | -4,477.4 | 5.5 | -13.7% |
Source: Yahoo Finance
CEG’s debt/equity is 76.4%, net debt/EBITDA is 3.0x, and FCF margin is -21.2%, versus NRG at 483.4%, 7.2x, and 2.3%, TLN at 584.1%, 16.1x, and 33.7%, VST at 373.3%, 3.0x, and 0.2%, EXC at 177.4%, 6.1x, and -10.6%, and DUK at 162.2%, 5.5x, and -13.7%. CEG’s leverage is materially lighter than the merchant power names on raw debt/equity, and its net debt/EBITDA is far more manageable than TLN’s and NRG’s, which tells me the balance sheet is a support rather than a constraint. The negative FCF margin still matters because it shows the company is funding growth and capital intensity ahead of cash conversion, so the leverage profile only works if operating cash flow keeps rising.
Conclusion
I would put my rating as a Hold because the bull case is credible, but the cash-flow proof is still incomplete. Constellation has a stronger moat after Calpine, and the 23.0% TTM revenue growth plus 94.7% nuclear capacity factor show that the platform is working operationally. What keeps me at Hold is that levered free cash flow is still -$6.6B TTM and net debt remains 3.0x EBITDA, so the enlarged business has not yet shown me that it can turn scale into durable cash generation.
I would raise my rating more towards a Buy if the combined business shows that the Calpine assets are lifting cash generation rather than just revenue, with levered free cash flow turning positive and operating margin moving materially above the current 8.7% as the $11.1B Q1 2026 revenue base normalizes. If EBITDA held near the $3.1B Q1 2026 level for several quarters, that would imply roughly $12.4B of annualized EBITDA, which would materially improve deleveraging and make the current 3.0x net debt to EBITDA look much more comfortable. I would also want to see the $3.5B of remaining repurchase authority used only after that cash conversion is visible, because buybacks before free cash flow inflects would add financial risk rather than reduce it.
I would move from Hold to Sell if the Calpine integration fails to translate into cleaner earnings and the company keeps funding growth with negative free cash flow while leverage stays near 3.0x or rises further. A second warning sign would be operating margin slipping back toward the high single digits while the $5.7B 2026 capital spending plan and the $4.7B 2027 plan continue to absorb cash, because that would mean the larger fleet is not earning its cost of capital. If the market starts to question the earnings bridge and the stock cannot hold above the 200-day moving average of $290.4, I would see that as a sign the current valuation is too dependent on hope rather than proof.
Weighing both sides, I lean to Hold because the bull case is real but still needs several quarters of execution before it earns a higher rating. The business is better positioned than it was before Calpine, yet the cash-flow gap is still too wide for me to call it a Buy today.
What to Watch Next
- Levered free cash flow turning positive — would support a move toward Buy.
- Operating margin moving above 8.7% — would show the larger fleet is absorbing costs better.
- EBITDA staying near $3.1B for several quarters — would strengthen deleveraging.
- Net debt/EBITDA staying near 3.0x or lower — would keep balance-sheet risk contained.
- The stock holding above the 200-day moving average of $290.4 — would suggest the market is regaining confidence.
What’s your take? I rated Constellation Energy (CEG) HOLD above — but the goal here is to get this right, not just to publish an opinion. What would you add to this analysis, or which risk or catalyst do you think I’m under- or over-weighting? Tell me in the comments.
Sources
- SEC 10-K Annual Report — filed 2026-02-24
- SEC 8-K Filing (2026-06-02)
- SEC 8-K Filing (2026-05-11)
- SEC 8-K Filing (2026-05-01)
- SEC 8-K Filing (2026-03-31)
- SEC 8-K Filing (2026-03-26)
- SEC 8-K Filing (2026-03-20)
- SEC Form 4 Insider Transaction (2026-04-30)
- SEC Form 4 Insider Transaction (2026-04-30)
- SEC Form 4 Insider Transaction (2026-04-30)
- SEC 10-K Annual Report — FY2026
- SEC 10-K Annual Report — FY2025
- SEC 10-K Annual Report — FY2024
- SEC 10-K Annual Report — FY2023
- SEC 10-K Annual Report — FY2022
Data sourced from Yahoo Finance and SEC EDGAR. Not investment advice.
Leave a Comment