
Executive Summary
Rating: HOLD | SAP
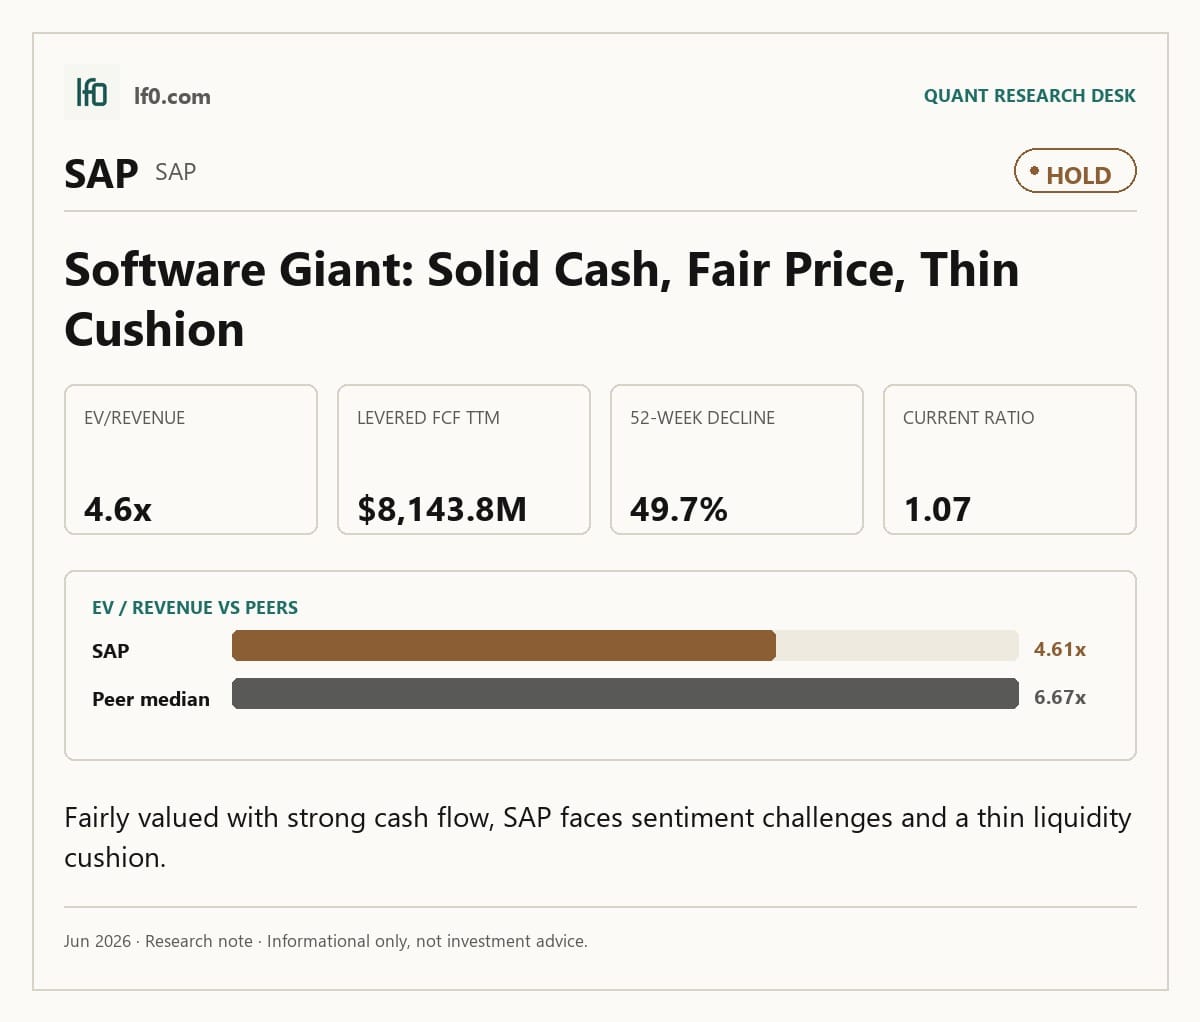
I would put my rating as a Hold because SAP is still producing 30.0% TTM operating margin and $8,143.8M of levered free cash flow, but the stock already trades at 4.6x EV/revenue and 15.8x forward P/E. In my view, that leaves the shares fairly valued for a mature software franchise rather than obviously cheap. I would raise my rating toward Buy if SAP can keep revenue growth above 6.0% and sustain EBITDA growth ahead of sales for another two quarters, because that would tell me the margin expansion is durable rather than a one-quarter lift.
Company Profile
SAP develops enterprise application software for finance, supply chain, procurement, human capital management, and customer operations. The company sells primarily through subscription and software-related services, which gives it a recurring revenue base and makes retention and upsell more important than one-time license wins. Its scale matters because large customers tend to standardize on a core platform and then add modules over time, which supports long customer lives and high switching costs.
Economic Moat
Business Model
SAP’s moat comes from workflow depth, integration, and switching costs. Once a customer runs core finance or supply-chain processes on SAP, replacing that stack is expensive, operationally risky, and disruptive to the business. That is why the company can keep 30.0% operating margin while still growing revenue at a mid-single-digit pace: the installed base is sticky enough to support pricing and cross-sell.
Business & Operating Risks
The main disclosed risks are execution risk in cloud migration, customer concentration in large enterprise accounts, and the complexity of moving legacy users onto newer products without disrupting service. Those risks matter because SAP’s moat depends on keeping the installed base intact while it shifts customers to cloud offerings. If migration slows or customers delay upgrades, the moat does not disappear, but it becomes less monetizable.
Management Discussion & Analysis
Management’s emphasis has been on disciplined growth and cash generation rather than aggressive expansion. That tone fits a company with a mature moat: SAP is trying to deepen monetization of existing customers, not chase growth at the expense of margin. I read that as constructive, because it suggests management is protecting the quality of the franchise instead of stretching the model.
Recent Earnings
In Q1 2026, revenue was $9,555M and EBITDA was $3,343M, both above the year-earlier levels of $9,013M and $3,097M. The more important point for me is that EBITDA grew faster than revenue, which tells me the business is still extracting operating leverage from its installed base. That supports the moat, but the quarter also needs follow-through before I would call it a new run rate.
Financial Analysis
Growth
SAP — Financial Growth (Quarterly, USD Mil)
| Metric | 2025-03-31 | 2025-06-30 | 2025-09-30 | 2025-12-31 | 2026-03-31 |
|---|---|---|---|---|---|
| REVENUE (USD Mil) | 9,013 | 9,027 | 9,076 | 9,684 | 9,555 |
| EBIT (USD Mil) | 2,748 | 2,770 | 3,057 | 2,188 | 3,038 |
| EBITDA (USD Mil) | 3,097 | 3,089 | 3,375 | 2,513 | 3,343 |
| NET INCOME (USD Mil) | 1,780 | 1,697 | 2,004 | 1,680 | 1,932 |
| DILUTED EPS | 1.5 | 1.4 | 1.7 | 1.6 | 1.6 |
Source: Yahoo Finance — Quarterly Financial Statements
SAP’s revenue rose from $9,013M in Q1 2025 to $9,555M in Q1 2026, a 6.0% increase. EBITDA climbed 8.0% over the same period, from $3,097M to $3,343M, which is the better signal because it shows earnings are growing faster than sales. I do not read the Q4 2025 spike and Q1 2026 pullback as a broken trend; I read them as a reminder that this business is steady rather than linear.
Profitability
SAP — Profitability (TTM)
| Metric | TTM |
|---|---|
| Operating Margin (TTM) | 30.0% |
| Net Margin (TTM) | 19.6% |
| Return on Assets (TTM) | 9.1% |
| Return on Equity (TTM) | 16.4% |
Source: Yahoo Finance — Trailing Twelve Months (TTM)
TTM operating margin was 30.0%, net margin 19.6%, ROA 9.1%, and ROE 16.4%. Those are strong absolute returns, even if they do not match the very best software names. The key takeaway is that SAP is already converting scale into profit, so the thesis depends more on sustaining that margin base than on dramatic top-line acceleration.
Valuation
SAP — Valuation Multiples
| Metric | Value |
|---|---|
| Market Cap (USD Mil) | 181,154.7 |
| Enterprise Value (USD Mil) | 172,202.1 |
| Trailing P/E | 21.5 |
| Forward P/E | 15.8 |
| Price/Sales (TTM) | 4.9 |
| Price/Book (mrq) | 3.4 |
| EV/Revenue | 4.6 |
| EV/EBITDA | 14.8 |
| Beta (5Y Monthly) | 0.7 |
Source: Yahoo Finance
SAP trades at 4.6x EV/revenue, 14.8x EV/EBITDA, 21.5x trailing P/E, and 15.8x forward P/E. That is not a distressed multiple, but it is also not a growth-stock extreme, especially for a company with 30.0% operating margin and 8.0% EBITDA growth in the latest quarter. In my view, the market is paying for quality and cash generation, not for a sharp re-rating.
Relative to peers, SAP’s 4.6x EV/revenue sits above ACN at 1.0x and CRM at 3.6x, but below MSFT at 8.7x, ORCL at 9.3x, and NOW at 6.7x. That mix is why I do not call the stock obviously expensive: SAP is priced richer than the slower, lower-multiple names, yet it still trades at a discount to the highest-growth software platforms. The one-year return also matters here. A $1 investment a year ago would be worth about $0.5 after SAP’s -47.7% total return, which tells me sentiment has already done a lot of the de-rating work. The stock can recover from here, but only if earnings keep proving out.
Leverage
SAP — Leverage & Coverage (Quarterly)
| Metric | Value |
|---|---|
| Total Debt/Equity % (mrq) | 1,733.1% |
| Current Ratio (mrq) | 1.1 |
| Total Debt (mrq, USD Mil) | 7,862 |
| Operating Cash Flow (TTM, USD Mil) | 8,889 |
| Levered Free Cash Flow (TTM, USD Mil) | 8,143.8 |
Source: Yahoo Finance — Quarterly Financial Statements
SAP’s total debt/equity is 1,733.1%, current ratio is 1.1, total debt is $7,862M, operating cash flow is $8,889M, and levered free cash flow is $8,143.8M. I would not call that a low-risk balance sheet, but I also would not call it strained: cash generation is comfortably above debt service needs, while liquidity is only modestly above the breakeven point of 1.0, meaning current assets just cover current liabilities. The balance sheet therefore supports the equity story, but it does not give much room for execution error.
Comparable Analysis
Growth
| Company | Revenue TTM (USD Mil) | Revenue Growth YoY % | EBITDA TTM (USD Mil) | Diluted EPS TTM |
|---|---|---|---|---|
| SAP | 37,342 | 6.0% | 11,604 | 7.2 |
| ACN | 73,100.6 | 5.6% | 12,943.8 | 12.5 |
| MSFT | 318,273 | 18.3% | 184,457 | 16.8 |
| ORCL | 67,357 | 20.6% | 31,738 | 5.8 |
| CRM | 42,829 | 13.3% | 12,895 | 8.6 |
| NOW | 13,960 | 22.1% | 2,888 | 1.7 |
Source: Yahoo Finance
SAP’s 6.0% revenue growth on a $37,342M TTM base trails MSFT at 18.3%, ORCL at 20.6%, CRM at 13.3%, and NOW at 22.1%, while ACN is close at 5.6%. That puts SAP in the middle of the group: respectable, but not the fastest-growing name in the set. In my view, the market is not paying SAP for growth leadership; it is paying for consistency and scale.
Valuation
| Company | Trailing P/E | Forward P/E | EV/Revenue | EV/EBITDA | Price/Sales (TTM) | Price/Book (mrq) | Market Cap (USD Mil) | Enterprise Value (USD Mil) | Beta (5Y Monthly) |
|---|---|---|---|---|---|---|---|---|---|
| SAP | 21.5 | 15.8 | 4.6 | 14.8 | 4.9 | 3.4 | 181,154.7 | 172,202.1 | 0.7 |
| ACN | 10.1 | 8.6 | 1 | 5.9 | 1.1 | 2.4 | 77,049.6 | 76,223.1 | 1.1 |
| MSFT | 22.4 | 19.4 | 8.7 | 15 | 8.8 | 6.7 | 2,788,226 | 2,775,965.2 | 1.1 |
| ORCL | 29.6 | 15.8 | 9.3 | 19.8 | 7.4 | 14.8 | 496,117.9 | 628,146.4 | 1.7 |
| CRM | 17.6 | 9.8 | 3.6 | 11.9 | 2.9 | 3.6 | 124,393.8 | 153,659.3 | 1.2 |
| NOW | 57 | 19 | 6.7 | 32.3 | 7.1 | 8.4 | 98,747.7 | 93,171 | 0.9 |
Source: Yahoo Finance
SAP’s 4.6x EV/revenue and 21.5x trailing P/E sit well above ACN’s 1.0x and 10.1x, and above CRM’s 3.6x and 17.6x, but below MSFT’s 8.7x and 22.4x, ORCL’s 9.3x and 29.6x, and NOW’s 6.7x and 57.0x. That spread is important because SAP’s valuation is not detached from peers, but it is also not a bargain relative to its own growth rate. The one-year total return of -47.7% is a useful cross-check: the market has already punished the stock, yet the multiple still assumes SAP keeps delivering stable earnings.
Profitability
| Company | Operating Margin (TTM) | Net Margin (TTM) | Return on Assets (TTM) | Return on Equity (TTM) |
|---|---|---|---|---|
| SAP | 30.0% | 19.6% | 9.1% | 16.4% |
| ACN | 17.0% | 10.7% | 10.9% | 24.4% |
| MSFT | 46.3% | 39.3% | 14.8% | 34.0% |
| ORCL | 36.3% | 25.4% | 6.5% | 53.4% |
| CRM | 21.8% | 18.7% | 5.7% | 16.9% |
| NOW | 13.3% | 12.6% | 5.7% | 16.1% |
Source: Yahoo Finance
SAP’s 30.0% operating margin and 19.6% net margin are stronger than ACN, CRM, and NOW, but below MSFT and ORCL. ROE of 16.4% and ROA of 9.1% are solid, though not best-in-class. The combination of decent profitability and a mid-pack valuation is why I see SAP as a quality compounder rather than a clear mispricing.
Leverage
| Company | Total Debt/Equity % (mrq) | Current Ratio (mrq) | Total Debt (mrq, USD Mil) | Operating Cash Flow TTM (USD Mil) | Free Cash Flow TTM (USD Mil) |
|---|---|---|---|---|---|
| SAP | 1,733.1% | 1.1 | 7,862 | 8,889 | 8,143.8 |
| ACN | 2,503.5% | 1.3 | 8,388.8 | 13,182.1 | 12,089.4 |
| MSFT | 3,027.1% | 1.3 | 125,432 | 170,141 | 37,011.2 |
| ORCL | 36,275.8% | 1.1 | 156,189 | 31,977 | -20,337.9 |
| CRM | 12,428.2% | 0.8 | 42,548 | 15,221 | 16,553 |
| NOW | 2,072.8% | 0.8 | 2,431 | 5,437 | 5,108.1 |
Source: Yahoo Finance
SAP’s 1,733.1% debt/equity is lower than ORCL’s 36,275.8% and CRM’s 12,428.2%, and its 1.1 current ratio matches ORCL while staying above CRM and NOW at 0.8. More importantly, SAP’s $8,143.8M of free cash flow is strong relative to its $7,862M of debt, which gives the company more flexibility than the raw leverage ratio suggests. That is one reason SAP can trade at a premium to ACN and CRM without looking stretched on balance-sheet risk alone.
Conclusion
I would put my rating as a Hold because SAP has already proven it can generate strong cash flow and maintain 30.0% operating margin, but the current valuation still asks investors to pay for that quality up front. The stock is not cheap enough for me to call it a Buy, yet the business is too profitable and too cash generative for me to argue for a Sell.
I would raise my rating toward Buy if SAP can keep quarterly revenue growth above 6.0% while EBITDA continues to grow faster than sales, because that would show the margin base is still expanding rather than merely holding. I would also become more constructive if net margin moves closer to operating margin, since that would mean less below-the-line drag and a cleaner earnings stream. On the downside, I would move from Hold to Sell if revenue growth falls into the low-single-digit range for two straight quarters or if the current ratio slips below 1.0, because that would tell me the growth engine is slowing while liquidity is getting tighter. A material drop in free cash flow from the current $8,143.8M TTM level would be another clear warning sign.
After weighing both paths, I still lean Hold. The upside case depends on SAP proving that Q1 2026 was the start of a steadier earnings trend, while the downside case requires a more obvious deterioration in growth or cash generation. For now, the numbers support patience rather than urgency.
What’s your take? I rated SAP (SAP) HOLD above — but the goal here is to get this right, not just to publish an opinion. What would you add to this analysis, or which risk or catalyst do you think I’m under- or over-weighting? Tell me in the comments.
Data sourced from Yahoo Finance. Not investment advice.
Leave a Reply