
| Company | Aug 25 | Sep 25 | Oct 25 | Nov 25 | Dec 25 | Jan 26 | Feb 26 | Mar 26 | Apr 26 | May 26 | Jun 26 | Jul 26 | 12-Mo |
|---|---|---|---|---|---|---|---|---|---|---|---|---|---|
| LUV | +6% | -2% | -5% | +15% | +19% | +15% | +4% | -23% | +1% | +13% | +20% | -13% | +48% |
| RYAAY | +2% | -4% | +4% | +9% | +6% | -2% | -4% | -14% | -5% | +11% | +7% | -10% | -5% |
| ICAGY | +3% | +1% | +6% | -3% | +5% | +3% | +0% | -16% | +7% | +14% | +10% | -8% | +20% |
| UAL | +19% | -8% | -3% | +8% | +10% | -8% | +4% | -13% | -2% | +28% | +18% | -11% | +37% |
| DAL | +16% | -8% | +1% | +12% | +8% | -5% | -0% | +1% | +2% | +22% | +14% | -6% | +66% |
| AAL | +16% | -16% | +17% | +7% | +9% | -13% | -2% | -18% | +9% | +25% | +23% | -15% | +33% |
Source: Yahoo Finance monthly adjusted close.
Quick Thesis
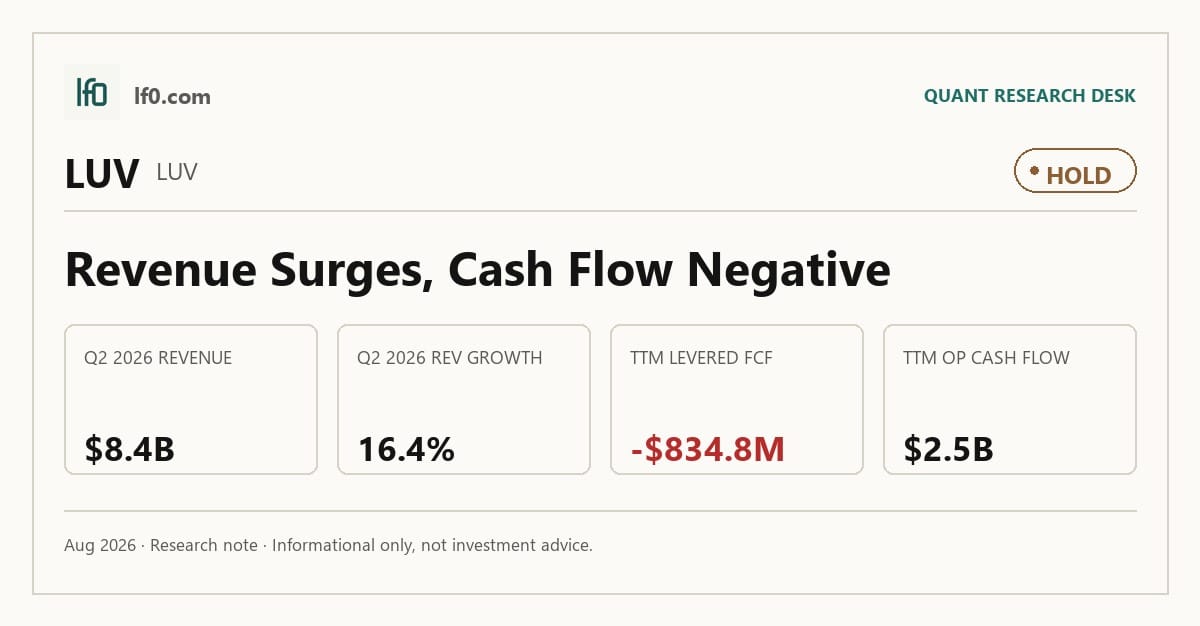
- Rated hold — Southwest is mid-reset, but cash conversion is still negative.
- Strongest point: $2.5B of TTM operating cash flow.
- Biggest risk: -$834.8M of TTM levered free cash flow and a 0.49x current ratio.
- Valuation is mixed: 10.7x EV/EBITDA and 0.8x EV/revenue.
- I would turn more constructive if free cash flow turns positive and net debt/EBITDA stays near 1.3x.
Executive Summary
Rating: HOLD | LUV
Measured from adjusted close on 2026-08-14 to 2026-09-25. Sell ratings are correct when the stock falls; Hold is tracked as a +/-10% range. Daily-close data, not intraday. Calls are tracked for 182 days from publication, then frozen as a final record.
I would put my rating as a Hold because Southwest has improved revenue and is monetizing the network better, but the company still has not converted that reset into positive free cash flow. In my view, the key strength is the $2.5B of TTM operating cash flow, which shows the franchise still generates cash even as the product changes. The key risk is -$834.8M of TTM levered free cash flow, because that tells me the airline is still funding too much of the recovery with external capital rather than internal cash. I would become more constructive if free cash flow turns positive and operating margin stays above 3.38% for several quarters, since that would show the new pricing model is actually funding the airline.
Company Profile
Southwest Airlines Co. operates Southwest Airlines, a scheduled passenger carrier in the United States and near international markets. It earns revenue from passenger tickets, ancillary fees, loyalty program activity, and vacation packages. Founded in 1967 and launched on June 18, 1971 with 3 Boeing 737 aircraft serving Dallas, Houston, and San Antonio, it has built a single-fleet model around the Boeing 737. As of December 31, 2025, Southwest had 803 Boeing 737 aircraft and served 117 destinations across 42 states, Puerto Rico, and 10 near international countries. The company is listed on the New York Stock Exchange under LUV.
In 2025 and early 2026, Southwest began assigned and extra legroom seating, added bag fees on most fares, launched Getaways by Southwest, opened international carrier partnerships, and expanded redeye flying and new 2026 destinations. Those changes matter because they widen the revenue base, but they do not by themselves create a durable moat.
Economic Moat
Business Model
Southwest’s most defensible advantage is its point-to-point network built around secondary and downtown airports. That structure supports more nonstop service, higher aircraft utilization, and less ground time than a hub-and-spoke model, and I feel that is hard for a well-funded competitor to copy quickly because it depends on airport access, schedule design, and fleet commonality working together. A single fleet type, the Boeing 737, also simplifies scheduling, maintenance, training, and safety management, while Rapid Rewards still lets members redeem points on every available seat, every day, with no blackout dates.
The company is trying to widen that edge with assigned seating, extra legroom, and international interline partnerships with Icelandair, China Airlines, EVA Air, Philippine Airlines, Condor, and Turkish Airlines. I see those as execution steps rather than durable barriers, but they do make the network more monetizable. The move from 805 nonstop city pairs in 2023 to 871 in 2025 also shows the network is still expanding, which supports the moat thesis even if it does not fully transform it.
Business & Operating Risks
The most material disclosed risk is Boeing dependence, because Southwest is currently dependent on Boeing as the sole manufacturer of its aircraft. If the MAX family were to become unavailable, or if the company could not procure future aircraft in a timely manner or on favorable commercial terms, business plans and results could be materially and adversely affected. That risk strikes at the network model itself: if aircraft deliveries slip, Southwest has less room to grow capacity or rework the schedule around new product features.
Labor cost inflation is the next pressure point. Approximately 84.0% of employees were represented by labor unions as of December 31, 2025, and salaries, wages, and benefits represented about 47.0% of operating expenses for 2025. Fuel is also a live risk now that Southwest terminated its remaining fuel hedge positions in second quarter 2025 and does not intend to add new derivatives; jet fuel and oil represented about 19.0% of operating expenses for 2025. Technology risk has become more visible too, because the company is heavily dependent on technology and is expanding its use of AI and machine learning, which raises outage and compliance risk.
Taken together, these risks do not break the moat, but they do make the point-to-point model harder to defend at the margin because the cost base and fleet pipeline can erode the advantage if execution slips.
Management Discussion & Analysis
Management is responding to those risks, but not all of them are solved. The company cut 1,750 roles, or 15.0% of corporate positions, and expects about $310M of 2026 savings, which is a direct response to cost pressure. It also shifted the product mix with bag fees, a Basic fare, assigned and extra legroom seating, new online travel agency partnerships, and Getaways by Southwest, all aimed at lifting revenue per passenger rather than adding capacity.
The numbers show progress, but not enough to declare victory. 2025 operating revenues rose to $28.1B and passenger revenue increased to $25.5B, yet operating expenses excluding fuel and profit sharing still rose 3.1% per available seat mile. That tells me the commercial reset is working faster than the cost reset, which is why the margin story still feels incomplete. Southwest also returned $2.9B to shareholders in 2025 through dividends and accelerated share repurchases, then committed another $750M in January 2026 and $400M in the first quarter of 2026. I read that as confidence in cash generation, but it also means management is leaning on capital returns before the balance sheet is fully repaired.
Recent Events
The March 11, 2026 term loan added $500M of senior secured debt and gave Southwest a $500M incremental capacity feature. That strengthens liquidity, but it also adds collateralized leverage, so the recovery is being financed more than self-funded. The May 19, 2026 Increase Joinder pushed the term loan stack to $1.5B and expanded incremental borrowing capacity to $1B, which reinforces the same point: management is preserving flexibility, but it is doing so with secured financing rather than operating cash alone.
Governance changes were less important. Two directors, C. David Cush and Gregg A. Saretsky, resigned effective February 23, 2026, and the May 7, 2026 annual meeting re-elected the board while approving pay and auditor ratification. I view that as neutral for the moat thesis.
Financial Analysis
Growth
LUV — Financial Growth (Quarterly, USD Mil)
| Metric | 2025-06-30 | 2025-09-30 | 2025-12-31 | 2026-03-31 | 2026-06-30 |
|---|---|---|---|---|---|
| REVENUE (USD Mil) | 7,244 | 6,949 | 7,442 | 7,249 | 8,432 |
| EBIT (USD Mil) | 306 | 90 | 439 | 327 | 358 |
| EBITDA (USD Mil) | 706 | 484 | 810 | 725 | 760 |
| NET INCOME (USD Mil) | 213 | 54 | 323 | 227 | 233 |
| DILUTED EPS | 0.4 | 0.1 | 0.6 | 0.5 | 0.5 |
Source: Yahoo Finance — Quarterly Financial Statements
Revenue was $7.24e+03M in Q2 2025, $6.95e+03M in Q3 2025, $7.44e+03M in Q4 2025, $7.25e+03M in Q1 2026, and $8.43e+03M in Q2 2026. The Q2 2026 figure was up 16.4% year over year, which is a meaningful step-up and consistent with the pricing and product changes management has been pushing. EBITDA rose more slowly, from $706M in Q2 2025 to $760M in Q2 2026, so the top line is improving faster than the earnings base.
That gap matters because it shows the network reset is helping revenue before it is fully helping profit. In other words, Southwest is gaining commercial traction, but the margin bridge still has to close before growth becomes a stronger equity story.
Profitability
LUV — Profitability (TTM)
| Metric | TTM |
|---|---|
| Operating Margin (TTM) | 3.4% |
| Net Margin (TTM) | 2.8% |
| Return on Assets (TTM) | 2.3% |
| Return on Equity (TTM) | 11.1% |
| Gross Margin (TTM) | 22.4% |
| EBITDA Margin (TTM) | 7.8% |
Source: Yahoo Finance — Trailing Twelve Months (TTM)
TTM operating margin was 3.38%, net margin was 2.78%, gross margin was 22.4%, EBITDA margin was 7.77%, ROA was 2.32%, and ROE was 11.1%. The spread between gross margin and operating margin is 19.0 percentage points, which tells me the airline still carries a heavy operating cost base even after the revenue reset. EBITDA margin above operating margin by 4.4 points shows depreciation and amortization are meaningful, but the larger issue is that core airline economics are still only modestly profitable after fixed costs.
ROA of 2.3% versus ROE of 11.1% shows leverage is amplifying returns more than asset efficiency is. That is acceptable for now, but I would want ROA moving closer to the mid-single digits before treating the return profile as durable. The moat described above is showing up in the numbers only partially: the network is still generating cash, but not yet at a level that would justify a premium profitability view.
Valuation
LUV — Valuation Multiples
| Metric | Value |
|---|---|
| Market Cap (USD Mil) | 21,809 |
| Enterprise Value (USD Mil) | 25,049 |
| Trailing P/E | 27.9 |
| Forward P/E | 9 |
| Price/Sales (TTM) | 0.7 |
| Price/Book (mrq) | 3.1 |
| EV/Revenue | 0.8 |
| EV/EBITDA | 10.7 |
| Beta (5Y Monthly) | 1.14 |
| FCF Yield % (TTM) | -3.8% |
| Forward EPS (USD) | 4.9 |
| Analyst Target Price – Low (USD) | 35 |
| Analyst Target Price – Mean (USD) | 51.8 |
| Analyst Target Price – High (USD) | 67 |
| # Analyst Opinions | 23 |
Source: Yahoo Finance
Southwest trades on a mixed valuation profile. EV/revenue is 0.833x and EV/EBITDA is 10.7x, which tells me the market is pricing in some margin recovery but not a full rerating. Trailing P/E is 27.9x, while forward P/E falls to 9.01x on forward EPS of 4.95, so the market is clearly looking through a weak trailing earnings base and underwriting a cleaner 2026 profit profile. FCF yield is -3.83%, which is the clearest reminder that cash conversion is still lagging the revenue reset.
On the analysis here, I would put fair value in a range of about $31-$102 per share based on peer EV/revenue and Southwest’s own net debt load. That range is wide because the airline’s leverage and cash conversion still leave room for very different outcomes. The analyst consensus is $35-$67 from 23 opinions, so my range sits mostly around and above the published mean of 51.8; I am not more bullish than consensus on the cash flow path, but I am also not willing to price the stock as if the recovery has already fully worked.
Forward EPS of 4.95 is only slightly below RYAAY’s $4.9 and well below DAL’s $8.9 and UAL’s $15.5, which tells me Southwest’s earnings power is not peer-leading even if the multiple is not demanding. On a like-for-like basis, that makes the stock look fair rather than cheap: the market is paying for a steadier franchise and cleaner balance sheet than some peers, not for superior earnings growth. The valuation case therefore lines up with the rest of the article — the stock is not expensive on sales, but the cash flow gap keeps me from calling it outright cheap.
Leverage
LUV — Leverage & Coverage (Quarterly)
| Metric | Value |
|---|---|
| Total Debt/Equity % (mrq) | 97.3 |
| Current Ratio (mrq) | 0.5 |
| Total Debt (mrq, USD Mil) | 6,889 |
| Operating Cash Flow (TTM, USD Mil) | 2,528 |
| Levered Free Cash Flow (TTM, USD Mil) | -834.8 |
| Net Debt/EBITDA (TTM) | 1.3 |
| FCF Margin % (TTM) | -2.8% |
Source: Yahoo Finance — Quarterly Financial Statements
Southwest carries $6889B of total debt, with total debt/equity of 97.28% and a current ratio of 0.489x, so the balance sheet is levered and near-term liquidity is tight. Net debt/EBITDA of 1.325x shows debt is still manageable on an earnings basis, but levered free cash flow of -$834.8M TTM and FCF margin of -2.78% mean EBITDA is not converting cleanly into cash. Operating cash flow of $2528B is solid, yet most of that is absorbed by capex and other cash uses, which leaves limited room to absorb a shock without leaning on the balance sheet.
That is why I view the leverage profile as a real constraint on the thesis. The company can carry this debt load if margins keep improving, but the current ratio and negative free cash flow mean the recovery has to arrive in the numbers, not just in the narrative.
Insider Activity
The insider transaction record I see here is net buying, with 26 open-market purchases totaling $937,418 versus 1 open-market sale totaling $4,478 over 2025-01-30 to 2026-05-07. The activity is broad rather than concentrated, because multiple insiders bought while only one director sold, which points to alignment between management and shareholders. I view that as a modest positive, not a thesis driver.
Comparable Analysis
Growth
| Company | Revenue TTM (USD Mil) | Revenue Growth YoY % | EBITDA TTM (USD Mil) | Diluted EPS TTM |
|---|---|---|---|---|
| LUV | 30,073 | 16.4% | 2,338 | 1.6 |
| RYAAY | 15,590.8 | 1.1% | 3,421.6 | 4.1 |
| ICAGY | 33,371 | 0.2% | 6,357 | 1.5 |
| UAL | 62,902 | 16.0% | 7,091 | 10.7 |
| DAL | 68,287 | 18.7% | 7,507 | 6.1 |
| AAL | 58,337 | 16.3% | 3,372 | -0.5 |
Source: Yahoo Finance
Southwest’s revenue grew 16.4% TTM, which matches UAL at 16.0% and AAL at 16.3%, while DAL was a bit faster at 18.7% and RYAAY and ICAGY were far slower at 1.1% and 0.2%. That puts LUV in the middle of the U.S. airline pack on top-line momentum, so the growth premium is justified versus the European carriers but not enough to support a premium over DAL on growth alone.
Valuation
| Company | Trailing P/E | Forward P/E | EV/Revenue | EV/EBITDA | Price/Sales (TTM) | Price/Book (mrq) | Market Cap (USD Mil) | Enterprise Value (USD Mil) | Beta (5Y Monthly) | FCF Yield % (TTM) | Forward EPS | Analyst Target Price – Low | Analyst Target Price – Mean | Analyst Target Price – High | # Analyst Opinions |
|---|---|---|---|---|---|---|---|---|---|---|---|---|---|---|---|
| LUV | 27.9 | 9 | 0.8 | 10.7 | 0.7 | 3.1 | 21,809 | 25,049 | 1.14 | -3.8% | 4.9 | 35 | 51.8 | 67 | 23 |
| RYAAY | 14.2 | 12 | 1.8 | 8.2 | 2 | 2.8 | 30,489 | 28,123 | 0.96 | -0.7% | 4.9 | 67.5 | 74.4 | 78 | 5 |
| ICAGY | 8.2 | 6.2 | 0.9 | 4.9 | 0.8 | 2.7 | 26,573 | 31,142 | 1.32 | 4.1% | 1.9 | 13.5 | 14.6 | 15.3 | 3 |
| UAL | 11.7 | 8.1 | 0.9 | 8.2 | 0.6 | 2.4 | 40,626 | 58,042 | 1.29 | 2.2% | 15.5 | 102 | 162.2 | 205 | 23 |
| DAL | 14.6 | 10.1 | 1.1 | 10.1 | — | 2.7 | 58,917 | 76,142 | 1.31 | 4.8% | 8.9 | 50 | 105.5 | 125 | 24 |
| AAL | — | 6 | 0.6 | 11.1 | 0.2 | -2.5 | 9,847 | 37,337 | 1.35 | 5.3% | 2.5 | 10.3 | 19 | 25 | 23 |
Source: Yahoo Finance
LUV’s EV/revenue of 0.8x is below RYAAY’s 1.8x and DAL’s 1.1x, yet its forward EPS of 4.9 is only slightly above RYAAY’s 4.9 and below DAL’s 8.9 and UAL’s 15.5. That combination tells me the market is paying for a cleaner balance sheet and steadier franchise rather than superior earnings power. Using peer EV/revenue of 0.6x to 1.8x on LUV’s $30.1B TTM revenue implies an enterprise value of about $19.3B to $54.2B, or roughly $31.1 to $102.0 per share after netting $3.1B of net debt and dividing by 489.2M shares.
The stock’s one-year total return of 47.6% is strong, but DAL at 55.4% has done better and UAL at 26.6% has also rerated well, so LUV has not been the standout rerating name in the group. I think that matters because the market is not paying a growth premium for Southwest; it is rewarding the company for stability, and that is a different thing.
Profitability
| Company | Operating Margin (TTM) | Net Margin (TTM) | Return on Assets (TTM) | Return on Equity (TTM) | Gross Margin (TTM) | EBITDA Margin (TTM) |
|---|---|---|---|---|---|---|
| LUV | 3.4% | 2.8% | 2.3% | 11.1% | 22.4% | 7.8% |
| RYAAY | 13.1% | 12.1% | 7.0% | 22.4% | 27.9% | 21.9% |
| ICAGY | 16.1% | 9.2% | 7.0% | 42.1% | 38.3% | 19.1% |
| UAL | 5.5% | 5.6% | 3.4% | 23.3% | 31.8% | 11.3% |
| DAL | 7.9% | 5.8% | 4.0% | 20.1% | 18.7% | 11.0% |
| AAL | 2.8% | -0.6% | 1.1% | — | 21.2% | 5.8% |
Source: Yahoo Finance
LUV’s gross margin of 22.4%, EBITDA margin of 7.8%, operating margin of 3.4%, and net margin of 2.8% all sit below ICAGY’s 38.3%, 19.1%, 16.1%, and 9.2%, and below DAL’s 18.7%, 11.0%, 7.9%, and 5.8% on the operating line. The gap looks more structural than cyclical because LUV’s margins are closer to AAL’s 21.2% gross margin and 5.8% EBITDA margin than to DAL’s, which implies a weaker cost base rather than a temporary quarter-specific issue.
ROE of 11.1% and ROA of 2.3% also trail the stronger peers, so the return profile is not best in class. That is important because the valuation multiple is not low enough to ignore the profitability gap.
Leverage
| Company | Total Debt/Equity % (mrq) | Current Ratio (mrq) | Total Debt (mrq, USD Mil) | Operating Cash Flow TTM (USD Mil) | Free Cash Flow TTM (USD Mil) | Net Debt/EBITDA (TTM) | FCF Margin % (TTM) |
|---|---|---|---|---|---|---|---|
| LUV | 97.3 | 0.5 | 6,889 | 2,528 | -834.8 | 1.3 | -2.8% |
| RYAAY | 1.9 | 0.8 | 181.9 | 3,440.1 | -217.7 | -0.8 | -1.4% |
| ICAGY | 160.7 | 0.8 | 13,867 | 6,997 | 1,088.8 | 0.7 | 3.3% |
| UAL | 201.6 | 0.8 | 33,668 | 8,913 | 910.1 | 2.4 | 1.5% |
| DAL | 96.6 | 0.4 | 21,084 | 8,134 | 2,817.4 | 2.2 | 4.1% |
| AAL | — | 0.5 | 35,729 | 4,374 | 519.2 | 8.1 | 0.9% |
Source: Yahoo Finance
LUV’s debt/equity is 97.3% and net debt/EBITDA is 1.3x, which is heavier than ICAGY’s 0.7x and RYAAY’s net cash position of -0.8x, but lighter than UAL’s 2.4x and AAL’s 8.1x. The more important tell is FCF margin of -2.8% and free cash flow of -$834.8M TTM, which means the balance sheet is still funding the business rather than being funded by it.
That leverage profile also explains part of the valuation spread. Investors are willing to pay more for names with stronger cash generation or lower balance-sheet risk, so Southwest’s 0.8x EV/revenue is not a bargain in isolation; it is a compromise between growth, leverage, and cash conversion.
Conclusion
I would put my rating as a Hold because Southwest’s revenue reset is real, but the cash conversion still is not. Revenue reached $8.43e+03M in Q2 2026 and forward EPS is 4.95, which tells me the commercial pivot is working, yet levered free cash flow remains -$834.8M TTM and the current ratio is only 0.489x. That tension is the whole case: the network is improving, but the balance sheet still leaves little room for error.
I would raise my rating more toward a Buy if operating margin can hold above 3.0% for two to three straight quarters and free cash flow turns positive, because that would show the bag fees, assigned seating, and cost cuts are translating into cash rather than just revenue. On the current revenue base, moving EBITDA margin from 7.8% to 10.0% would add roughly $660M of annual EBITDA, which would materially improve the deleveraging path and make the current 1.3x net debt to EBITDA look safer. I would also want to see the current ratio move closer to 1.0x, meaning current assets would more comfortably cover current liabilities, before I treated the balance sheet as self-funding.
I would move from Hold to Sell if revenue slips back below $7.2B in a quarter while fuel and labor costs keep rising, because that would tell me the 2025 pricing actions are not durable enough to offset the company’s fixed cost base. A second warning sign would be a return to negative operating cash flow after the 2026 cost savings are supposed to land, since that would mean the business is still funding itself with debt rather than with earnings. If Boeing delays also start to constrain capacity again, the network advantage described above would be harder to monetize and the thesis would weaken faster.
Weighing both sides, I think the bull case is real but not yet proven enough to justify a Buy, while the bear case needs only one or two weak quarters to reassert itself. I lean Hold because Southwest has enough strategic change in place to avoid a bearish call, but not enough cash conversion yet to deserve a more constructive one.
What to Watch Next
- Operating margin above 3.0% for several quarters — would support a move toward Buy.
- Free cash flow turning positive — would show the reset is funding itself.
- EBITDA margin moving toward 10.0% — would improve the deleveraging path.
- Current ratio moving closer to 1.0x — would signal better short-term liquidity.
- Revenue slipping below $7.2B with rising fuel and labor costs — would push the rating toward Sell.
What’s your take? I rated Southwest Airlines (LUV) HOLD above — but the goal here is to get this right, not just to publish an opinion. What would you add to this analysis, or which risk or catalyst do you think I’m under- or over-weighting? Tell me in the comments.
Sources
- SEC 10-K Annual Report — filed 2026-02-05
- SEC 8-K Filing (2026-05-19)
- SEC 8-K Filing (2026-05-11)
- SEC 8-K Filing (2026-04-22)
- SEC 8-K Filing (2026-03-12)
- SEC 8-K Filing (2026-02-10)
- SEC 8-K Filing (2026-01-28)
- SEC Form 4 Insider Transaction (2026-05-11)
- SEC Form 4 Insider Transaction (2026-05-11)
- SEC Form 4 Insider Transaction (2026-05-11)
- SEC 10-K Annual Report — FY2026
- SEC 10-K Annual Report — FY2025
- SEC 10-K Annual Report — FY2024
- SEC 10-K Annual Report — FY2023
- SEC 10-K Annual Report — FY2022
Data sourced from Yahoo Finance and SEC EDGAR. Not investment advice.
Leave a Comment