| Company | Aug 25 | Sep 25 | Oct 25 | Nov 25 | Dec 25 | Jan 26 | Feb 26 | Mar 26 | Apr 26 | May 26 | Jun 26 | Jul 26 | 12-Mo |
|---|---|---|---|---|---|---|---|---|---|---|---|---|---|
| OSK | +11% | -7% | -5% | +4% | -2% | +14% | +19% | -13% | +6% | -16% | +18% | -7% | +14% |
| URI | +9% | -0% | -9% | -6% | -1% | -3% | +8% | -13% | +32% | +4% | +14% | -5% | +23% |
| STRL | +4% | +22% | +11% | -9% | -11% | +17% | +20% | -5% | +27% | +67% | -2% | -29% | +123% |
| TEX | -1% | +3% | -10% | +1% | +16% | +7% | +21% | -14% | +5% | -6% | +25% | -13% | +25% |
| AGCO | -8% | -1% | -4% | +3% | -2% | +9% | +21% | -15% | +4% | -7% | +7% | -15% | -13% |
| CNH | -12% | -5% | -3% | -10% | -2% | +17% | +14% | -11% | -3% | -4% | +10% | -9% | -20% |
Source: Yahoo Finance monthly adjusted close.
Quick Thesis
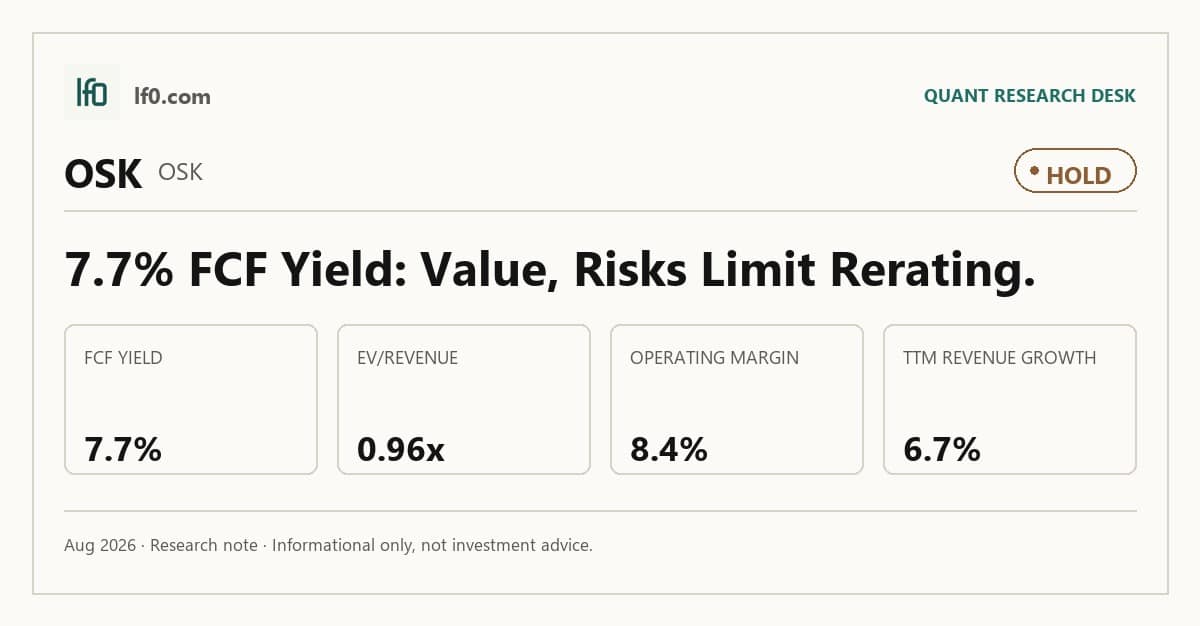
- Rated Hold — solid cash generation, but tariff and NGDV execution risk still cap upside.
- Strongest support: 0.67x net debt/EBITDA and 7.7% FCF yield.
- Biggest risk: NGDV deferred contract costs exceed future profits by about $135M.
- Valuation is fair, at 17.5x trailing P/E and 10.9x forward P/E.
- I would raise my rating if Transport margin holds near 4.0% in 2026.
Executive Summary
Rating: HOLD | OSK
Measured from adjusted close on 2026-08-17 to 2026-10-01. Sell ratings are correct when the stock falls; Hold is tracked as a +/-10% range. Daily-close data, not intraday. Calls are tracked for 182 days from publication, then frozen as a final record.
I would put my rating as a Hold because Oshkosh has a credible balance-sheet cushion and cash generation, but the market is already paying for that stability while tariff pressure and NGDV timing risk still cloud the earnings path. In my view, the most important near-term question is whether Transport can keep converting backlog into profit fast enough to offset the roughly $200M tariff headwind management flagged for 2026. I would raise my rating more towards a Buy if Transport margin holds near 4.0% in 2026 and the NGDV ramp keeps converting into revenue, because that would show the deferred contract asset is being monetized rather than sitting as a drag.
Company Profile
Oshkosh Corporation, founded in 1917 and listed on the NYSE under OSK, designs and manufactures purpose-built vehicles and equipment for construction, firefighting, airport ground support, refuse collection, defense, and delivery. It earns revenue through three reportable segments: Access, Vocational, and Transport. The company operates 37 manufacturing facilities worldwide and sells through direct teams, dealers, and distributors across six continents. Roughly 20% of 2025 net sales came from the U.S. government, mostly through multi-year defense contracts, including the Next Generation Delivery Vehicle (NGDV), the U.S. Postal Service program for up to 165,000 vehicles awarded in February 2021.
Economic Moat
Business Model
JLG’s installed base, dealer reach, and lifecycle support are the most defensible parts of Oshkosh’s model. I feel that a well-funded rival cannot recreate the combination of global distribution, parts availability, and customer-specific service coverage within three years. The value is not just the aerial work platform or telehandler; it is the operating system around uptime, training, reconditioning, and fleet support. Pierce’s dealer network and Oshkosh Defense’s long-lived installed base add another layer, and the company remains one of the sole-source suppliers for several key vehicle platforms to the U.S. Department of Defense.
The business is broader and more integrated than it was five years ago. In FY2021, Oshkosh had 11 brands and four reportable segments; today it has three reportable segments and 37 manufacturing facilities, which gives it more room to share technology and manufacturing across end markets. The January 2023 creation of Vocational, the August 2023 acquisition of AeroTech, the January 2023 acquisition of Hinowa, the September 2024 acquisition of AUSA, and the 2024 shift of non-fleet refuse and recycling vehicles to a dealer network all point in the same direction: a more unified platform with more recurring lifecycle support.
Business & Operating Risks
The most material disclosed risk is the NGDV program, because the USPS can buy up to 165,000 units over 10 years but only 51,500 units had been ordered by December 31, 2025, and deferred contract costs exceeded future profits on existing orders by about $135M. That is a direct threat to the managed-cost advantage the program was supposed to provide, so this risk does strike at the moat rather than sitting outside it.
Trade policy is the next clear headwind. Tariffs implemented by the U.S. during 2025 cost about $35M in 2025 and are expected to rise to about $200M in 2026, which means Oshkosh faces a much larger cost burden before any offsetting price action or sourcing changes. The company is also dependent on third-party suppliers for engines, chassis, axles, batteries, and other components, so delays or quality issues can either slow shipments or force higher-cost sourcing. Government contract concentration remains a real risk as well, since about 20% of 2025 net sales came from the U.S. government and procurement delays can push revenue out of the period.
Management Discussion & Analysis
Management is responding to those risks with a 2026 plan built around backlog conversion, pricing, and a visible NGDV ramp. It expects consolidated sales of $11.0 billion in 2026 versus $10.4 billion in 2025, operating income of about $1.1B, and adjusted diluted EPS of $11.50, which tells me the focus is margin and mix rather than simple top-line acceleration. Vocational is expected to benefit from backlog conversion, while Access is still expected to soften, so management is not pretending the cycle is healthy across every end market.
Capital allocation remains shareholder-friendly but measured. Oshkosh borrowed $500M under an unsecured term loan in March 2025, used the proceeds to reduce revolver borrowings, repurchased nearly 2.3M shares for $278M in 2025, and raised the quarterly dividend 11.8% to $0.57. That supports the equity, but it also tells me management is preserving flexibility rather than forcing rapid deleveraging.
Recent Events
The March 16, 2026 credit agreement reset was the most important recent development. Oshkosh replaced its prior revolving facility with a new unsecured $1.6B revolver that matures in March 2031, and it amended the $500M term loan to align key terms. In my view, that improves financial flexibility and lowers near-term refinancing risk, which matters because the operating thesis still depends on execution rather than balance-sheet repair.
The January 29, 2026 8-K was more mixed. It paired full-year earnings disclosure with caution around the 2028 targets discussed on the call, so I read those targets as aspirations rather than a hard guide. The same filing reiterated the core operating risks around NGDV and tariffs, including the estimate that tariffs cost about $35M in 2025 and could rise to about $200M in 2026.
The May 5, 2026 annual meeting was routine, with the board slate re-elected and pay approved, while the majority-vote proposal was rejected. The May 8, 2026 earnings release was also routine. Recent 8-Ks leave the investment case a bit stronger on liquidity, but the operating thesis is still being tested by USPS execution and tariff inflation.
Financial Analysis
Growth
OSK — Financial Growth (Quarterly, USD Mil)
| Metric | 2025-06-30 | 2025-09-30 | 2025-12-31 | 2026-03-31 | 2026-06-30 |
|---|---|---|---|---|---|
| REVENUE (USD Mil) | 2,732.1 | 2,688.6 | 2,688.8 | 2,317.8 | 2,915.1 |
| EBIT (USD Mil) | 301 | 269 | 211.7 | 84.5 | 250.4 |
| EBITDA (USD Mil) | 356.9 | 325.3 | 270 | 145.1 | 312.6 |
| NET INCOME (USD Mil) | 204.8 | 196.2 | 133.8 | 43.1 | 183.2 |
| DILUTED EPS | 3.2 | 3 | 2.1 | 0.7 | 2.9 |
Source: Yahoo Finance — Quarterly Financial Statements
Revenue was $2.9B in the quarter ended June 30, 2026, up from $2.3B in the March quarter, while EBITDA rose to $312.6M from $145.1M and net income increased to $183.2M from $43.1M. That rebound matters because it suggests the business can still recover quickly when mix and timing improve, but it also shows how uneven the path remains from quarter to quarter. I do not see a clean trend break yet; the latest quarter is encouraging, but it is not enough on its own to prove that growth has become durable.
Profitability
OSK — Profitability (TTM)
| Metric | TTM |
|---|---|
| Operating Margin (TTM) | 8.4% |
| Net Margin (TTM) | 5.2% |
| Return on Assets (TTM) | 5.0% |
| Return on Equity (TTM) | 12.4% |
| Gross Margin (TTM) | 15.9% |
| EBITDA Margin (TTM) | 9.8% |
Source: Yahoo Finance — Trailing Twelve Months (TTM)
TTM operating margin was 8.4%, net margin 5.2%, gross margin 15.9%, EBITDA margin 9.8%, ROA 5.0%, and ROE 12.4%. The spread from gross margin to operating margin is only 7.5 points, which tells me Oshkosh is already converting revenue into operating profit, but not with the kind of scale leverage that would support a much higher margin profile. EBITDA margin sits just 1.4 points above operating margin, so depreciation and amortisation are not the main issue; the business is already fairly close to cash operating profitability. The ROE-to-ROA gap of 7.4 points implies leverage is amplifying returns more than asset productivity is, so I would want to see operating margin move closer to the low double digits before I call this a higher-quality earnings base.
Valuation
OSK — Valuation Multiples
| Metric | Value |
|---|---|
| Market Cap (USD Mil) | 9,533 |
| Enterprise Value (USD Mil) | 10,139 |
| Trailing P/E | 17.5 |
| Forward P/E | 10.9 |
| Price/Sales (TTM) | 0.9 |
| Price/Book (mrq) | 2.1 |
| EV/Revenue | 1 |
| EV/EBITDA | 9.7 |
| FCF Yield % (TTM) | 7.7% |
| Forward EPS (USD) | 14 |
| Analyst Target Price – Low (USD) | 138 |
| Analyst Target Price – Mean (USD) | 167.3 |
| Analyst Target Price – High (USD) | 197 |
| # Analyst Opinions | 17 |
Source: Yahoo Finance
OSK trades at 17.5x trailing P/E and 10.9x forward P/E, with a 0.96x EV/Revenue multiple and a 9.7x EV/EBITDA multiple. That is not expensive for a cyclical industrial, but it is also not a bargain if earnings are still exposed to tariff pressure and NGDV timing. The 7.7% FCF yield is the cleanest support for the shares, because it shows the stock is backed by real cash generation rather than just earnings optics.
On the analysis here, I would put fair value in a range of roughly $138-$197 per share, which lines up with the analyst target range and suggests the market is already close to consensus on the base case. With 17 analyst opinions, that is a meaningful consensus rather than a thin one, so I would not argue for a valuation far outside it without a stronger margin step-up. Forward EPS is 14, and that looks reasonable against peers on a like-for-like basis: OSK’s earnings power is well below URI’s $57.2, but it is far better supported than CNH’s $0.7 and comes with a cleaner balance sheet. In my view, the market is paying for stability and cash conversion, not for a premium growth profile.
Leverage
OSK — Leverage & Coverage (Quarterly)
| Metric | Value |
|---|---|
| Total Debt/Equity % (mrq) | 24.4 |
| Current Ratio (mrq) | 1.7 |
| Total Debt (mrq, USD Mil) | 1,102.8 |
| Operating Cash Flow (TTM, USD Mil) | 1,302.4 |
| Levered Free Cash Flow (TTM, USD Mil) | 734 |
| Net Debt/EBITDA (TTM) | 0.7 |
| FCF Margin % (TTM) | 6.9% |
Source: Yahoo Finance — Quarterly Financial Statements
Total debt was $1.1B, or 24.4% of equity, while the current ratio was 1.7. That gives Oshkosh a workable liquidity cushion, not a stretched one. Operating cash flow was $1.3B TTM and levered free cash flow was $734M TTM, so cash generation is still covering debt service and leaving room for reinvestment. Net debt/EBITDA was 0.7x, which is modest leverage and suggests refinancing risk is manageable unless EBITDA weakens materially. FCF margin was 6.9%, so cash conversion is positive but not especially rich, which means working capital or capex could tighten flexibility if demand softens.
Insider Activity
The insider transaction record I see here is one-sided: three open-market sales, zero open-market purchases, and about $929,700 of selling over a 4.3-month window. The activity is concentrated rather than broad, with sales from Anupam Khare, Duncan Palmer, and John S. Verich. I do not overread it given the low insider ownership base, but it is still a mild negative because insiders are not adding exposure alongside shareholders.
Comparable Analysis
Growth
| Company | Revenue TTM (USD Mil) | Revenue Growth YoY % | Diluted EPS TTM |
|---|---|---|---|
| OSK | 10,610.3 | 6.7% | 8.7 |
| URI | 16,832 | 11.8% | 41.5 |
| STRL | 3,438.5 | 90.1% | 13.9 |
| TEX | 6,677 | 50.5% | 2.1 |
| AGCO | 10,349.1 | -1.0% | 7.2 |
| CNH | 18,185 | 2.0% | 0.2 |
Source: Yahoo Finance
OSK’s 6.7% TTM revenue growth sits below URI’s 11.8% and far behind STRL’s 90.1% and TEX’s 50.5%, while still ahead of AGCO’s -1.0% and CNH’s 2.0%. That puts Oshkosh in the middle of the pack on growth, which is exactly where I would expect a cyclical industrial with a steadier but less explosive mix to trade.
Valuation
| Company | Trailing P/E | Forward P/E | EV/Revenue | EV/EBITDA | Price/Sales (TTM) | Price/Book (mrq) | Market Cap (USD Mil) | Enterprise Value (USD Mil) | FCF Yield % (TTM) | Forward EPS | Analyst Target Price – Low | Analyst Target Price – Mean | Analyst Target Price – High | # Analyst Opinions |
|---|---|---|---|---|---|---|---|---|---|---|---|---|---|---|
| OSK | 17.5 | 10.9 | 1 | 9.7 | 0.9 | 2.1 | 9,533 | 10,139 | 7.7% | 14 | 138 | 167.3 | 197 | 17 |
| URI | 27.8 | 20.2 | 5.2 | 18.6 | 4.3 | 7.8 | 71,817 | 87,090 | 2.4% | 57.2 | 950 | 1,272.4 | 1,610 | 21 |
| STRL | 41.5 | 22.8 | 5.1 | 24.6 | 5.1 | 13 | 17,634 | 17,539 | 2.0% | 25.3 | 754 | 905.3 | 1,000 | 6 |
| TEX | 32.5 | 11.4 | 1.5 | 15.7 | 1.2 | 1.6 | 7,763 | 10,043 | 3.0% | 6 | 66.5 | 79.9 | 100 | 13 |
| AGCO | 14 | 13.5 | 0.9 | 9.6 | 0.7 | 1.7 | 7,096 | 9,704 | 6.3% | 7.5 | 99 | 123.1 | 151 | 15 |
| CNH | 41.8 | 15.1 | 2.1 | 35.8 | 0.9 | 1.7 | 16,789 | 37,917 | 3.4% | 0.7 | 10 | 13.3 | 21 | 19 |
Source: Yahoo Finance
OSK’s 0.96x EV/Revenue and 17.5x trailing P/E sit well below URI’s 5.2x and 27.8x, and far below STRL’s 5.1x and 41.5x, but above AGCO’s 0.9x and 14.0x. The market is clearly not paying OSK for URI-like growth, and that is sensible because OSK’s 6.7% growth and 8.4% operating margin are much less powerful than URI’s 11.8% growth and 26.0% operating margin. On a growth-adjusted basis, OSK looks fairly priced rather than cheap.
Profitability
| Company | Operating Margin (TTM) | Net Margin (TTM) | Return on Assets (TTM) | Return on Equity (TTM) | Gross Margin (TTM) | EBITDA Margin (TTM) |
|---|---|---|---|---|---|---|
| OSK | 8.4% | 5.2% | 5.0% | 12.4% | 15.9% | 9.8% |
| URI | 26.0% | 15.7% | 8.8% | 28.9% | 38.5% | 27.9% |
| STRL | 20.1% | 12.5% | 14.6% | 40.0% | 23.8% | 20.8% |
| TEX | 8.4% | 2.2% | 3.0% | 4.2% | 17.2% | 9.6% |
| AGCO | 5.7% | 5.2% | 3.5% | 11.8% | 25.3% | 9.8% |
| CNH | 5.5% | 1.7% | 0.9% | 3.9% | 17.8% | 5.8% |
Source: Yahoo Finance
OSK’s 8.4% operating margin, 5.2% net margin, 15.9% gross margin, and 9.8% EBITDA margin trail URI’s 26.0%, 15.7%, 38.5%, and 27.9%, and also lag STRL’s 20.1%, 12.5%, 23.8%, and 20.8%. TEX is the closest comp on operating margin at 8.4%, but its net margin is only 2.2%, which tells me OSK’s earnings quality is better even if its top-line economics are not. The gap looks structural rather than temporary, so OSK should not trade like the highest-margin peers unless the mix improves materially.
Leverage
| Company | Total Debt/Equity % (mrq) | Current Ratio (mrq) | Total Debt (mrq, USD Mil) | Net Debt/EBITDA (TTM) | FCF Margin % (TTM) |
|---|---|---|---|---|---|
| OSK | 24.4 | 1.7 | 1,102.8 | 0.7 | 6.9% |
| URI | 166.8 | 0.8 | 15,385 | 3.3 | 10.1% |
| STRL | 24.2 | 1.1 | 336.8 | -0.2 | 10.2% |
| TEX | 54.6 | 1.8 | 2,687 | 3.6 | 3.5% |
| AGCO | 66.1 | 1.3 | 2,888.5 | 2.3 | 4.3% |
| CNH | 335 | 4.9 | 26,311 | 23.5 | 3.1% |
Source: Yahoo Finance
OSK’s 24.4% debt/equity and 0.7x net debt/EBITDA are far lighter than URI’s 166.8% and 3.3x, TEX’s 54.6% and 3.6x, and especially CNH’s 335.0% and 23.5x. That lower leverage helps explain why OSK can trade at a lower multiple than URI even though URI has stronger margins and growth. In other words, investors are paying URI for both growth and balance-sheet scale, while OSK’s cleaner leverage profile supports the stock but does not by itself justify a premium.
Conclusion
The key tension is simple: Oshkosh has enough cash generation and balance-sheet flexibility to absorb a cyclical slowdown, but the next leg of the thesis depends on whether NGDV and Transport margins can offset tariff inflation before the market loses patience. I would put my rating as a Hold because the current 8.4% operating margin and 0.7x net debt/EBITDA are good enough to protect the downside, yet not strong enough to justify a rerating while tariff costs are still headed toward about $200M in 2026.
I would raise my rating more towards a Buy if Transport margin holds near 4.0% in 2026 and NGDV orders keep rising, because that would show the deferred contract asset is being monetized rather than sitting as a drag. A useful confirmation would be quarterly operating income above $250M on revenue near $3B, since that would imply the current margin base can hold while the mix improves. I would also become more constructive if the market sees evidence that tariff costs are being offset by pricing or sourcing changes, because that would protect the earnings base without requiring a perfect volume environment.
I would move from Hold to Sell if USPS orders stay materially below the 51,500 units already booked by December 31, 2025 and the deferred contract cost gap near $135M starts to widen. I would also turn more cautious if tariff costs move toward the $200M 2026 estimate without offsetting price action, since that would pressure margins and could take more than 150 basis points out of operating margin on the current sales base.
Weighing both sides, I think the bear case is the one to watch first because the next few quarters still have to prove that Transport can absorb tariff inflation and USPS timing risk at the same time. The balance sheet gives Oshkosh time, but not enough time to ignore another year of execution slippage, so I stay at Hold until the margin path is visibly cleaner.
What to Watch Next
- Transport margin near 4.0% — would support a move toward Buy.
- Quarterly operating income above $250M on about $3B of revenue — would confirm margin durability.
- USPS orders above 51,500 units — would reduce NGDV execution risk.
- Deferred contract cost gap narrowing from about $135M — would show NGDV economics are improving.
- Tariff costs staying well below $200M in 2026 — would protect the earnings base.
What’s your take? I rated Oshkosh (OSK) HOLD above — but the goal here is to get this right, not just to publish an opinion. What would you add to this analysis, or which risk or catalyst do you think I’m under- or over-weighting? Tell me in the comments.
Sources
- SEC 10-K Annual Report — filed 2026-02-17
- SEC 8-K Filing (2026-05-08)
- SEC 8-K Filing (2026-05-08)
- SEC 8-K Filing (2026-03-16)
- SEC 8-K Filing (2026-01-29)
- SEC Form 4 Insider Transaction (2026-05-13)
- SEC Form 4 Insider Transaction (2026-05-06)
- SEC Form 4 Insider Transaction (2026-05-06)
- SEC 10-K Annual Report — FY2026
- SEC 10-K Annual Report — FY2025
- SEC 10-K Annual Report — FY2024
- SEC 10-K Annual Report — FY2023
- SEC 10-K Annual Report — FY2021
Data sourced from Yahoo Finance and SEC EDGAR. Not investment advice.
Leave a Comment