
| Company | Aug 25 | Sep 25 | Oct 25 | Nov 25 | Dec 25 | Jan 26 | Feb 26 | Mar 26 | Apr 26 | May 26 | Jun 26 | Jul 26 | 12-Mo |
|---|---|---|---|---|---|---|---|---|---|---|---|---|---|
| NNDM | -1% | +14% | +10% | +2% | -13% | +16% | +6% | -10% | +2% | +1% | -17% | +3% | +7% |
| DDD | +41% | +26% | -1% | -27% | -15% | +27% | -14% | -3% | +31% | +45% | -15% | -13% | +62% |
| SSYS | -2% | +5% | -5% | -17% | -1% | +23% | -10% | -19% | +14% | +19% | -19% | -9% | -28% |
| PRLB | +16% | +0% | -1% | +2% | -0% | +4% | +18% | -8% | +14% | +17% | +8% | -8% | +74% |
| PKE | +4% | +9% | -5% | +1% | +10% | +15% | +8% | +4% | +24% | -6% | +20% | -11% | +92% |
| AVAV | -10% | +30% | +17% | -24% | -13% | +15% | -9% | -27% | +7% | +6% | -20% | -10% | -44% |
Source: Yahoo Finance monthly adjusted close.
Quick Thesis
- Rated sell because the portfolio reset has not yet produced durable earnings.
- Strongest point: 432.1M of cash against 27.3M of debt.
- Biggest risk: TTM operating margin is -47.7% and FCF margin is -1.4%.
- Valuation is rich on a recovery basis at 163.0x forward P/E.
- I would turn more constructive if quarterly revenue stays above $30M and margins improve.
Executive Summary
Rating: SELL | NNDM
Measured from adjusted close on 2026-08-13 to 2026-09-25. Sell ratings are correct when the stock falls; Hold is tracked as a +/-10% range. Daily-close data, not intraday. Calls are tracked for 182 days from publication, then frozen as a final record.
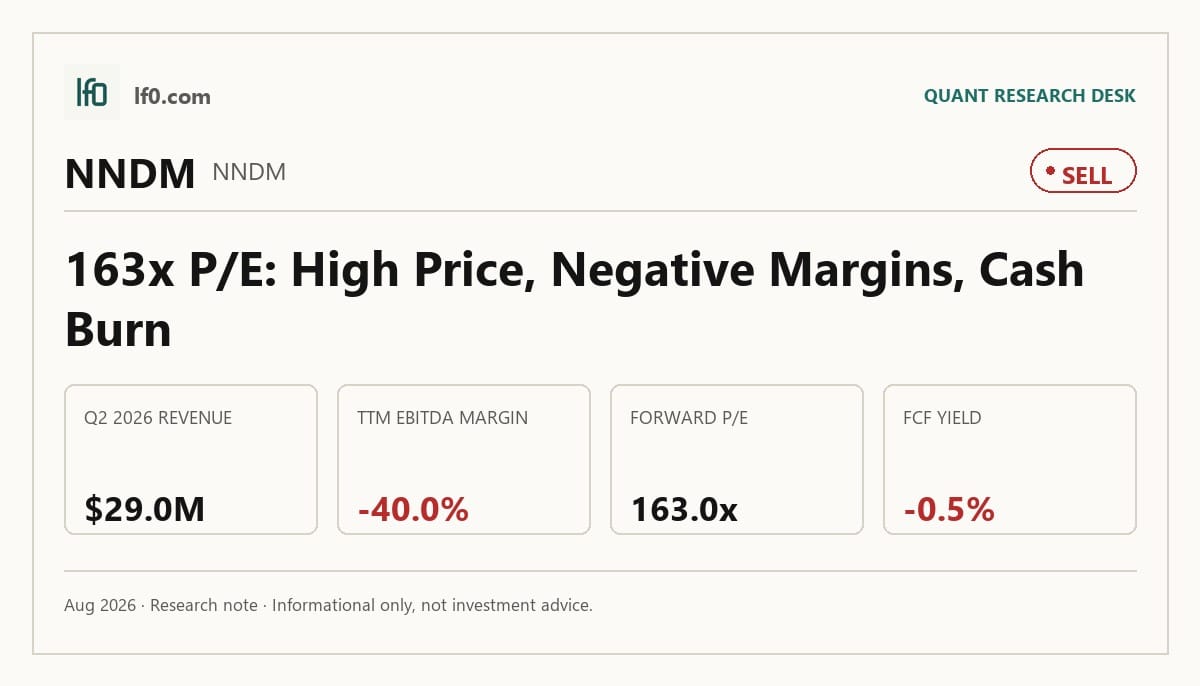
I would put my rating as a Sell because Nano Dimension is still valued on a recovery that has not shown up in the income statement. TTM operating margin was -47.7% and TTM free cash flow margin was -1.4%, so the equity is still being priced ahead of the operating model rather than on proven earnings power. The balance sheet is the main support, with $432.1M of cash against $27.3M of debt, but that cushion is financing a business that has not yet shown self-funding discipline. I would raise my rating more towards a Hold if quarterly revenue can stay above $30M for several quarters and EBITDA moves toward a positive operating margin, because that would show the acquired product set is finally converting into operating leverage rather than just top-line noise.
Company Profile
Nano Dimension designs and sells industrial manufacturing systems, software, and consumables for electronics and mechanical parts. Its core offerings span additive manufacturing, surface mount technology, and industrial inkjet printing, and it also sells design, simulation, and manufacturing-management software alongside materials used by those machines. The customer base includes aerospace, automotive, defense, electronics, medical, research, academia, and government users, which gives the company exposure to qualification-heavy end markets where switching is slower than in generic industrial equipment. Incorporated in Israel in December 1960, it began trading American Depositary Shares on Nasdaq under NNDM in March 2016 and now operates across the United States, Germany, Israel, Japan, Poland, the United Kingdom, Sweden, Switzerland, Taiwan, and other sites.
Economic Moat
Business Model
The most defensible part of the model is the bundled stack, because Nano Dimension is not selling a single machine but a mix of hardware, software, and consumables across additive manufacturing, SMT, and inkjet systems. In my view, that integrated stack is hard to copy quickly because customers buy into design, simulation, manufacturing management, and machine operation at the same time, and the company has about 383 issued U.S. and foreign patents and pending or allowed applications supporting that position. The customer mix also helps, since aerospace and defense, medical, and government buyers tend to qualify equipment slowly and value reliability over the lowest upfront price.
Business & Operating Risks
The biggest disclosed risk is execution around the September 9, 2025 strategic review, which could lead to product-line closures or divestitures and disrupt customers, employees, and partners. That risk does not directly attack the patent-backed product stack, but it does threaten the operating continuity needed to monetize it, especially after the Desktop Metal bankruptcy and the broader portfolio cleanup. The CFIUS agreements and tariff exposure add cost and compliance pressure, yet the strategic-review risk is the one that most clearly tests whether the moat can be turned into a stable business. The Barrick-style issue here is not a single customer dispute; it is whether the company can keep the integrated platform intact while it reshapes the portfolio.
Management Discussion & Analysis
Management is responding to those risks by shrinking and simplifying the portfolio, but it is doing so while still spending cash and carrying losses. The company spent $180.3M on Desktop Metal and $116.2M on Markforged in 2025, then followed with restructuring actions and a strategic alternatives review, which tells me leadership is trying to reset the asset base rather than defend every acquisition. That said, the operating response is still incomplete: the business remains loss-making, and the cash balance is being used to fund the transition rather than to prove a cleaner earnings model. In my view, management is actively addressing the portfolio risk surfaced above, but the proof point has not yet arrived in the numbers.
Recent Events
The April 6, 2026 sale of the AME and Fabrica product lines, followed by the April 30, 2026 update on a broader strategic alternatives process, shows management is monetizing non-core assets rather than trying to preserve the old structure. I read the May 26, 2026 shareholder letter and the May 27, 2026 Markforged sale announcement the same way: they improve strategic clarity and may strengthen balance-sheet flexibility, but they also confirm the company is still in the middle of a major reset. That matters for the moat because a cleaner portfolio can sharpen focus, yet repeated divestitures also show the current structure is still being rebuilt rather than defended.
Financial Analysis
Growth
NNDM — Financial Growth (Quarterly, USD Mil)
| Metric | 2025-03-31 | 2025-06-30 | 2025-09-30 | 2025-12-31 | 2026-03-31 | 2026-06-30 |
|---|---|---|---|---|---|---|
| REVENUE (USD Mil) | — | 25.8 | 26.9 | 35.3 | 29.7 | 29 |
| EBIT (USD Mil) | — | -11.1 | -29.2 | -41.7 | -69.4 | -6.4 |
| EBITDA (USD Mil) | — | -3.3 | -22.5 | -36.3 | -65.7 | -4.1 |
| NET INCOME (USD Mil) | — | -181 | -53 | -33.9 | -69.7 | -6.8 |
| DILUTED EPS | -0.1 | -0.8 | -0.2 | — | -0.3 | 0 |
Source: Yahoo Finance — Quarterly Financial Statements
Revenue was $29M in Q2 2026, up 12.1% year over year from $25.8M in Q2 2025, after $35.3M in Q4 2025 and $29.7M in Q1 2026. That path says demand is positive but uneven, so I would not treat the Q4 spike as a new run rate. EBITDA moved from -$3.3M in Q2 2025 to -$4.1M in Q2 2026, which means revenue growth has not yet translated into operating leverage. The key takeaway is that the top line is holding up, but the cost base is still volatile enough to keep the thesis from looking self-sustaining.
Profitability
NNDM — Profitability (TTM)
| Metric | TTM |
|---|---|
| Operating Margin (TTM) | -47.7% |
| Net Margin (TTM) | -135.2% |
| Return on Assets (TTM) | -5.7% |
| Return on Equity (TTM) | -24.5% |
| Gross Margin (TTM) | 38.8% |
| EBITDA Margin (TTM) | -40.0% |
Source: Yahoo Finance — Trailing Twelve Months (TTM)
TTM gross margin was 38.8%, but EBITDA margin was -40.0%, so the business is still absorbing a large operating cost base after gross profit. That gap tells me the issue is scale and overhead, not just manufacturing economics. Operating margin was -47.7% and net margin was -135.2%, which means losses deepen materially below EBITDA once depreciation, amortization, and other below-the-line items are included. Return on assets was -5.8% and return on equity was -24.5%, so capital is still earning negative returns and leverage is amplifying weak operating performance rather than creating shareholder value.
Valuation
NNDM — Valuation Multiples
| Metric | Value |
|---|---|
| Market Cap (USD Mil) | 344 |
| Enterprise Value (USD Mil) | -61 |
| Forward P/E | 163 |
| Price/Sales (TTM) | 2.8 |
| Price/Book (mrq) | 0.7 |
| EV/Revenue | -0.5 |
| EV/EBITDA | 1.3 |
| Beta (5Y Monthly) | 1.01 |
| FCF Yield % (TTM) | -0.5% |
| Forward EPS (USD) | 0 |
Source: Yahoo Finance
I would put fair value in a wide range of roughly $0.00-$5.40 per share based on the peer multiple spread and the company’s cash-rich but still loss-making profile. That range sits around the current market only if the market keeps assigning value to a recovery that has not yet shown up in earnings, and it is hard to reconcile with a business that still has negative operating margin and negative free cash flow. There is no meaningful analyst consensus to anchor against here because the reference data shows no target prices and no analyst opinions. Forward EPS is $0.01, which is effectively breakeven on a per-share basis, but that still looks thin relative to peers that already generate positive earnings power such as PRLB at $2.4 and AVAV at $4.4. The stock also trades at 163.0x forward P/E, which is rich for a company with a negative FCF yield of -0.5% and a balance sheet that is still funding the transition rather than generating cash.
Leverage
NNDM — Leverage & Coverage (Quarterly)
| Metric | Value |
|---|---|
| Total Debt/Equity % (mrq) | 5.7 |
| Current Ratio (mrq) | 10.7 |
| Total Debt (mrq, USD Mil) | 27.2 |
| Net Debt/EBITDA (TTM) | 8.4 |
| FCF Margin % (TTM) | -1.4% |
Source: Yahoo Finance — Quarterly Financial Statements
Net debt is not the issue because total debt was only $27.3M against $432.1M of cash, so the balance sheet has room. Current ratio was 10.7x, which means near-term liquidity is ample and refinancing pressure is not immediate. The weaker point is cash generation: operating cash flow was -$65.9M TTM and levered free cash flow was -$1.7M TTM, while net debt/EBITDA was 8.4x because EBITDA remains negative. In my view, that is a cash-burn story rather than a leverage story, and the cash cushion matters only if it buys time for margins to improve.
Insider Activity
I do not see a meaningful open-market insider signal here. The available filings show no open-market purchases or sales in the window, so the activity is mostly award-related and tax withholding rather than a directional view from management. That leaves the insider record neutral.
Comparable Analysis
Growth
| Company | Revenue TTM (USD Mil) | Revenue Growth YoY % | EBITDA TTM (USD Mil) | Diluted EPS TTM |
|---|---|---|---|---|
| NNDM | 120.9 | 12.1% | -48.3 | -0.7 |
| DDD | 387.6 | -0.3% | -37.1 | -0.4 |
| SSYS | 547.8 | -2.5% | -29.3 | -1.4 |
| PRLB | 560.5 | 10.6% | 74.1 | 1.3 |
| PKE | 76.2 | 18.9% | 17 | 0.6 |
| AVAV | 1,976.8 | 133.3% | 194.6 | -5.3 |
Source: Yahoo Finance
NNDM’s TTM revenue growth of 12.1% is respectable, but it trails AVAV at 133.3% and PKE at 18.9%, while PRLB posted 10.6%, DDD was -0.3%, and SSYS was -2.5%. On growth alone, NNDM sits in the middle of the pack rather than at the top, so the market is not paying for category-leading expansion.
Valuation
| Company | Forward P/E | EV/Revenue | EV/EBITDA | Price/Sales (TTM) | Price/Book (mrq) | Market Cap (USD Mil) | Enterprise Value (USD Mil) | Beta (5Y Monthly) | FCF Yield % (TTM) | Forward EPS | Analyst Target Price – Low | Analyst Target Price – Mean | Analyst Target Price – High | # Analyst Opinions |
|---|---|---|---|---|---|---|---|---|---|---|---|---|---|---|
| NNDM | 163 | -0.5 | 1.3 | 2.8 | 0.7 | 344 | -61 | 1.01 | -0.5% | 0 | — | — | — | — |
| DDD | -25.9 | 1.6 | -16.8 | 1.6 | 2.2 | 603 | 623 | 2.73 | -2.0% | -0.1 | 5 | 5.5 | 6 | 2 |
| SSYS | 49.1 | 1 | -19 | 1.4 | 0.9 | 767 | 556 | 1.94 | 3.7% | 0.2 | 11.5 | 12.3 | 13.5 | 3 |
| PRLB | 38 | 3.6 | 27.4 | 3.9 | 3.1 | 2,172 | 2,032 | 1.41 | 1.9% | 2.4 | 87 | 95.5 | 110 | 4 |
| PKE | 74.6 | 9.7 | 43.5 | 10.9 | 6.1 | 828 | 739 | 0.42 | 1.1% | 0.5 | 42 | 42.5 | 43 | 2 |
| AVAV | 44 | 5 | 51.2 | 5 | 2.2 | 9,808 | 9,974 | 1.41 | -2.6% | 4.4 | 148.6 | 225.8 | 326 | 19 |
Source: Yahoo Finance
NNDM’s 163.0x forward P/E is far above PRLB at 38.0x, SSYS at 49.1x, PKE at 74.6x, and AVAV at 44.0x, even though NNDM’s forward EPS is $0.01. Its EV/Revenue of -0.5x and Price/Sales of 2.8x are not obviously cheap either, especially with a negative FCF yield of -0.5%. I think the market is still paying for a rerating that depends on margin repair, not just revenue growth, and that is why the valuation looks stretched relative to the operating profile.
Profitability
| Company | Operating Margin (TTM) | Net Margin (TTM) | Return on Assets (TTM) | Return on Equity (TTM) | Gross Margin (TTM) | EBITDA Margin (TTM) |
|---|---|---|---|---|---|---|
| NNDM | -47.7% | -135.2% | -5.7% | -24.5% | 38.8% | -40.0% |
| DDD | -11.3% | -14.1% | -6.4% | -21.3% | 33.8% | -9.6% |
| SSYS | -19.9% | -21.0% | -4.4% | -14.3% | 42.4% | -5.3% |
| PRLB | 8.9% | 5.4% | 3.3% | 4.5% | 45.4% | 13.2% |
| PKE | 21.9% | 16.7% | 7.1% | 10.8% | 31.9% | 22.3% |
| AVAV | 2.8% | -13.4% | -1.3% | -10.0% | 25.3% | 9.8% |
Source: Yahoo Finance
NNDM’s gross margin of 38.8% is below PRLB’s 45.4% and SSYS’s 42.4%, but the bigger issue is the gap to operating profitability: NNDM’s -47.7% operating margin and -40.0% EBITDA margin are much weaker than DDD’s -11.3% and -9.6%. PRLB already converts gross profit into positive operating income, which is why its 8.9% operating margin and 13.2% EBITDA margin deserve a premium that NNDM does not yet earn.
Leverage
| Company | Total Debt/Equity % (mrq) | Current Ratio (mrq) | Total Debt (mrq, USD Mil) | Operating Cash Flow TTM (USD Mil) | Free Cash Flow TTM (USD Mil) | Net Debt/EBITDA (TTM) | FCF Margin % (TTM) |
|---|---|---|---|---|---|---|---|
| NNDM | 5.7 | 10.7 | 27.2 | -65.9 | -1.7 | 8.4 | -1.4% |
| DDD | 55.6 | 3.4 | 152.2 | -42.3 | -11.9 | -0.5 | -3.1% |
| SSYS | 3.2 | 3.2 | 26.7 | 13 | 28.1 | 7.2 | 5.1% |
| PRLB | 0.3 | 3.6 | 2.2 | 78.5 | 41.8 | -1.9 | 7.4% |
| PKE | 0.2 | 15.3 | 0.3 | 12.6 | 9.2 | -5.3 | 12.0% |
| AVAV | 19 | 4.3 | 834.8 | -78.4 | -251.4 | 1 | -12.7% |
Source: Yahoo Finance
NNDM’s debt/equity ratio of 5.7% is low, but its net debt/EBITDA of 8.4x is high because EBITDA is negative and cash flow is still weak. That combination matters because the company has cash on hand, yet it is not generating enough operating cash to make the balance sheet self-funding. Compared with PRLB and PKE, which both have positive free cash flow margins, NNDM’s leverage profile is less about debt risk and more about how long the cash cushion can support the turnaround.
Conclusion
I would put my rating as a Sell because the key tension is still unresolved: the company has enough cash to keep going, but it has not yet shown that the post-acquisition portfolio can turn revenue into durable earnings. The numbers do not show the risk already being fixed. Revenue reached $29M in Q2 2026, but EBITDA was still -$4.1M and TTM operating margin remained -47.7%, so the operating model is not yet close to self-funding.
I would move from Sell toward a Hold if quarterly revenue can stay above $30M for several quarters and EBITDA loss narrows into a positive operating margin, meaning the business is finally converting the portfolio reset into real operating leverage. I would also want to see quarterly cash burn move close to breakeven, because that would show the $432.1M cash balance is being used to build a stronger model rather than to bridge a weak one. On the other hand, I would move from Sell to Strong Sell if quarterly revenue slips back below $25M or if EBITDA loss widens again toward the Q1 2026 level of -$65.7M, because that would tell me the reset is not stabilizing the business and the cash balance is being consumed faster than the model can replace it.
Weighing both paths, I think the bear case is more likely to show up first because the company still has to prove that the new portfolio can hold revenue above $30M without another round of restructuring drag. The cash balance buys time, but it does not change the fact that the operating model is still not earning its cost of capital.
What to Watch Next
- Quarterly revenue above $30M — would support a Hold case.
- EBITDA turning positive — would show operating leverage is finally working.
- Operating cash flow moving toward breakeven — would reduce reliance on cash reserves.
- Quarterly revenue below $25M — would strengthen the bear case.
- EBITDA loss widening toward -$65.7M — would signal the reset is failing.
What’s your take? I rated Nano Dimension (NNDM) SELL above — but the goal here is to get this right, not just to publish an opinion. What would you add to this analysis, or which risk or catalyst do you think I’m under- or over-weighting? Tell me in the comments.
Sources
- SEC 10-K Annual Report — filed 2026-03-31
- SEC 8-K Filing (2026-05-27)
- SEC 8-K Filing (2026-05-26)
- SEC 8-K Filing (2026-05-07)
- SEC 8-K Filing (2026-04-30)
- SEC 8-K Filing (2026-04-06)
- SEC 8-K Filing (2026-03-31)
- SEC Form 4 Insider Transaction (2026-06-04)
- SEC Form 4 Insider Transaction (2026-06-02)
- SEC Form 4 Insider Transaction (2026-05-29)
Data sourced from Yahoo Finance and SEC EDGAR. Not investment advice.
Leave a Comment