
| Company | Aug 25 | Sep 25 | Oct 25 | Nov 25 | Dec 25 | Jan 26 | Feb 26 | Mar 26 | Apr 26 | May 26 | Jun 26 | Jul 26 | 12-Mo |
|---|---|---|---|---|---|---|---|---|---|---|---|---|---|
| EPAM | +12% | -14% | +8% | +14% | +10% | +2% | -32% | -4% | -16% | -10% | -23% | +33% | -33% |
| KD | -16% | -6% | -4% | -11% | +3% | -13% | -46% | +6% | +5% | -10% | -9% | +20% | -64% |
| GLOB | -20% | -15% | +7% | +3% | +3% | +2% | -26% | -7% | -11% | -2% | -28% | +26% | -57% |
| ACN | -3% | -5% | +1% | -0% | +7% | -2% | -21% | -5% | -9% | +5% | -33% | +35% | -37% |
| CTSH | +1% | -7% | +9% | +7% | +7% | -1% | -21% | -5% | -14% | +6% | -31% | +43% | -21% |
| INFY | +1% | -3% | +3% | +5% | +2% | -1% | -18% | -6% | -8% | +2% | -15% | +15% | -25% |
Source: Yahoo Finance monthly adjusted close.
Executive Summary
Rating: HOLD | EPAM
Measured from adjusted close on 2026-08-10 to 2026-09-21. Sell ratings are correct when the stock falls; Hold is tracked as a +/-10% range. Daily-close data, not intraday. Calls are tracked for 182 days from publication, then frozen as a final record.
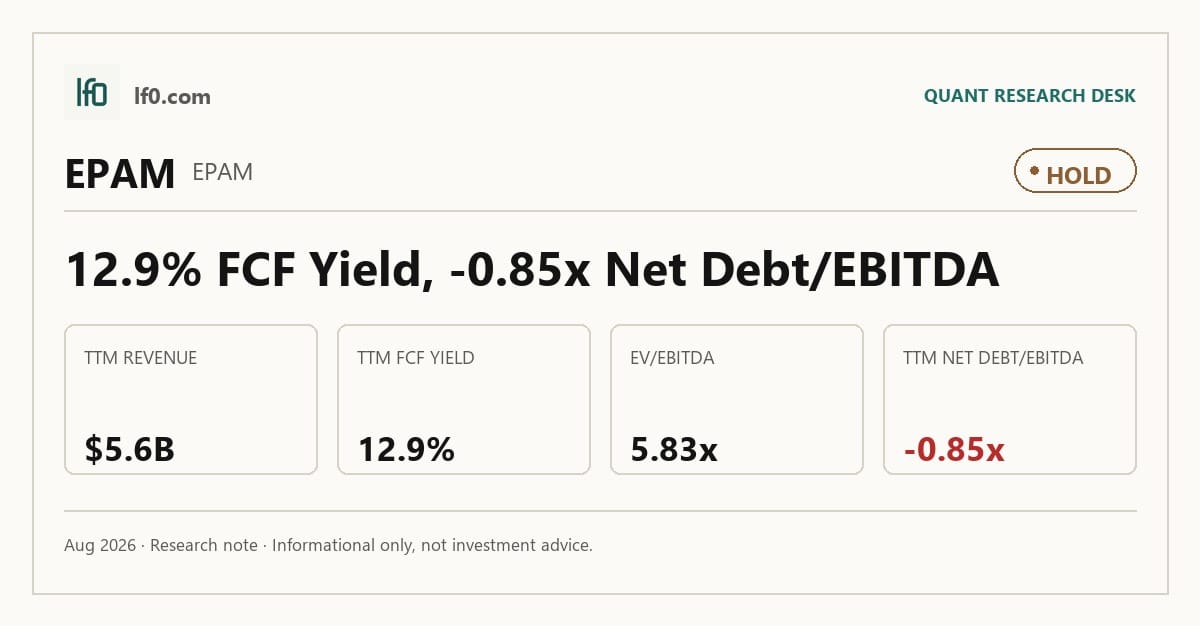
I would put my rating as a Hold because EPAM has a strong cash profile and a defensible delivery platform, but the latest numbers still show only modest growth and no clean proof that AI-led demand is offsetting geopolitical disruption. Revenue reached $1.4B in the latest quarter and $5.6B TTM, while FCF yield was 12.9% and net debt/EBITDA was -0.8x, so the balance sheet is not the issue; the question is whether earnings can reaccelerate enough to justify a higher multiple. I would raise my rating more towards a Buy if quarterly EBITDA can hold above $184.8M for several quarters, because that would show the margin reset is durable rather than a one-quarter bounce.
Company Profile
EPAM Systems, Inc. provides digital engineering, cloud, artificial intelligence-enabled transformation, and business and experience consulting services to global enterprises and start-ups. It earns revenue from software development, product engineering, cloud migration, data and analytics, cybersecurity, customer experience, and managed services, delivered through EPAM Continuum and proprietary platforms such as EPAM AI RUN and DIALX Lab. Founded in 1993, the predecessor business later became EPAM Systems, Inc., which was incorporated in Delaware on December 18, 2002 and listed on the New York Stock Exchange under EPAM.
The company serves clients across financial services, software and hi-tech, consumer goods, retail and travel, business information and media, life sciences and healthcare, plus energy, telecom, industrial, automotive, and government. As of December 31, 2025, it employed about 62,850 people, including 56,600 delivery professionals, with major delivery centers in India, Ukraine, Poland, Belarus, and Mexico. That mix gives EPAM scale, but it also leaves the business exposed to delivery concentration in a few countries.
Economic Moat
Business Model
The most defensible part of EPAM’s model is the combination of deep software engineering talent and a proprietary global delivery platform. I feel that a competitor could hire engineers, but it would be much harder to rebuild the operating system around them: the company’s award-winning delivery platform, proprietary project management tools, ISO 27001, ISO 27701, and ISO 9001 controls, plus SOC1, SOC2, and SOC3 reporting for certain services create a trust layer that matters when clients outsource core digital work. EPAM also looks genuinely AI-oriented rather than merely promotional, with EPAM AI RUN and DIALX Lab named in the 10-K, and that matters because buyers increasingly want one vendor that can move from strategy to build to deployment in a single engagement.
Scale and client stickiness reinforce that moat. EPAM had approximately 56,600 delivery professionals and 62,850 total employees as of December 31, 2025, which lets it staff large, multi-country programs without relying on a single location. In addition, 64.4% of 2025 revenue came from clients that had used EPAM for at least five years, and 35.7% came from clients with at least ten years of history, which tells me the company is embedded in long-running programs rather than one-off projects. That customer tenure is consistent with the delivery-platform advantage described above.
Business & Operating Risks
The biggest disclosed risk is the Ukraine and Belarus exposure. According to the risk factors in EPAM’s SEC 10-K, the company had approximately 14,100 global delivery, administrative, and support personnel in those two countries as of December 31, 2025, and clients have already blocked internet communications with those locations. That is not a theoretical issue: the company also owns an office building in Kyiv and leases space in multiple Ukrainian cities, so an escalation could hit both people and physical assets while forcing more expensive delivery shifts to other geographies.
AI adoption is the next major risk. The filing says clients may expect EPAM to use AI alongside human delivery personnel at lower cost, while AI tools can also let clients build software internally and reduce reliance on third-party providers. If AI lowers the labor content of software work, clients can demand price cuts or move work in-house, which would compress revenue and billing rates. Client concentration and short-cycle demand add another layer of pressure, because EPAM generally does not have long-term commitments and clients can terminate or not renew projects.
The disclosed risks do threaten the moat, but they do not break it outright. The Ukraine and Belarus exposure strikes at the global delivery advantage, yet the broader platform, client tenure, and geographic spread still give EPAM more resilience than a single-country delivery shop.
Management Discussion & Analysis
Management is responding to the disclosed risks, but not eliminating them. The company has continued to rebalance delivery away from the most exposed geographies, while also leaning into AI platforms and selective acquisitions to broaden the service mix. That helps with concentration risk, but the Ukraine and Belarus issue remains unresolved and still sits over the operating model.
The 2025 numbers show why I remain cautious. Revenue from the first twelve months after the fourth-quarter 2024 deals added 9.2% to 2025 revenue, but cost of revenues rose to 71.2% of sales from 69.3% in 2024 and operating margin fell to 9.5% from 11.5%. In other words, management is growing the platform, yet the mix is not converting into cleaner earnings fast enough. The acquisition contribution was real, but it came with a margin cost, so I do not read the buyback program as proof of excess cash so much as a sign that management still sees value in the equity.
Recent Events
The most significant development is the $300M accelerated share repurchase announced on March 5, 2026. EPAM is funding it with cash on hand and borrowings under its existing credit facility, which tells me management is still confident enough in cash generation to lean into buybacks rather than preserve every dollar of liquidity.
The May 7, 2026 first-quarter results release was more routine, but it still matters because it keeps the market focused on whether the company can convert its AI and engineering positioning into sustained demand. On May 21, 2026, stockholders approved larger equity incentive pools, a charter amendment enabling special meetings, and new bylaws to match that change. I view that as a modestly constructive signal for talent retention and governance, but it does not change the core thesis on its own.
Financial Analysis
Growth
EPAM — Financial Growth (Quarterly, USD Mil)
| Metric | 2025-06-30 | 2025-09-30 | 2025-12-31 | 2026-03-31 | 2026-06-30 |
|---|---|---|---|---|---|
| REVENUE (USD Mil) | 1,353.4 | 1,394.4 | 1,407.5 | 1,400.1 | 1,414.8 |
| EBIT (USD Mil) | 126.5 | 144.9 | 149.3 | 116.8 | 142.4 |
| EBITDA (USD Mil) | 168.4 | 186.6 | 190.4 | 158.7 | 184.8 |
| NET INCOME (USD Mil) | 88 | 106.8 | 109.4 | 82.5 | 103 |
| DILUTED EPS | 1.6 | 1.9 | 2 | 1.5 | 2 |
Source: Yahoo Finance — Quarterly Financial Statements
Revenue rose from $1,353.4M in the quarter ended June 30, 2025 to $1,414.8M in the quarter ended June 30, 2026, a 4.5% increase that says the business is stabilizing rather than reaccelerating. The path was choppy, with EBITDA moving from $168.4M to $184.8M over the same span, so the top line is improving but not yet translating into a smooth earnings ramp. That matters for the moat because a delivery platform only earns a premium if it can turn scale into consistent growth, not just intermittent rebounds.
Profitability
EPAM — Profitability (TTM)
| Metric | TTM |
|---|---|
| Operating Margin (TTM) | 10.9% |
| Net Margin (TTM) | 7.2% |
| Return on Assets (TTM) | 8.5% |
| Return on Equity (TTM) | 11.2% |
| Gross Margin (TTM) | 29.4% |
| EBITDA Margin (TTM) | 13.4% |
Source: Yahoo Finance — Trailing Twelve Months (TTM)
TTM gross margin was 29.4%, EBITDA margin was 13.4%, operating margin was 10.9%, and net margin was 7.2%. The 18.5-point gap between gross and operating margin tells me EPAM still carries a heavy opex load relative to revenue, so the main issue is scale and delivery efficiency rather than a broken cost-of-service model. ROA was 8.5% and ROE was 11.2%, which shows the business is profitable without relying on aggressive leverage. The margin structure is good enough to support the thesis, but not yet strong enough to justify a premium multiple on its own.
Valuation
EPAM — Valuation Multiples
| Metric | Value |
|---|---|
| Market Cap (USD Mil) | 5,026 |
| Enterprise Value (USD Mil) | 4,390 |
| Trailing P/E | 13.2 |
| Forward P/E | 6.9 |
| Price/Sales (TTM) | 0.9 |
| Price/Book (mrq) | 1.4 |
| EV/Revenue | 0.8 |
| EV/EBITDA | 5.8 |
| Beta (5Y Monthly) | 1.37 |
| FCF Yield % (TTM) | 12.9% |
| Forward EPS (USD) | 14 |
| Analyst Target Price – Low (USD) | 85 |
| Analyst Target Price – Mean (USD) | 131.5 |
| Analyst Target Price – High (USD) | 200 |
| # Analyst Opinions | 17 |
Source: Yahoo Finance
I would put EPAM in the Hold bucket because the valuation is not demanding, but it is also not cheap enough to ignore the uneven earnings base. EV/Revenue is 0.8x, EV/EBITDA is 5.8x, and forward P/E is 6.9x, which tells me the market is already discounting a meaningful earnings recovery. FCF yield is 12.9% and price/book is 1.4x, so the stock is not priced for distress, yet the multiple still depends on EBITDA staying near the current run rate.
On my read, fair value sits in a wide range of roughly $85–$200, which is broadly consistent with the analyst target range and the fact that 17 analysts cover the name. That range is not especially tight, and that is the point: the market is not agreeing on how much of the recovery is durable. I would place more weight on the lower half of the range because the revenue trend is only mid-single-digit growth and the margin base has not yet proven a clean step-up.
On an earnings basis, I would frame fair EPS power at roughly $12-$15, versus forward EPS of 14.0. That sits below the richer earnings power implied by peers such as ACN and INFY on a quality-adjusted basis, but it is still respectable for a company with EPAM’s balance sheet and cash generation. In my view, the market is paying for a recovery that still needs to show up more clearly in operating margin and revenue acceleration.
Leverage
EPAM — Leverage & Coverage (Quarterly)
| Metric | Value |
|---|---|
| Total Debt/Equity % (mrq) | 4.3 |
| Current Ratio (mrq) | 2.8 |
| Total Debt (mrq, USD Mil) | 152.2 |
| Operating Cash Flow (TTM, USD Mil) | 538.8 |
| Levered Free Cash Flow (TTM, USD Mil) | 650.2 |
| Net Debt/EBITDA (TTM) | -0.8 |
| FCF Margin % (TTM) | 11.6% |
Source: Yahoo Finance — Quarterly Financial Statements
EPAM’s leverage is light and the cash profile is strong. Total debt to equity was 4.3%, current ratio was 2.8x, and total debt was $152.2M, which leaves the balance sheet with ample room to absorb a downturn. Operating cash flow was $538.8M TTM, levered free cash flow was $650.2M TTM, net debt/EBITDA was -0.8x, and FCF margin was 11.6% TTM. The negative net debt figure means cash exceeds debt, so refinancing risk is limited unless cash falls sharply or the company takes on debt for an acquisition or buyback.
Insider Activity
The insider transaction record I see here is net selling over the 2025-01-27 to 2026-05-22 window, with $6.9M of open-market sales versus $45,000 of open-market purchases across 52 Form 4 filings. The buying is concentrated in one coordinated cluster on 2026-04-30 across six insiders, while the selling side is larger in dollar terms, so alignment looks mixed but still tilted bearish. I would not overread one buying cluster, but I do think the broader pattern argues for caution.
Comparable Analysis
Growth
| Company | Revenue TTM (USD Mil) | Revenue Growth YoY % | Diluted EPS TTM |
|---|---|---|---|
| EPAM | 5,616.8 | 4.5% | 7.4 |
| KD | 14,967 | -3.3% | 0.4 |
| GLOB | 2,450.9 | -0.7% | 2.5 |
| ACN | 73,100.6 | 5.6% | 12.5 |
| CTSH | 21,642 | 4.5% | 4.7 |
| INFY | 20,299 | 2.9% | 0.8 |
Source: Yahoo Finance
EPAM’s revenue growth was 4.5% TTM, versus 5.6% for ACN, 4.5% for CTSH, 2.9% for INFY, and declines of 0.7% for GLOB and 3.3% for KD. That puts EPAM in the middle of the pack on top-line growth, so the stock is not being rewarded for clear revenue leadership; the premium has to come from margin recovery or cash generation instead.
Valuation
| Company | Trailing P/E | Forward P/E | EV/Revenue | EV/EBITDA | Price/Sales (TTM) | Price/Book (mrq) | Market Cap (USD Mil) | Enterprise Value (USD Mil) | Beta (5Y Monthly) | FCF Yield % (TTM) | Forward EPS | Analyst Target Price – Low | Analyst Target Price – Mean | Analyst Target Price – High | # Analyst Opinions |
|---|---|---|---|---|---|---|---|---|---|---|---|---|---|---|---|
| EPAM | 13.2 | 6.9 | 0.8 | 5.8 | 0.9 | 1.4 | 5,026 | 4,390 | 1.37 | 12.9% | 14 | 85 | 131.5 | 200 | 17 |
| KD | 37.9 | 5.5 | 0.4 | 4.6 | 0.2 | 2.7 | 3,054 | 5,977 | 1.72 | 86.9% | 2.5 | 13 | 14 | 16 | 5 |
| GLOB | 15.2 | 5.7 | 0.8 | 4.9 | 0.7 | 0.8 | 1,615 | 1,942 | 0.97 | 16.6% | 6.6 | 31 | 54.5 | 110 | 22 |
| ACN | 14 | 12 | 1.5 | 8.3 | 1.5 | 3.4 | 107,530 | 107,365 | 1.07 | 11.2% | 14.7 | 130 | 178.9 | 275 | 25 |
| CTSH | 12.4 | 9.1 | 1.2 | 6.7 | 1.3 | 1.8 | 27,278 | 27,020 | 0.81 | 8.1% | 6.3 | 42 | 63.9 | 84 | 25 |
| INFY | 15.5 | 14.8 | 4.9 | 22.2 | 2.5 | 10.6 | 50,748 | 99,338 | 0.11 | 6.2% | 0.8 | 9 | 11.9 | 14.1 | 12 |
Source: Yahoo Finance
EPAM trades at 0.8x EV/Revenue and 5.8x EV/EBITDA, which is close to GLOB at 0.8x and 4.9x, below ACN at 1.5x and 8.3x, and above KD at 0.4x and 4.6x. The stock’s 12.9% FCF yield is stronger than ACN’s 11.2%, CTSH’s 8.1%, and INFY’s 6.2%, but it is still priced as a recovery name rather than a true bargain. That makes sense to me because EPAM’s leverage is much lower than KD’s and its cash generation is cleaner, so the market is paying for balance-sheet safety as well as earnings quality.
Profitability
| Company | Operating Margin (TTM) | Net Margin (TTM) | Return on Assets (TTM) | Return on Equity (TTM) | Gross Margin (TTM) | EBITDA Margin (TTM) |
|---|---|---|---|---|---|---|
| EPAM | 10.9% | 7.2% | 8.5% | 11.2% | 29.4% | 13.4% |
| KD | 2.9% | 0.6% | 3.0% | 6.9% | 21.8% | 8.8% |
| GLOB | 8.5% | 4.5% | 4.7% | 5.2% | 34.9% | 16.0% |
| ACN | 17.0% | 10.7% | 10.9% | 24.4% | 32.0% | 17.7% |
| CTSH | 17.5% | 10.3% | 10.7% | 14.9% | 33.4% | 18.6% |
| INFY | 21.2% | 16.4% | 15.3% | 32.0% | 29.7% | 22.1% |
Source: Yahoo Finance
EPAM’s gross margin of 29.4% is above KD’s 21.8% and close to INFY’s 29.7%, while its EBITDA margin of 13.4% trails ACN’s 17.7%, CTSH’s 18.6%, and INFY’s 22.1%. EPAM’s 10.9% operating margin and 7.2% net margin are also ahead of KD’s 2.9% and 0.6%, but below ACN’s 17.0% and 10.7%, which means the business is profitable enough to justify a solid multiple, not enough to earn a top-tier services premium.
Leverage
| Company | Total Debt/Equity % (mrq) | Current Ratio (mrq) | Total Debt (mrq, USD Mil) | Operating Cash Flow TTM (USD Mil) | Free Cash Flow TTM (USD Mil) | Net Debt/EBITDA (TTM) | FCF Margin % (TTM) |
|---|---|---|---|---|---|---|---|
| EPAM | 4.3 | 2.8 | 152.2 | 538.8 | 650.2 | -0.8 | 11.6% |
| KD | 422.5 | 0.8 | 4,930 | 762 | 2,652.6 | 2.2 | 17.7% |
| GLOB | 21.1 | 1.8 | 462.7 | 339.9 | 267.8 | 0.7 | 10.9% |
| ACN | 25 | 1.3 | 8,388.8 | 13,182.1 | 12,089.4 | -0.1 | 16.5% |
| CTSH | 14.5 | 2.2 | 2,094 | 2,917 | 2,215.5 | 0.3 | 10.2% |
| INFY | 9.5 | 1.9 | 923 | 4,092 | 3,165.6 | -0.5 | 15.6% |
Source: Yahoo Finance
EPAM’s total debt to equity is 4.3%, current ratio is 2.8x, and net debt/EBITDA is -0.8x, versus KD at 422.5%, 0.8x, and 2.2x, GLOB at 21.1%, 1.8x, and 0.7x, ACN at 25.0%, 1.3x, and -0.1x, CTSH at 14.5%, 2.2x, and 0.3x, and INFY at 9.5%, 1.9x, and -0.5x. EPAM’s $650.2M of levered free cash flow TTM and 11.6% FCF margin also compare well, so the balance sheet is not a constraint and should support buybacks or reinvestment if growth re-accelerates.
Conclusion
I would put my rating as a Hold because EPAM has a clean balance sheet and strong cash generation, but the latest numbers still do not prove that growth and margin recovery are durable enough to justify a higher multiple. Revenue is up 4.5% TTM and EBITDA margin is 13.4% TTM, which is good enough to keep the thesis alive, but not strong enough to say the market is underestimating the business.
The bull case is straightforward: if quarterly EBITDA can hold above $184.8M for several quarters and operating margin moves back above 12.0%, meaning the company is converting more of its revenue into profit, I would move more towards a Buy. That would tell me the delivery platform is absorbing the AI transition and the geopolitical rebalancing without sacrificing earnings power. A second bull trigger would be another quarter of free cash flow above $150M, because that would confirm the cash conversion is repeatable and would leave room for buybacks without leaning on the balance sheet.
The bear case is just as clear. If revenue turns negative for two consecutive quarters or operating margin slips below 9.0%, meaning the earnings base is losing altitude rather than stabilizing, I would move from Hold toward Sell. I would also turn more cautious if TTM free cash flow falls materially, because the current cash cushion is one of the few things preventing a slower demand cycle from showing up directly in the equity.
Weighing both sides, I think the bear case is more likely to show up first because the latest numbers still show choppy earnings and only modest top-line growth. EPAM is good enough to own, but not yet strong enough on current evidence to justify paying up for a recovery that the financials have not fully delivered.
What’s your take? I rated EPAM Systems (EPAM) HOLD above — but the goal here is to get this right, not just to publish an opinion. What would you add to this analysis, or which risk or catalyst do you think I’m under- or over-weighting? Tell me in the comments.
Sources
- SEC 10-K Annual Report — filed 2026-02-26
- SEC 8-K Filing (2026-05-26)
- SEC 8-K Filing (2026-05-07)
- SEC 8-K Filing (2026-04-01)
- SEC 8-K Filing (2026-03-12)
- SEC 8-K Filing (2026-03-05)
- SEC 8-K Filing (2026-02-19)
- SEC Form 4 Insider Transaction (2026-05-22)
- SEC Form 4 Insider Transaction (2026-05-22)
- SEC Form 4 Insider Transaction (2026-05-22)
- SEC 10-K Annual Report — FY2026
- SEC 10-K Annual Report — FY2025
- SEC 10-K Annual Report — FY2024
- SEC 10-K Annual Report — FY2023
- SEC 10-K Annual Report — FY2022
Data sourced from Yahoo Finance and SEC EDGAR. Not investment advice.
Leave a Comment